NGL Energy Partners: crude rose by a third but EBITDA fell 43% – the price did not translate into earnings
On 6 November NGL Energy Partners reported results for the quarter ended 30 September 2026. The average Brent price in the period was USD 91.3 versus USD 68 a year earlier (+34.2%), Henry Hub – USD 2.893 versus USD 3.083 (–6.2%). At the year-ago volumes and costs and moving only prices, our calculation implies revenue of USD 782.8m and EBITDA of USD 269.6m; actual revenue reached USD 986.6m but EBITDA only USD 91.9m, 65.9% below the implied figure. With EV/EBITDA at 15.7 against its own three-year average of 6.2 and net debt of USD 3.5bn, the share looks expensive, hence the verdict – unattractive.
Key takeaways
— Brent rose 34.2% year on year while Henry Hub fell 6.2% – the price backdrop was mixed
— At the year-ago volumes and costs, prices implied EBITDA of USD 269.6m; the company reported USD 91.9m – a gap of USD 177.7m
— Revenue grew 46.2% year on year but the EBITDA margin compressed from 23.9% to 9.3%
— A net loss of USD 44.3m against operating profit of USD 23.9m – items below operating income, including USD 68.2m of depreciation, turned the result negative
— Net debt rose from USD 3.0bn on 30 September 2025 to USD 3.5bn on 30 September 2026
— EV/EBITDA of 15.7 against its own three-year average of 6.2 – the share is 154% more expensive than its history
— At current prices the portal spot model implies EBITDA of USD 422m and EV/EBITDA of 12.6
Attractiveness
Key figures, USD bn
| Metric | Q3 2025 | Q3 2026 | Change |
|---|---|---|---|
| Revenue | 0.67 | 0.99 | +46.2% |
| EBITDA | 0.16 | 0.09 | -43.1% |
| Operating profit | 0.09 | 0.02 | -74.6% |
| Net profit | 0.03 | -0.04 | -251.1% |
| Operating cash flow | 0.07 | 0.09 | +28.4% |
| Capex | 0.05 | 0.12 | +122.3% |
| EBITDA margin | 23.9% | 9.3% | -14.6 pp |
| Net margin | 4.3% | -4.5% | -8.8 pp |
Brent rose 34.2% year on year while Henry Hub fell 6.2% – the price backdrop was mixed
The average Brent price in the quarter ended 30 September 2026 was USD 91.3 versus USD 68 a year earlier – up 34.2%. Against the previous quarter crude fell 5.6% from USD 96.8. Spot on 6 November was USD 100, 9.5% above the reported-period average.
US gas moved the other way: Henry Hub averaged USD 2.893 versus USD 3.083 a year earlier (–6.2%) and USD 2.926 a quarter earlier (–1.1%). Spot is now USD 2.99, 3.4% above the period average.
For a company selling both crude and gas, this backdrop does not deliver a one-way gain: the oil leg rose sharply while the gas leg slipped. That is why the price effect has to be set against the actual result rather than treating revenue growth as a clean price win.
Commodity prices: period average and now
| Benchmark | Year ago | Q2 2026 | YoY | Spot 2026-11-06 |
|---|---|---|---|---|
| Brent, USD | 68,0 | 91,3 | +34,2% | 100,0 |
| Henry Hub, USD | 3,08 | 2,89 | -6,2% | 2,99 |
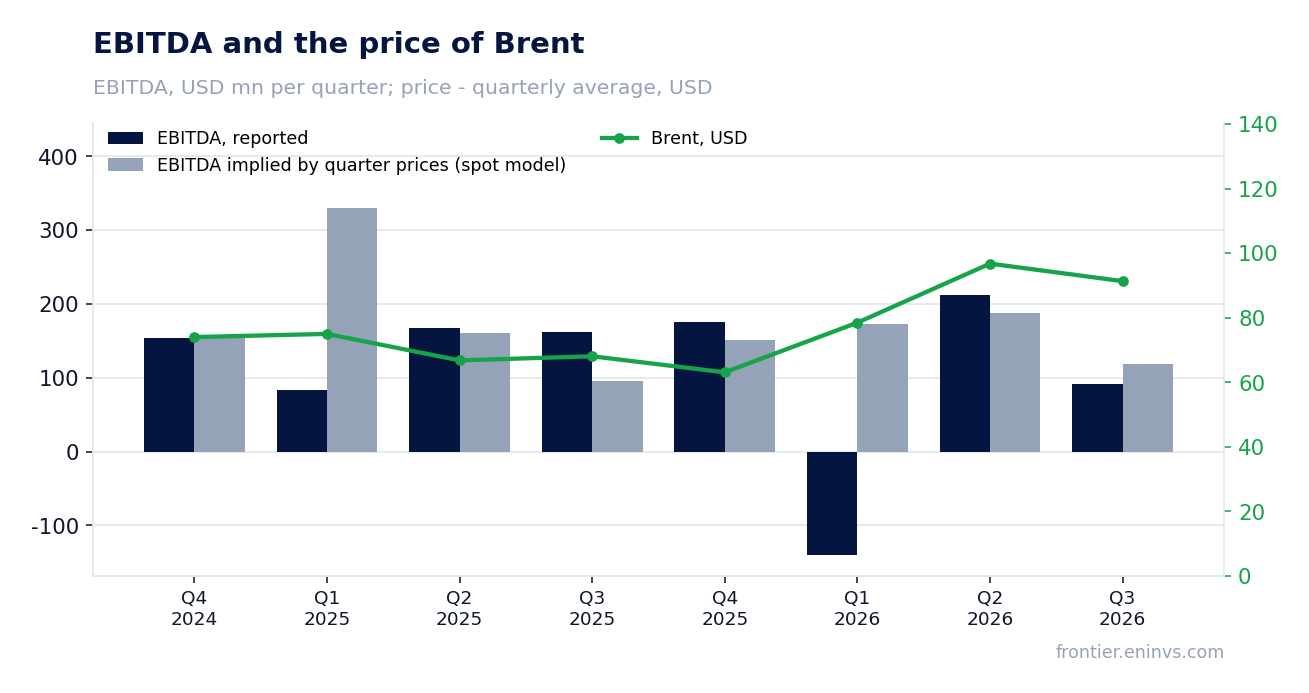
At the year-ago volumes and costs, prices implied EBITDA of USD 269.6m; the company reported USD 91.9m – a gap of USD 177.7m
At the year-ago volumes and non-commodity costs and moving only prices, our calculation implies revenue of USD 782.8m (price effect +USD 108.2m, +16.0%) and EBITDA of USD 269.6m. Actual revenue was USD 986.6m, USD 203.7m above the implied figure (+26.0%); actual EBITDA was USD 91.9m, USD 177.7m below (–65.9%).
The gap means the price did not reach EBITDA: revenue ran ahead of the price-implied benchmark while profit lagged it. The causes named in the facts are volumes, realised price against the benchmark, unit costs, hedges and one-offs; none of them allows the gap to be put down to the benchmark itself.
The portal spot model, re-priced from the average of the previous four quarters, expected EBITDA of USD 118.5m and revenue of USD 917m. Actuals were USD 91.9m EBITDA (–22.5% versus the model) and USD 986.6m revenue (+7.6%). The deviation of reported EBITDA from the model in the four prior periods was +68.8%, +15.9%, –181.4%, +12.9% – the model benchmark is unstable here.
Against the previous quarter the picture is the same: at the previous quarter's volumes and costs, our calculation implies EBITDA of USD 176.4m versus the reported USD 91.9m, USD 84.5m lower (–47.9%). Revenue came in USD 32.2m above the implied figure (+3.4%).
What the prices implied and what the company earned
| Base (Q2 2025) | Implied at period prices | Reported | Reported vs implied | |
|---|---|---|---|---|
| Revenue, USD mn | 674,7 | 782,8 | 986,6 | +26,0% |
| EBITDA, USD mn | 161,4 | 269,6 | 91,9 | -65,9% |
| EBITDA, portal spot model, USD mn | — | 118,5 | 91,9 | -22,5% |
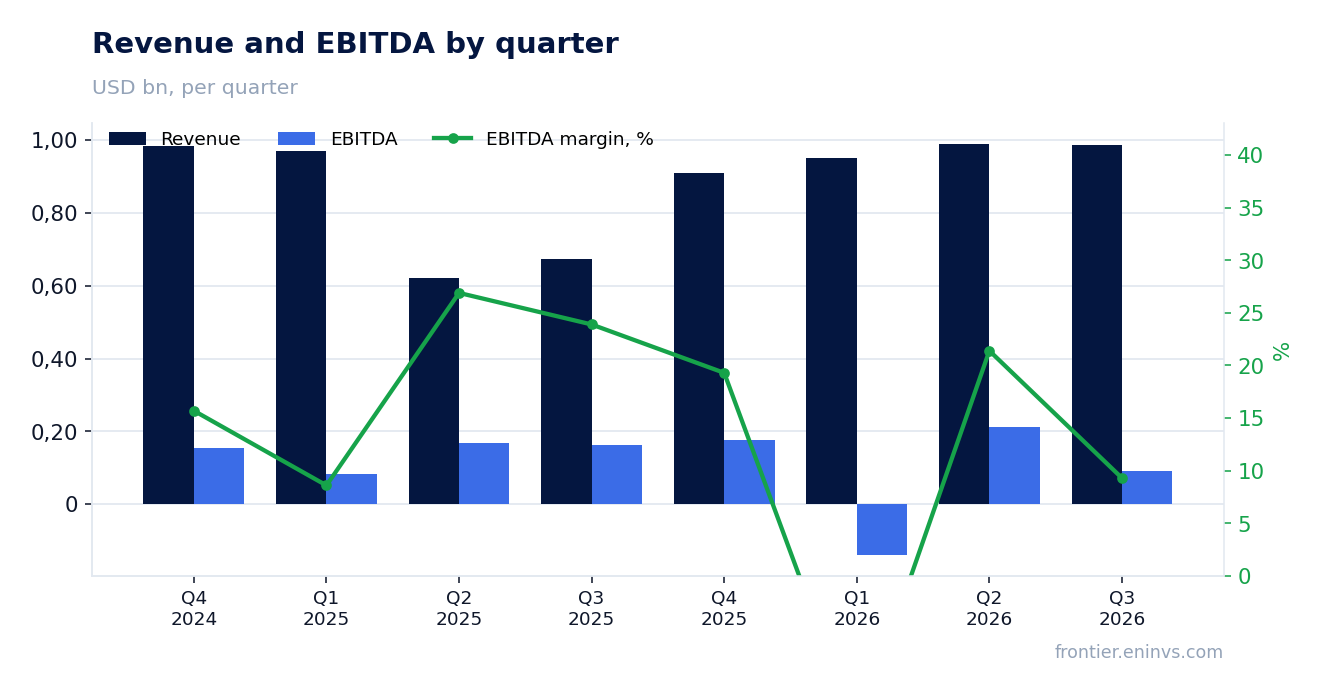
Revenue grew 46.2% year on year but the EBITDA margin compressed from 23.9% to 9.3%
Revenue for the reported quarter was USD 986.6m, 46.2% above a year earlier. Growth decelerated versus the previous quarter: +46.2% against +59.1% in the first quarter of 2026.
EBITDA was USD 91.9m versus USD 161.4m a year earlier (–43.1%). The EBITDA margin was 9.3% against 23.9% a year earlier: revenue rose while pre-depreciation profit fell, meaning each unit of sales delivered markedly less profit.
Operating profit was USD 23.9m versus USD 94.3m a year earlier. EBITDA in the facts is defined as operating profit of USD 23.9m plus USD 68m of depreciation; items below operating income are outside it and explain only the net result.
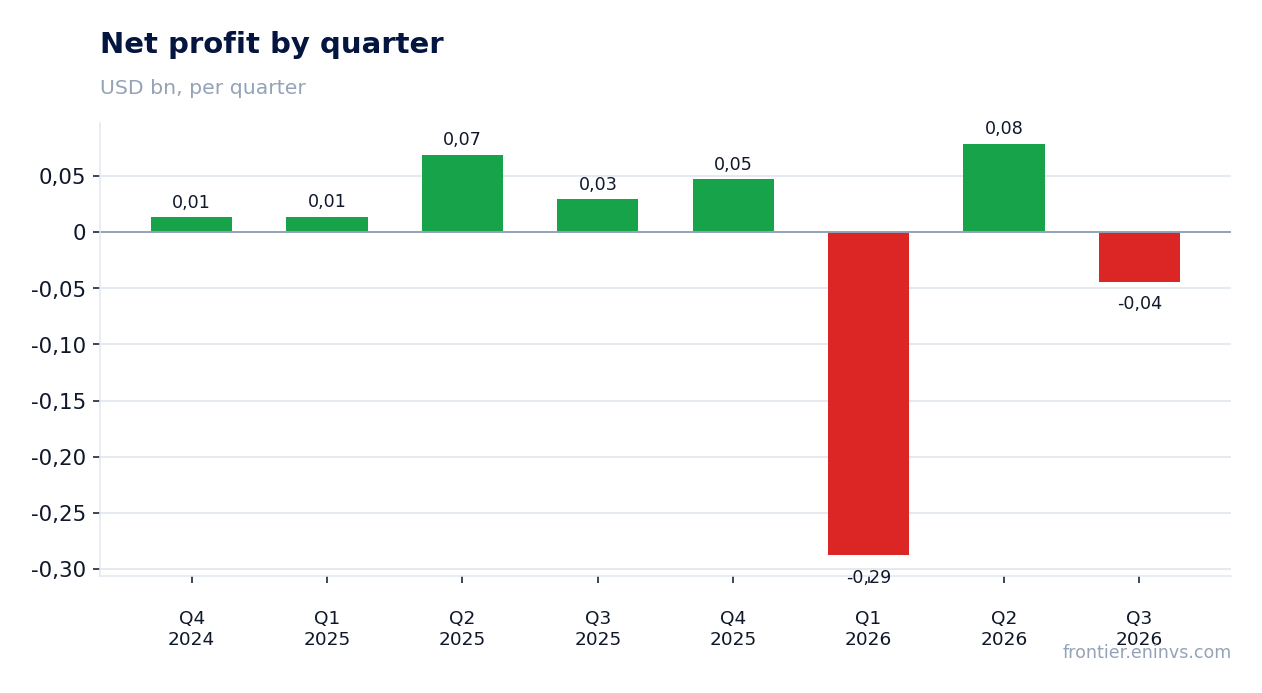
The net loss was USD 44.3m versus a profit of USD 29.3m a year earlier (–251.1%), the net margin – minus 4.5% against plus 4.3%. With operating profit positive, the loss was formed by items below operating income, including USD 68m of depreciation.
A net loss of USD 44.3m against operating profit of USD 23.9m – items below operating income, including USD 68.2m of depreciation, turned the result negative
Operating profit for the quarter was USD 23.9m and EBITDA USD 91.9m. The difference between them is USD 68m of depreciation, which is included in EBITDA but already deducted from operating profit.
The net loss of USD 44.3m means items below operating income exceeded operating profit. The facts name other income, interest and FX; which of them produced the negative is not disclosed.
For EBITDA this does not matter: items below operating income are outside it. But for a shareholder the net result is what counts – it is negative, and that separates the report from the picture of 'revenue rose, the business earns'.
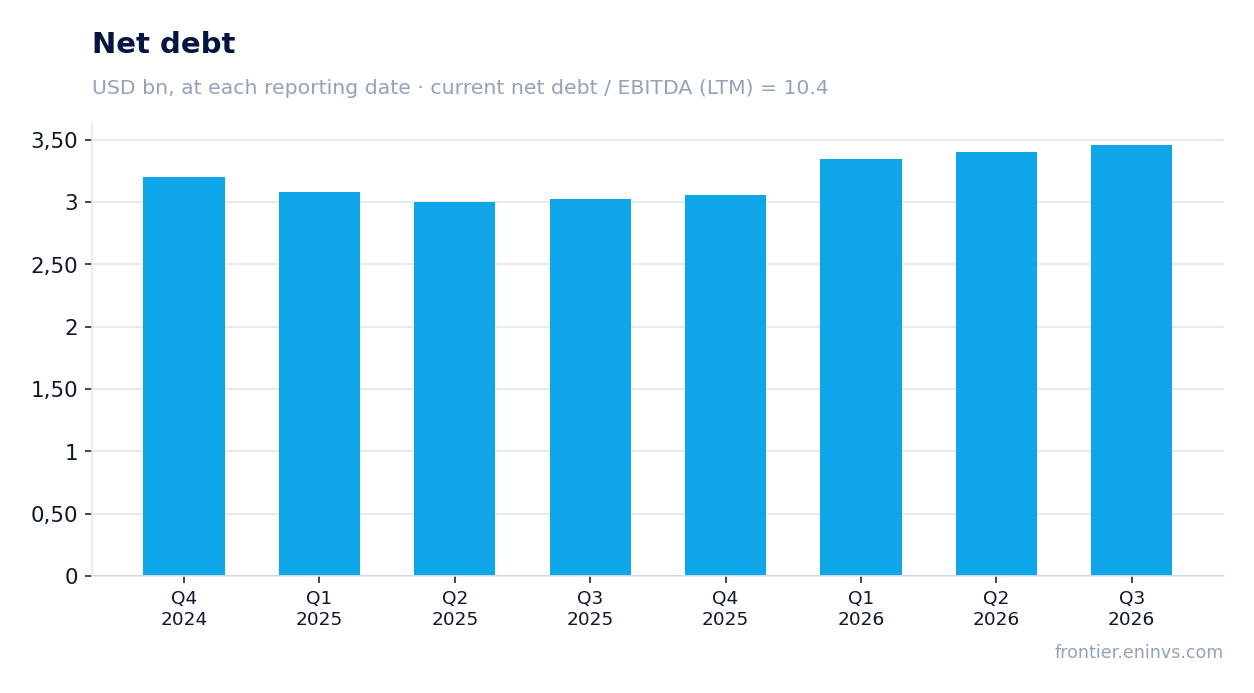
Net debt rose from USD 3.0bn on 30 September 2025 to USD 3.5bn on 30 September 2026
Net debt on 30 September 2026 was USD 3.46bn. A year earlier, on 30 September 2025, it stood at USD 3.0bn – up USD 0.4bn over the year. Over the quarter debt added USD 0.1bn, from USD 3.4bn on 30 June 2026.
The ratio of net debt to trailing-twelve-month EBITDA is 10.4. That is a level without comparison to a prior period: no earlier value is given in the facts.
Operating cash flow for the quarter was USD 94.6m and capital expenditure USD 118.0m. Capex exceeded operating cash flow, so free cash flow for the quarter was negative, which is consistent with the USD 0.1bn rise in debt over the quarter.
Over the trailing twelve months operating cash flow was USD 430.7m. With EBITDA of USD 332.8m on the same basis and capex that in the reported quarter exceeded cash flow, leverage remains the key constraint for a shareholder.
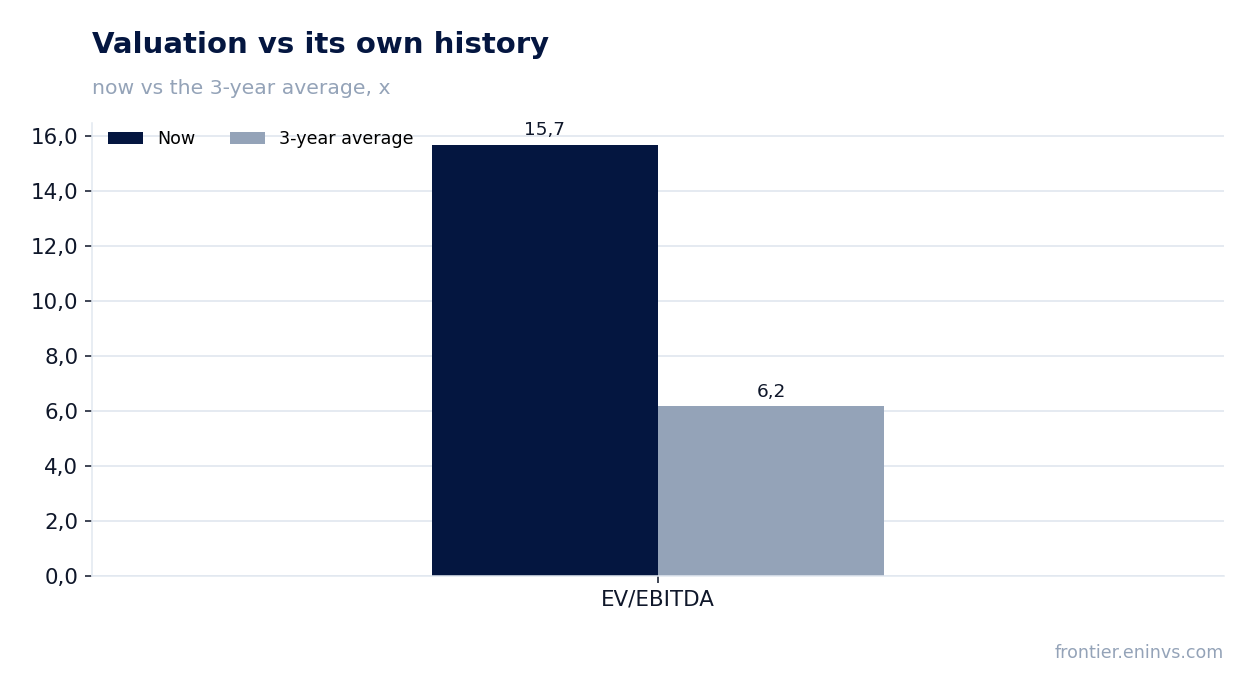
EV/EBITDA of 15.7 against its own three-year average of 6.2 – the share is 154% more expensive than its history
Trailing-twelve-month EV/EBITDA is 15.7 against its own three-year average of 6.2. The share trades 154% above its history on this multiple.
The reason is in the denominator: trailing-twelve-month EBITDA is USD 332.8m and was earned at past prices. Market capitalisation is USD 1.84bn and net debt USD 3.46bn, which produces the multiple.
At current prices the portal spot model implies annual EBITDA of USD 422m against the model's trailing-twelve-month USD 338.8m (+24.6%). On that base EV/EBITDA is 12.6 and net debt to EBITDA 8.2. Even adjusted for current prices the multiple remains high against the three-year average.
At current prices the portal spot model implies EBITDA of USD 422m and EV/EBITDA of 12.6
Spot on 6 November: Brent at USD 100 – 9.5% above the reported-period average, Henry Hub at USD 2.99 – 3.4% above. At these prices the portal spot model implies annual EBITDA of USD 422m.
That is 24.6% above the model's trailing-twelve-month EBITDA of USD 338.8m. EV/EBITDA at current prices is 12.6 and net debt to EBITDA 8.2.
For valuing the share this is a more appropriate base than the multiple on past prices: the last twelve months were earned under a different market. But 12.6 against the three-year average of 6.2 still leaves the share expensive.
What would change the picture is the oil price. Brent drives most of revenue, and its move from USD 91.3 to USD 100 is already in the calculation; the next report will test whether that price holds.
Valuation on the latest reported figures
| Metric | Value |
|---|---|
| Market cap | 1.84 bn USD |
| EV/EBITDA (LTM) | 15.7 |
| Net debt / EBITDA (LTM) | 10.40 |
| Operating cash flow (LTM) | 0.43 bn |
| ROE | 66.3% |
| EV/EBITDA, 3-year average | 6.2 |
Bottom line
The strong side of the report remains revenue: USD 986.6m, +46.2% year on year, with growth decelerating only from +59.1% to +46.2% versus the previous quarter. But prices implied EBITDA of USD 269.6m and the company reported USD 91.9m – the USD 177.7m gap is not closed by anything disclosed. A net loss of USD 44.3m against positive operating profit of USD 23.9m and net debt rising to USD 3.5bn from USD 3.0bn a year earlier make the picture weak for a shareholder. With EV/EBITDA at 15.7 against its own three-year average of 6.2, the share is expensive even adjusted for current prices (12.6), hence the verdict – unattractive.
Open the company's financial profile NGL →
See also: market overview · valuation map · stock screeners