National Oilwell Varco: revenue grows for the first time in a year, but profit leans on one-offs and tariff refunds
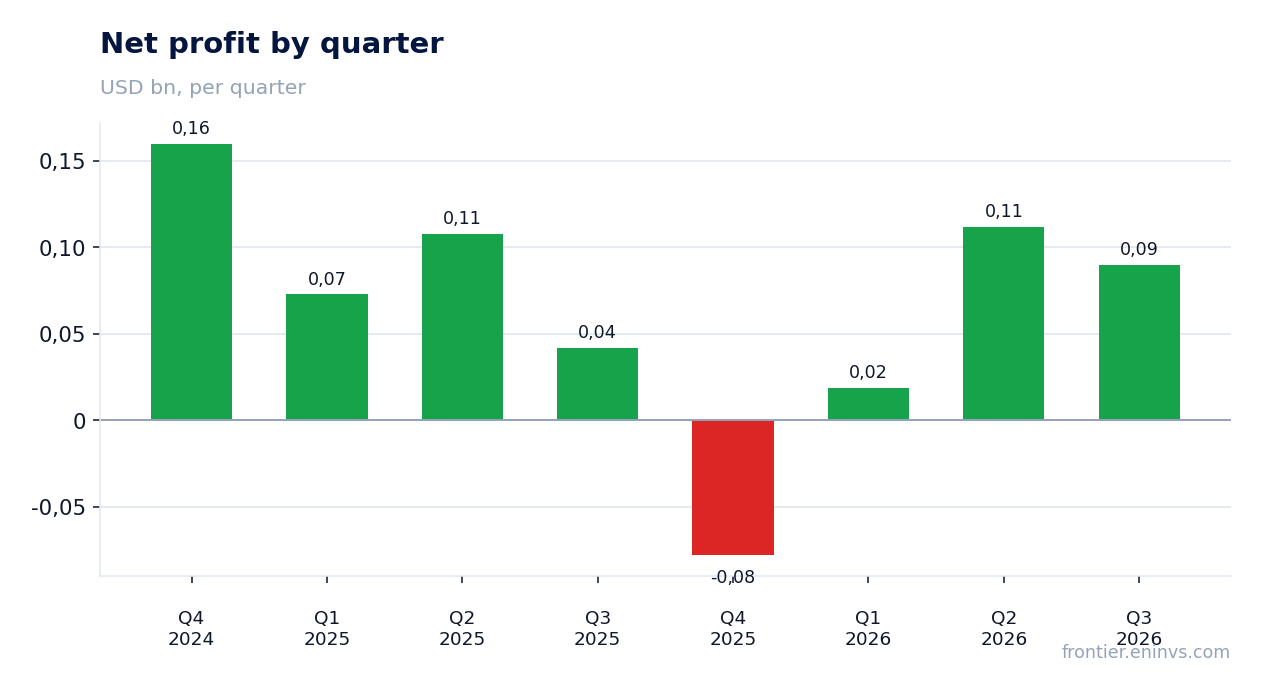
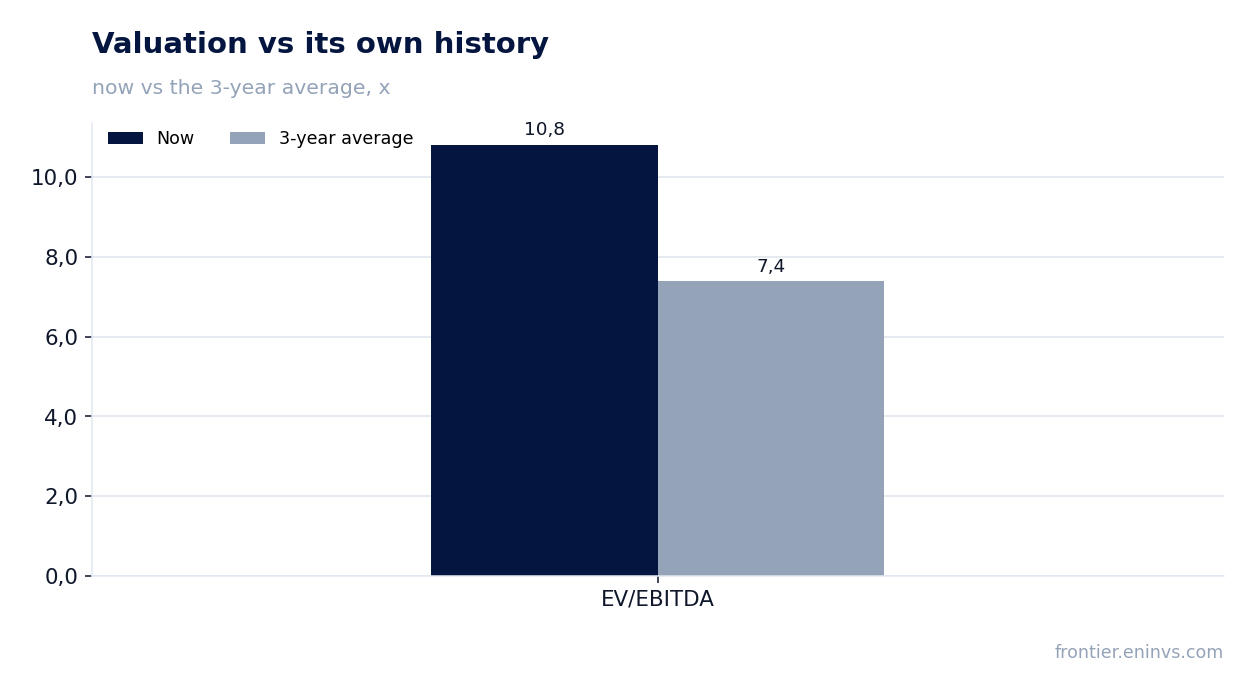
On 28 October National Oilwell Varco reported third-quarter 2026 results: revenue of $2,226 million rose 2.3% year over year after a 2.5% decline the quarter before, company-adjusted EBITDA reached $281 million, and net income came in at $90 million versus $42 million a year earlier. Reported EBITDA on our data is $235 million, and it carries one-offs: a $5 million tariff refund, $18 million of fixed-asset write-downs and $28 million of other items. The stock fell 6.2% after the release and trades at 10.8x EV/EBITDA against its own three-year average of 7.4 – at that multiple, with profit this one-off-heavy, the share looks rather unattractive.
Key takeaways
— Revenue grew for the first time in a year, up 2.3%, carried by the energy products and services segment
— The company's adjusted EBITDA of $281 million is $46 million above our reported figure, and the gap is one-offs
— Reported EBITDA margin rose to 10.6% from 9.0%, but part of the lift came from tariff refunds
— Free cash flow for the quarter was negative – minus $47 million on $88 million of capex
— Net debt of $0.6 billion is 0.91x trailing-twelve-month EBITDA, and it fell $0.5 billion over the year
— Capital equipment backlog of $3.98 billion with a 91% book-to-bill – orders came in below shipments
— The 10.8x EV/EBITDA multiple is 46% above its own three-year average of 7.4
Attractiveness
Key figures, USD bn
| Metric | Q3 2025 | Q3 2026 | Change |
|---|---|---|---|
| Revenue | 2.18 | 2.23 | +2.3% |
| EBITDA | 0.20 | 0.23 | +19.9% |
| Operating profit | 0.11 | 0.14 | +32.7% |
| Net profit | 0.04 | 0.09 | +114.3% |
| Operating cash flow | 0.35 | 0.04 | -88.4% |
| Capex | 0.11 | 0.09 | -17.8% |
| EBITDA margin | 9.0% | 10.6% | +1.6 pp |
| Net margin | 1.9% | 4.0% | +2.1 pp |
Revenue grew for the first time in a year, up 2.3%, carried by the energy products and services segment
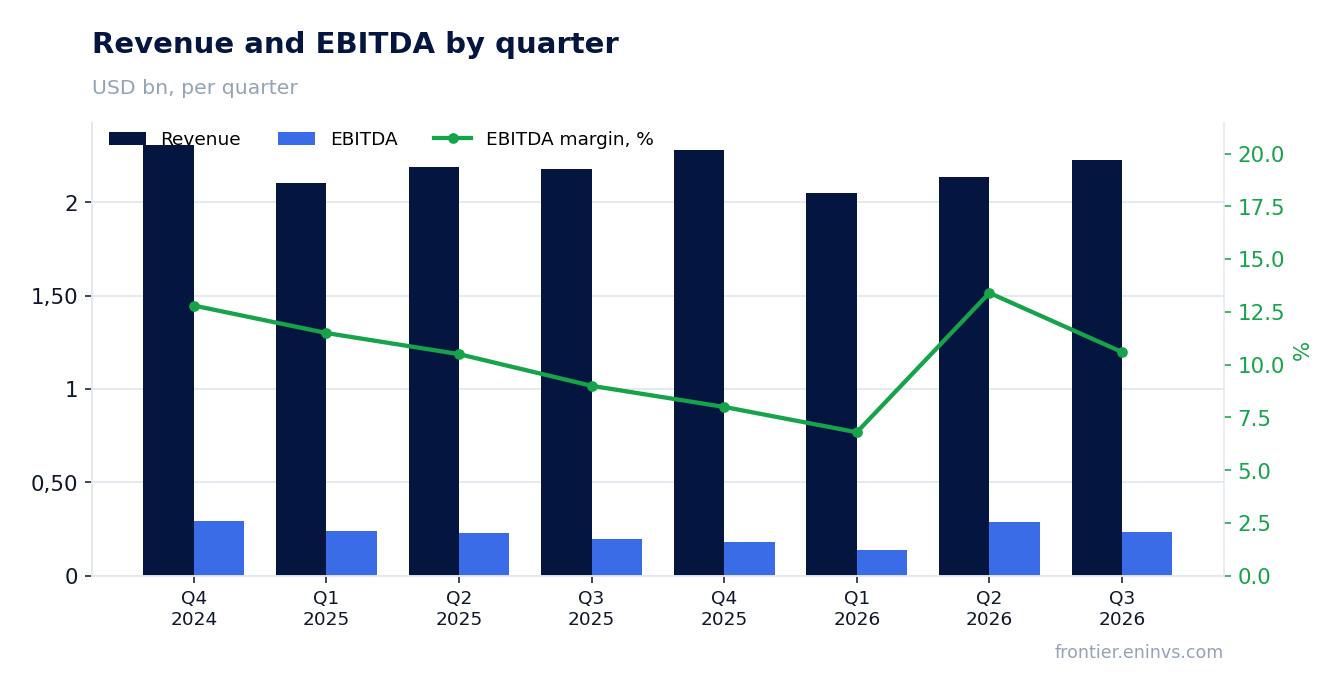
Third-quarter 2026 revenue was $2,226 million, up 2.3% from $2,176 million a year earlier. The top line had fallen for four straight quarters: down 1.3% in Q2 2025, down 0.7% in Q3, down 1.3% in Q4, down 2.4% and 2.5% in the first two quarters of 2026. So the current 2.3% is a reversal after a year of decline, not a continuation of growth.
All of the increase came from the energy products and services segment: its revenue rose 9% year over year to $1,057 million on higher manufacturing throughput against a growing backlog of drill pipe and composite equipment. Energy equipment, by contrast, fell 2% to $1,220 million as certain offshore projects wrapped up. Inter-segment eliminations rose from $42 million to $51 million and partly offset the gain.
Sequential momentum is also positive: revenue rose 4% from the prior quarter. But the year-over-year rate remains modest at 2.3% after a decline the quarter before. Whether the reversal holds depends on manufacturing throughput in the products and services segment.
The company's adjusted EBITDA of $281 million is $46 million above our reported figure, and the gap is one-offs
The company reports adjusted EBITDA of $281 million, or 12.6% of sales, versus $258 million a year earlier. Our reported EBITDA for the same quarter is $235 million. The $46 million gap is the items the company excludes: $28 million of other items (mainly severance and inventory write-downs), $18 million of net fixed-asset write-downs from facility closures, and a $5 million tariff refund.
Some of these are real cash, not accounting adjustments. Fixed-asset and inventory write-downs reflect facility closures, meaning the company is shrinking its asset base. The $5 million tariff refund is a one-time gain that may not repeat next quarter; a quarter earlier such refunds were $40 million, so the stream is fading.
For judging earnings quality, reported EBITDA of $235 million matters more than the adjusted figure. The $46 million gap is 20% of the reported number and will not recur at the same size.
Reported EBITDA margin rose to 10.6% from 9.0%, but part of the lift came from tariff refunds
Reported EBITDA margin in Q3 2026 was 10.6% versus 9.0% a year earlier; net margin was 4.0% versus 1.9%. Operating profit rose 33% year over year to $142 million, or 6.4% of sales. Gross margin rose to 19.7% from 18.9%.
Part of the margin lift is operational: in energy equipment, adjusted EBITDA margin widened to 15.3% from 14.4% on a favourable project mix and better backlog margins; in products and services it rose to 14.5% from 13.9% on a lower cost base. But the reported margin also carries the $5 million tariff refund and the one-off items the company excludes.
The company's adjusted EBITDA margin is 12.6% versus 11.9% a year earlier. The gap between 12.6% and our 10.6% is those same one-offs. Whether margin holds above 10% depends on manufacturing throughput and on whether tariff refunds disappear entirely.
Free cash flow for the quarter was negative – minus $47 million on $88 million of capex
Operating cash flow in Q3 2026 was $41 million; capex was $88 million. Free cash flow, by the company's own calculation, was negative: minus $47 million. Over nine months, operating cash flow was $32 million, capex $234 million, free cash flow minus $202 million.
The cause is working capital: it absorbed $251 million in the quarter and $646 million over nine months. The company is building inventories ($1,956 million versus $1,799 million at end-2025) and contract assets ($736 million versus $596 million), so ramping production against the backlog requires cash up front.
For shareholders this means profit is not yet converting into free cash: the $47 million of dividends and buybacks in the quarter is funded from the cash balance, not from cash flow. Cash has fallen from $1,552 million to $1,058 million since the start of the year.
Net debt of $0.6 billion is 0.91x trailing-twelve-month EBITDA, and it fell $0.5 billion over the year
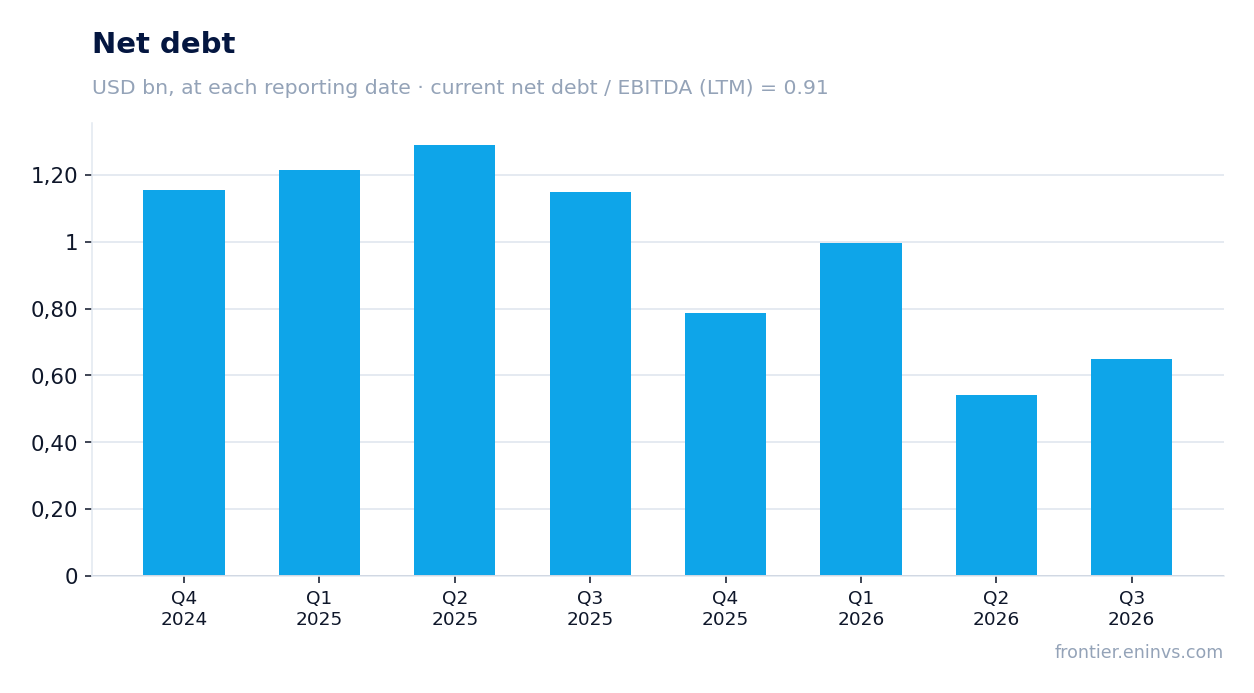
Net debt at 30 September 2026 was $649 million, or 0.91x trailing-twelve-month EBITDA. At the prior reporting date, 30 June 2026, it was $0.5 billion, so it rose $0.1 billion. A year earlier, 30 September 2025, net debt was $1.1 billion – down $0.5 billion over 12 months.
Total debt is $1,710 million, of which $1,694 million is long-term; cash is $1,058 million. $1,500 million is available on the revolver, so liquidity is adequate. Interest expense was $21 million in the quarter and $64 million over nine months.
At 0.91x EBITDA, leverage is low for the sector and poses no threat to the dividend. But the $0.1 billion rise in net debt over the quarter, alongside negative free cash flow, shows the company is partly funding working capital and payouts from the balance sheet.
Capital equipment backlog of $3.98 billion with a 91% book-to-bill – orders came in below shipments
New orders in Q3 2026 totalled $577 million, or 91% of the $632 million shipped from backlog. Capital equipment backlog at 30 September was $3.98 billion. So the backlog shrank over the quarter: shipments exceeded bookings.
The company attributes this to completed offshore projects and expects a moderation in Middle East activity in Q4 as some customers adjust drilling programmes. That is a direct risk to manufacturing throughput in the products and services segment, which drove the quarter's revenue.
Q4 guidance: revenue roughly flat year over year, adjusted EBITDA between $260 million and $300 million. Against $281 million in Q3, the company is assuming the level holds rather than grows.
The 10.8x EV/EBITDA multiple is 46% above its own three-year average of 7.4
On trailing-twelve-month EV/EBITDA the stock trades at 10.8x against its own three-year average of 7.4. That is 46% above history – the share is more expensive than usual on this multiple. Trailing P/E is 56.1, reflecting a low profit base: $124 million over 12 months against a $6,953 million market cap.
Trailing dividend yield is 2.26%. In the quarter the company paid $32 million of dividends and bought back $15 million of stock, returning $47 million to shareholders. With free cash flow at minus $47 million for the quarter, the payouts are funded from cash.
With the multiple above its own history and profit 20% one-off, valuation looks stretched. To justify it, the company needs to sustain revenue growth and turn free cash flow positive – neither is yet confirmed.
Valuation on the latest reported figures
| Metric | Value |
|---|---|
| Market cap | 6.95 bn USD |
| P/E (LTM) | 56.1 |
| EV/EBITDA (LTM) | 10.8 |
| P/B | 1.11 |
| Net debt / EBITDA (LTM) | 0.91 |
| ROE | 5.8% |
| Dividend yield (12m) | 2.3% |
| EV/EBITDA, 3-year average | 7.4 |
Bottom line
What was genuinely strong: revenue grew for the first time in a year, up 2.3%, an acceleration after a 2.5% decline the quarter before, and reported EBITDA margin rose to 10.6% from 9.0%. But profit is 20% one-off, free cash flow is negative, and orders came in below shipments. At 10.8x EV/EBITDA against its own three-year average of 7.4, the share is priced above its history, and a 2.26% dividend yield does not compensate. Verdict: rather unattractive – the revenue reversal is real but not yet converting into cash, and valuation already discounts more than the company delivered.
Open the company's financial profile NOV →
See also: market overview · valuation map · stock screeners