Nutrien: Q2 2026 revenue up 3.6%, but EBITDA and profit down 0.6%

On August 25, Nutrien released its results for the second quarter of 2026. Revenue grew 3.6% year-on-year to $10,812 million, EBITDA fell 0.6% to $2,593 million, and net profit also declined 0.6% to $1,214 million. At the current price, the shares look rather unattractive: the EV/EBITDA multiple of 7.6x is only slightly above its own three-year average, and the portal's model implies a 35% downside.
Key takeaways
— Q2 2026 revenue grew 3.6% to $10,812 million, but EBITDA and net profit both fell 0.6%
— EBITDA margin narrowed from 23.0% to 22.0%, and net margin from 11.7% to 11.2%
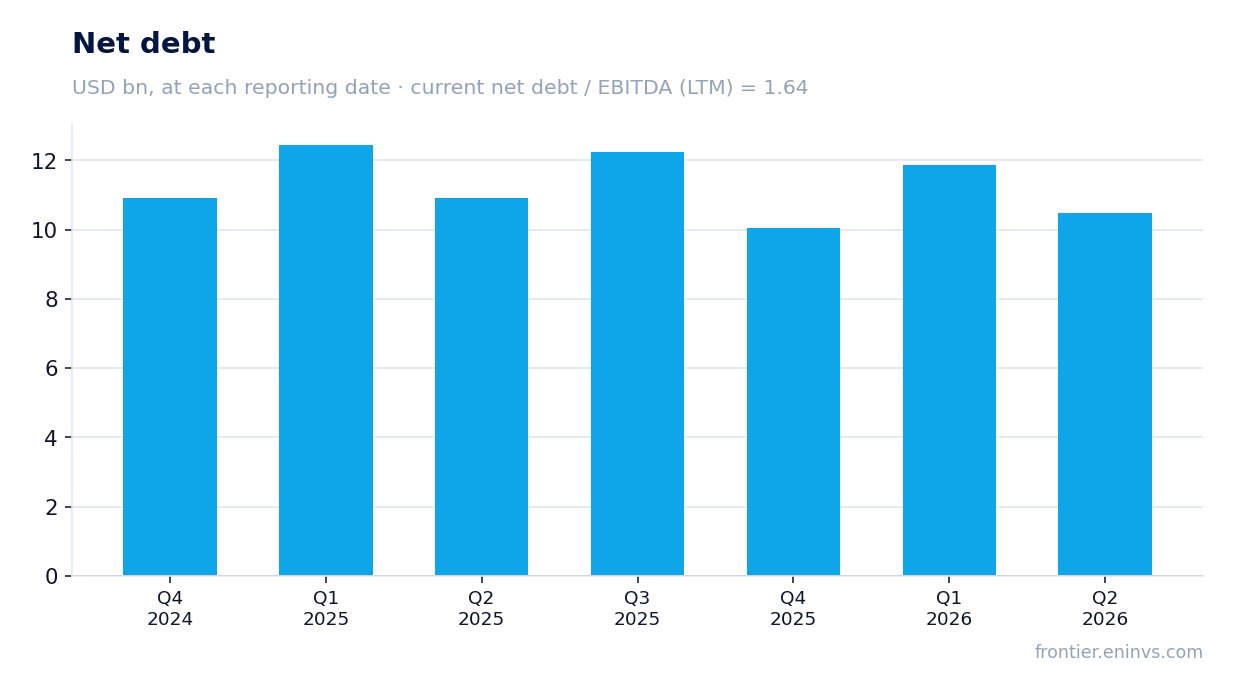
— Leverage stands at 1.64x EBITDA for the last twelve months, with net debt down $1.4 billion over the quarter
— Trailing twelve-month dividend yield is 1.36%, below historical levels
— EV/EBITDA multiple of 7.6x is only slightly above its own three-year average
— The portal's model implies a 35% downside for the shares
Attractiveness
Key figures, USD bn
| Metric | Q2 2025 | Q2 2026 | Change |
|---|---|---|---|
| Revenue | 10.4 | 10.8 | +3.6% |
| EBITDA | 2.40 | 2.38 | -0.6% |
| Operating profit | 1.93 | 1.99 | +3.2% |
| Net profit | 1.22 | 1.21 | -0.6% |
| Operating cash flow | 2.54 | 2.48 | -2.1% |
| Capex | 0.42 | 0.49 | +15.8% |
| EBITDA margin | 23.0% | 22.0% | -1.0 pp |
| Net margin | 11.7% | 11.2% | -0.5 pp |
Q2 2026 revenue grew 3.6% to $10,812 million, but EBITDA and net profit both fell 0.6%
In Q2 2026, Nutrien's revenue reached $10,812 million, up 3.6% year-on-year. Growth slowed from Q1 2026, when revenue rose 18.5% year-on-year, but remained positive.
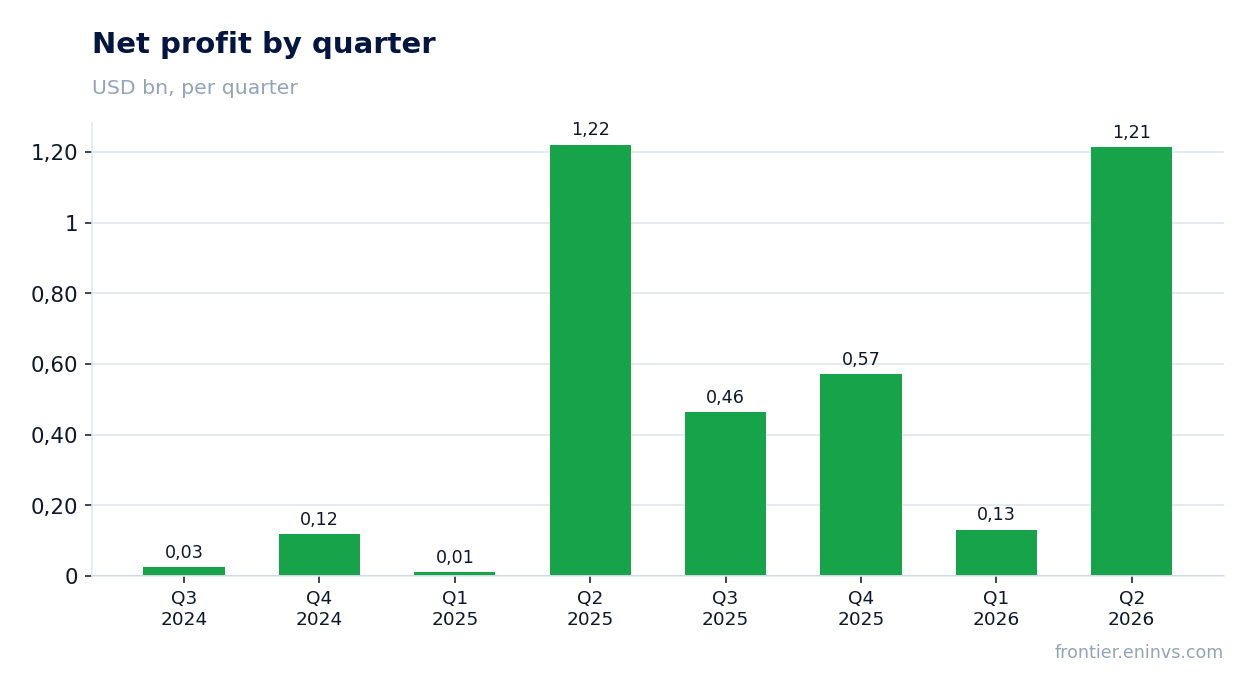
Quarterly EBITDA fell 0.6% to $2,593 million, and net profit also declined 0.6% to $1,214 million. Thus, revenue growth did not translate into profit: operating costs likely grew faster than revenue.
For the trailing twelve months (LTM), revenue was $28,200 million, EBITDA $6,582.4 million, and net profit $2,380 million. These figures reflect the aggregate of the four quarters ended June 30, 2026.
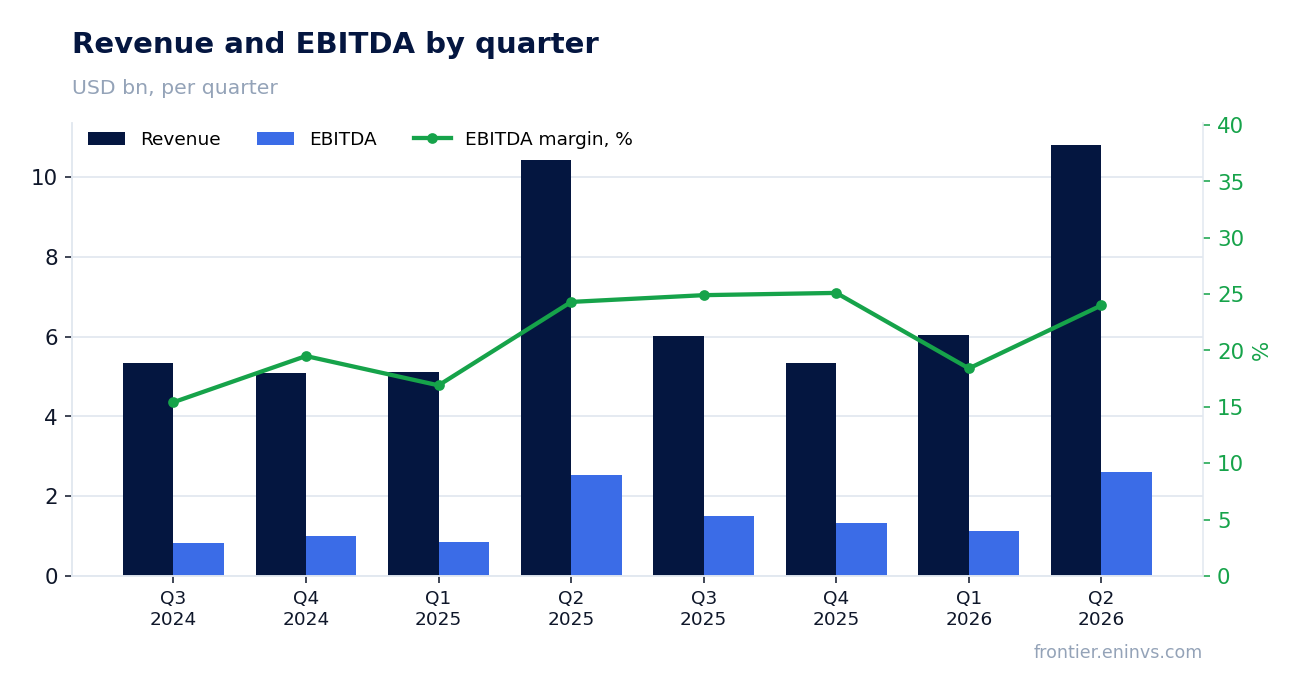
EBITDA margin narrowed from 23.0% to 22.0%, and net margin from 11.7% to 11.2%
In Q2 2026, EBITDA margin was 22.0%, versus 23.0% a year earlier. Net margin fell from 11.7% to 11.2%. The pressure on profitability stems from costs growing faster than revenue.
The decline in margins is a key signal for investors: even with rising revenue, the company earns less on each dollar of sales. This could be related to fertilizer prices or sales mix, but the exact reason is not disclosed in the report.
For the trailing twelve months, EBITDA margin was 23.3% (6,582.4 / 28,200), higher than the quarterly figure, but reflecting a different period.
Leverage stands at 1.64x EBITDA for the last twelve months, with net debt down $1.4 billion over the quarter
At the end of Q2 2026, Nutrien's net debt stood at $10,805 million, down $1.4 billion from the previous reporting date. Over the last twelve months, net debt decreased by $0.4 billion.
The ratio of net debt to EBITDA for the last twelve months is 1.64. This is a moderate level that does not constrain the company's ability to pay dividends or invest.
Operating cash flow in Q2 2026 was $2,484 million, which funded capital expenditures of $491 million and reduced debt.
Trailing twelve-month dividend yield is 1.36%, below historical levels
Over the last twelve months, Nutrien paid dividends amounting to 1.36% of the current share price. This is lower than the historical yield investors could have received on the stock.
At the current price and this dividend level, the share does not look attractive for income-oriented investors. However, the company retains the ability to increase payouts if profit grows.
The dividend for 2026 will depend on net profit and payout policy. We estimate it as moderate, given that profit for the last twelve months was $2,380 million.
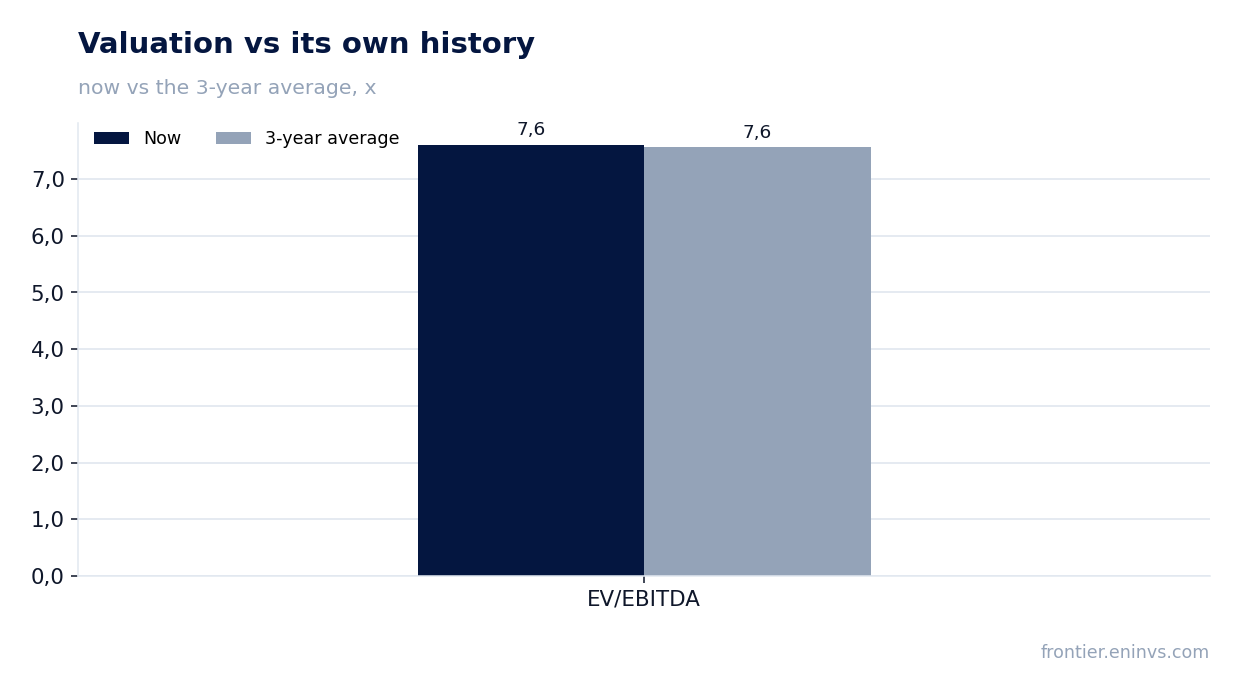
EV/EBITDA multiple of 7.6x is only slightly above its own three-year average
The current EV/EBITDA multiple is 7.6x, only slightly above the three-year average of 7.56x. Thus, the share trades near its historical valuation.
P/E for the last twelve months is 16.5x, reflecting a moderate valuation of earnings. ROE is 19.0%, indicating decent capital efficiency.
Comparison with its own history shows that the market is not pricing in either significant improvement or deterioration in the company's financials.
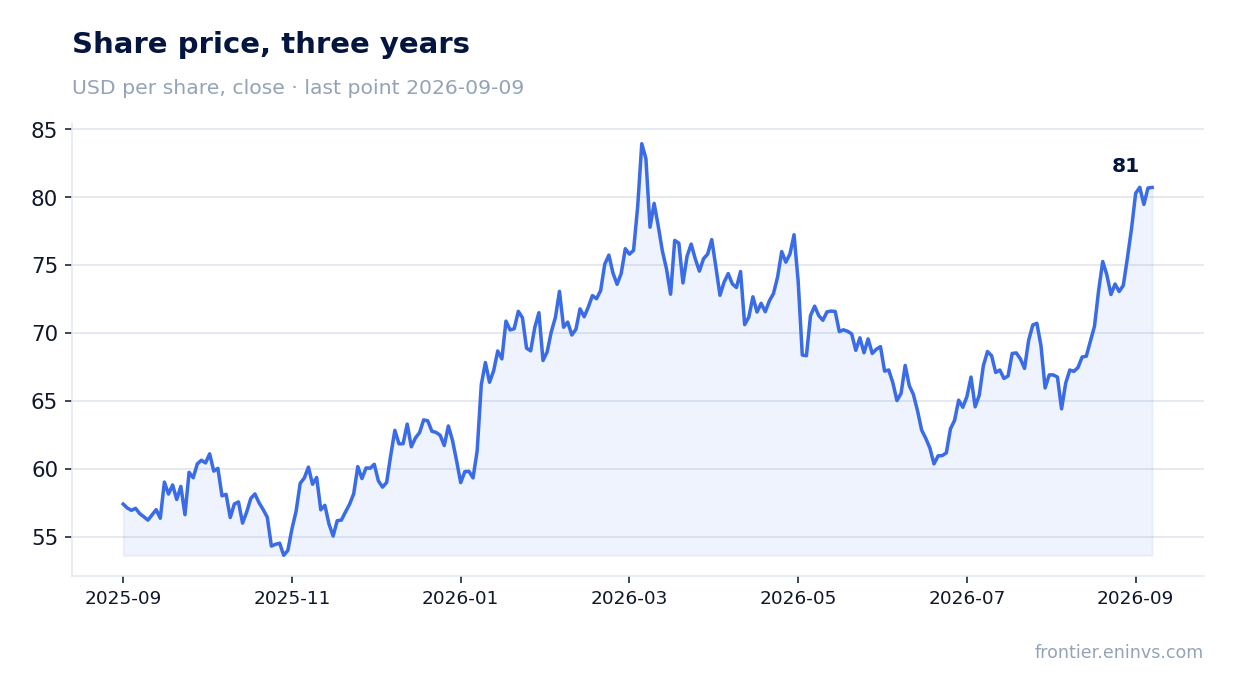
The portal's model implies a 35% downside for the shares
According to the portal's model, the fair value of the share at current commodity prices and target EV/EBITDA is 35% below the current market capitalization. This means the market values the company higher than our model suggests.
The portal's model recalculates EBITDA at current fertilizer and other commodity prices. If commodity prices remain at current levels, the downside potential for the share persists.
Investors should consider this signal when making decisions, although model estimates do not guarantee price movements.
Valuation on the latest reported figures
| Metric | Value |
|---|---|
| Market cap | 39.3 bn USD |
| P/E (LTM) | 16.5 |
| EV/EBITDA (LTM) | 7.6 |
| P/B | 1.55 |
| Net debt / EBITDA (LTM) | 1.64 |
| Operating cash flow (LTM) | 4.00 bn |
| ROE | 19.0% |
| Dividend yield (12m) | 1.4% |
| EV/EBITDA, 3-year average | 7.6 |
Bottom line
In Q2 2026, Nutrien showed modest revenue growth but failed to sustain margins: EBITDA and net profit both fell 0.6%. Debt reduction and moderate leverage are positive, but a dividend yield of 1.36% is unlikely to attract investors. At the current price, the share trades near its own three-year average EV/EBITDA, while the portal's model implies a 35% downside. Verdict: rather unattractive.
Open the company's financial profile NTR →
See also: market overview · valuation map · stock screeners