Nucor Corporation: profit doubled, yet the market prices it above its own history
On 26 October Nucor Corporation reported results for the fourth quarter of 2026. Revenue came in at 11,249.0 million dollars (+32.0% year on year), EBITDA at 2,279.0 million dollars (+82.3%), and net profit at 1,319.0 million dollars (+117.3%). The EBITDA margin rose to 20.3% from 14.7% a year earlier, and the net margin to 11.7% from 7.1%. The share looks neutral: profit growth is strong, but the EV/EBITDA multiple of 9.4 is above its own three-year average of 8.5, and the portal's model implies a downside of 86%.
Key takeaways
— Revenue grew 32.0% year on year, an acceleration from 23.0% a quarter earlier
— EBITDA rose 82.3%, with the margin up to 20.3% from 14.7%
— Net profit grew 117.3%, yet the 11.7% net margin remains modest for such a jump
— Leverage of 0.73 EBITDA LTM is low, but the facts do not disclose the debt dynamics
— A dividend yield of 0.87% does not offset re-rating risk
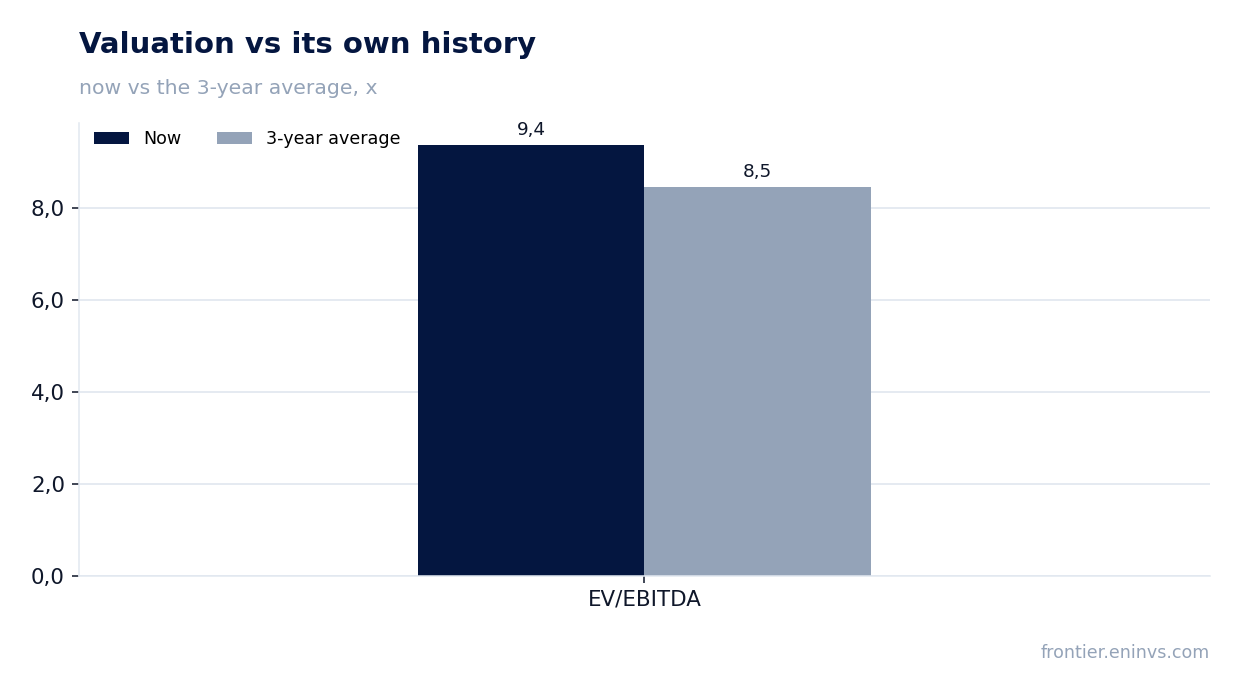
— EV/EBITDA of 9.4 is 11% above its own three-year average of 8.5
— The portal's model implies a downside of 86% to the current price
Attractiveness
Key figures, USD bn
| Metric | Q4 2025 | Q4 2026 | Change |
|---|---|---|---|
| Revenue | 8.52 | 11.2 | +32.0% |
| EBITDA | 1.25 | 2.28 | +82.3% |
| Operating profit | 0.88 | — | — |
| Net profit | 0.61 | 1.32 | +117.3% |
| Operating cash flow | 1.34 | — | — |
| Capex | 0.81 | — | — |
| EBITDA margin | 14.7% | 20.3% | +5.6 pp |
| Net margin | 7.1% | 11.7% | +4.6 pp |
Revenue grew 32.0% year on year, an acceleration from 23.0% a quarter earlier
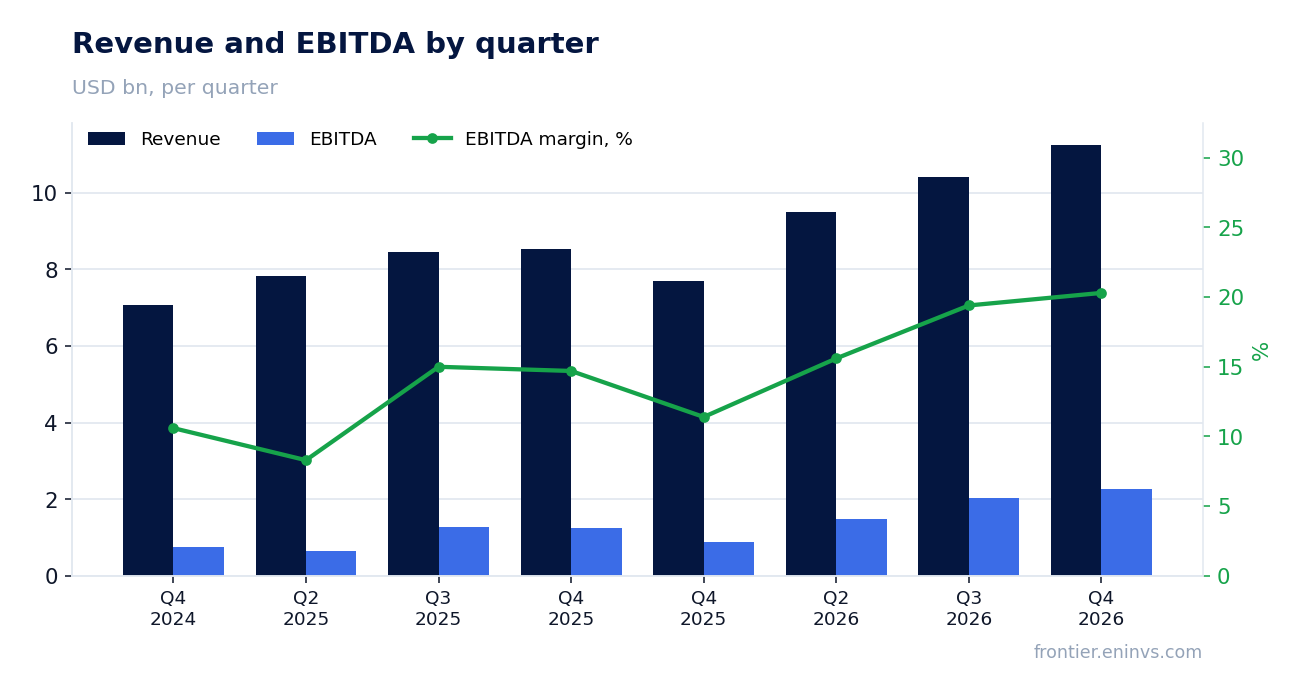
In the fourth quarter of 2026 Nucor Corporation's revenue reached 11,249.0 million dollars, 32.0% more than a year earlier. A quarter before, growth was 23.0%, so the pace accelerated. This is already the third consecutive quarter with growth above 20%: in the second quarter of 2026 revenue added 23.0%, in the third – 32.0%.
The acceleration coincided with EBITDA rising to 2,279.0 million dollars from 1,250.0 million dollars a year earlier. Profit grew faster than revenue, so it was not only volumes but also prices or the sales mix. The facts do not disclose what exactly produced this effect, so we limit ourselves to stating that revenue and EBITDA accelerated together.
EBITDA rose 82.3%, with the margin up to 20.3% from 14.7%
EBITDA for the fourth quarter of 2026 was 2,279.0 million dollars, 82.3% more than a year earlier. The EBITDA margin rose to 20.3% from 14.7%. Such a margin gain on 32.0% revenue growth means costs grew slower than sales.
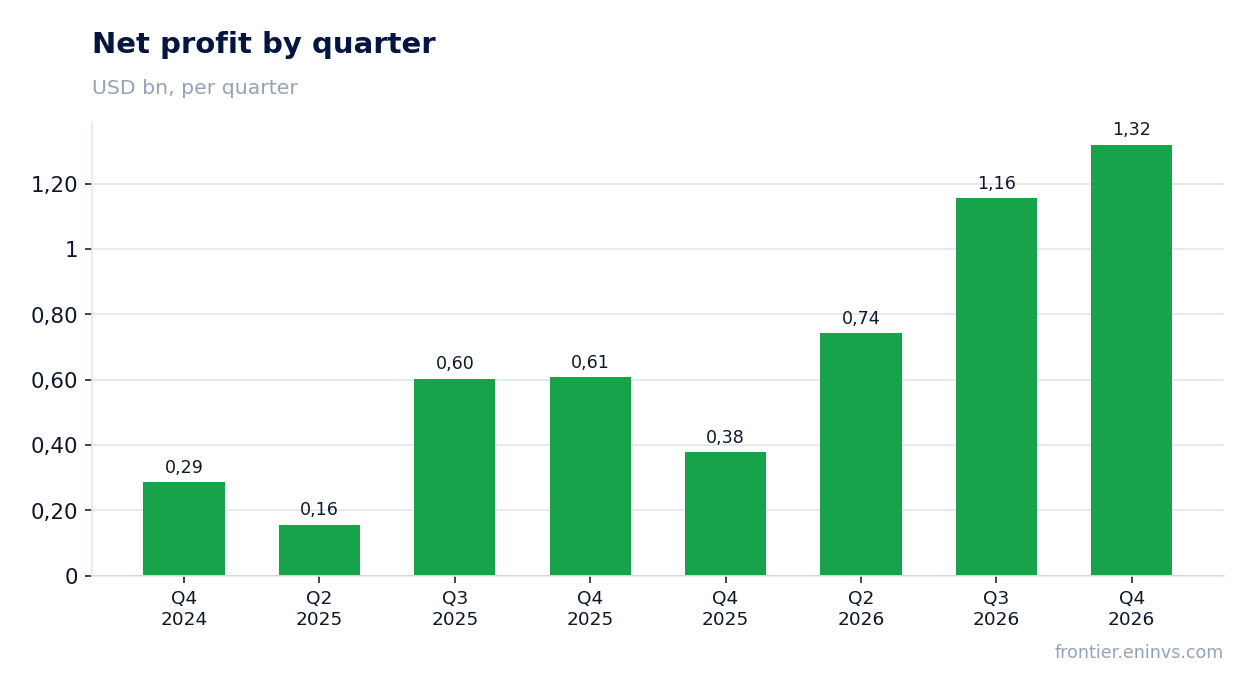
Net profit increased 117.3% to 1,319.0 million dollars, and the net margin rose to 11.7% from 7.1%. Profit grew faster than EBITDA, which may point to lower depreciation or interest costs relative to revenue. The facts provide no breakdown, so we do not name the cause.
Net profit grew 117.3%, yet the 11.7% net margin remains modest for such a jump
Net profit for the fourth quarter of 2026 was 1,319.0 million dollars versus 607.0 million dollars a year earlier. Growth of 117.3% is the strongest among the quarters of 2026. At the same time, a net margin of 11.7% means about 12 cents of profit per dollar of revenue.
For a steel company such a margin does not look anomalous, but it is below what one might expect with an EBITDA margin of 20.3%. The gap of 8.6 percentage points is depreciation, interest and taxes. The facts do not disclose their dynamics, so we limit ourselves to stating the level.
Leverage of 0.73 EBITDA LTM is low, but the facts do not disclose the debt dynamics
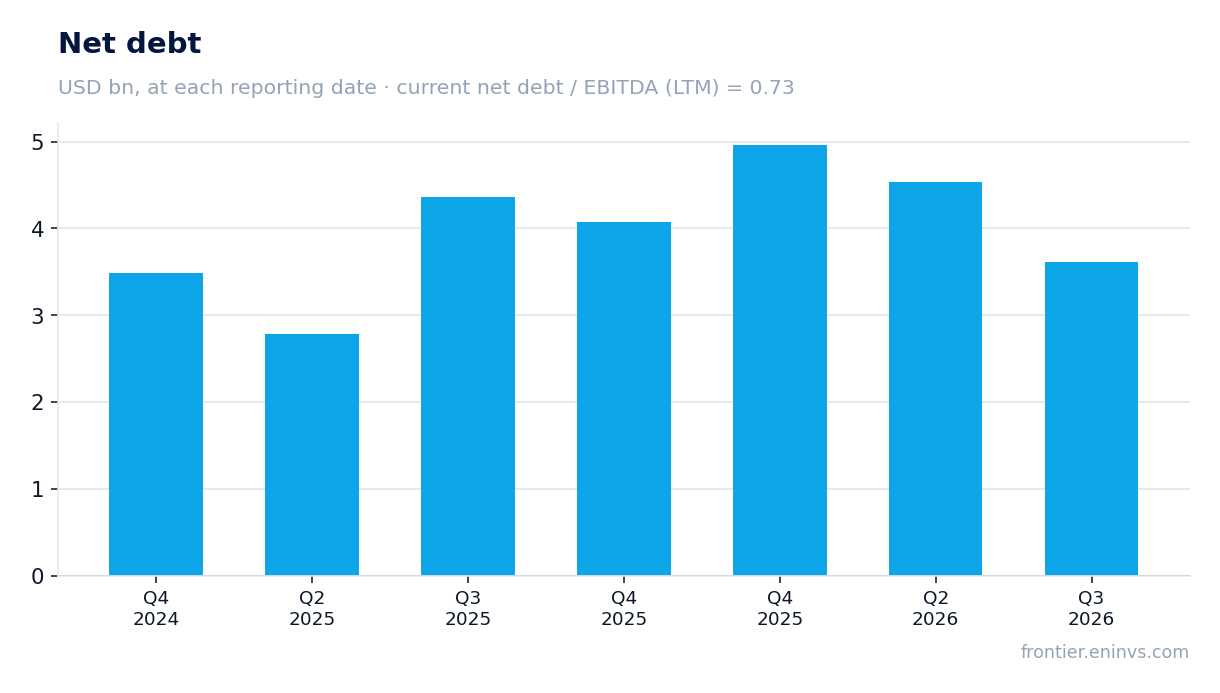
Net debt at the latest balance-sheet date was 4,965.0 million dollars, and the ratio of net debt to trailing-twelve-month EBITDA was 0.73. That is a low level: the company could cover its debt in less than a year of operating profit.
The facts do not contain a net debt figure for the fourth quarter of 2026, so the direction of change is not disclosed. We can only record the level of 0.73 and note that it poses no risk to dividends or capital expenditure.
A dividend yield of 0.87% does not offset re-rating risk
The trailing-twelve-month dividend yield is 0.87%. That is a low level and provides no meaningful support for the share price. With net profit of 3,596.0 million dollars over the last twelve months and a market capitalisation of 58,762.1 million dollars, payouts remain modest relative to profit.
The facts do not contain the dividend per share or the payout ratio, so the sustainability of payments cannot be assessed. A yield of 0.87% is lower than one might expect from a company with such low leverage, but without data on the payout policy we draw no conclusions about its change.
EV/EBITDA of 9.4 is 11% above its own three-year average of 8.5
The trailing-twelve-month EV/EBITDA multiple is 9.4, 11% above its own three-year average of 8.5. This means the market values the company more expensively than it did on average over the past three years. The trailing-twelve-month P/E is 16.3.
Profit growth of 117.3% in the fourth quarter of 2026 could have driven a re-rating, but the current multiple is already above its historical norm. The portal's model, which reprices EBITDA at current commodity prices at the target EV/EBITDA, implies a downside of 86% to the current price. This is our own estimate, not a market consensus.
The portal's model implies a downside of 86% to the current price
According to the portal's model, which reprices EBITDA at current commodity prices at the target EV/EBITDA, the fair value of the share is 86% below the current market price. This means the market is pricing in higher steel prices or a more sustainable margin than our model assumes.
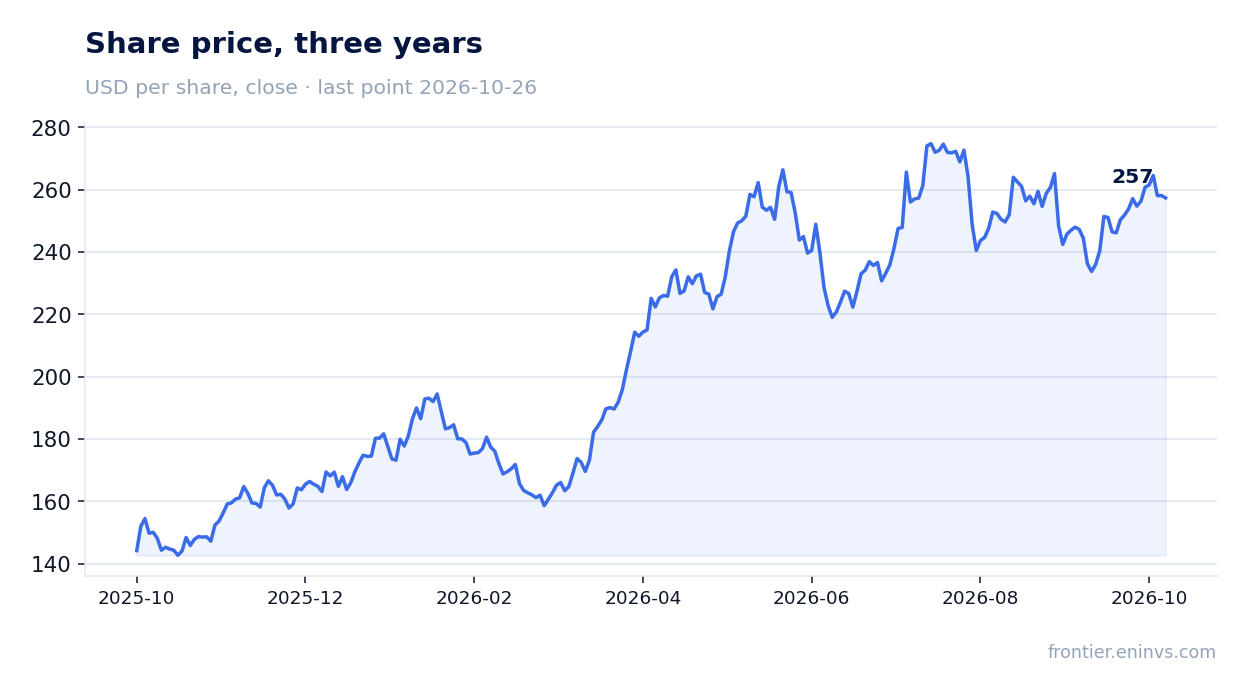
The share closed at 258.11 dollars before the release, lost 0.3% on the release day and lost 0.3% from the release to 26 October 2026. The market reaction is muted: a strong report did not lead to a rally, which may indicate the results were already priced in.
Valuation on the latest reported figures
| Metric | Value |
|---|---|
| Market cap | 58.8 bn USD |
| P/E (LTM) | 16.3 |
| EV/EBITDA (LTM) | 9.4 |
| P/B | 2.81 |
| Net debt / EBITDA (LTM) | 0.73 |
| ROE | 7.8% |
| Dividend yield (12m) | 0.9% |
| EV/EBITDA, 3-year average | 8.5 |
Bottom line
The strong side of the report is revenue acceleration to 32.0% and EBITDA growth of 82.3%, which expanded the margin to 20.3%. However, profit growth of 117.3% is largely a base effect: a year earlier net profit was only 607.0 million dollars. Leverage of 0.73 EBITDA LTM is low, but a dividend yield of 0.87% does not offset re-rating risk. The verdict is neutral: business growth is strong, but the current price already reflects much of it, and the portal's model points to substantial downside.
Open the company's financial profile NUE →
See also: market overview · valuation map · stock screeners