Obsidian Energy: profit tripled, but free cash flow went into rising debt
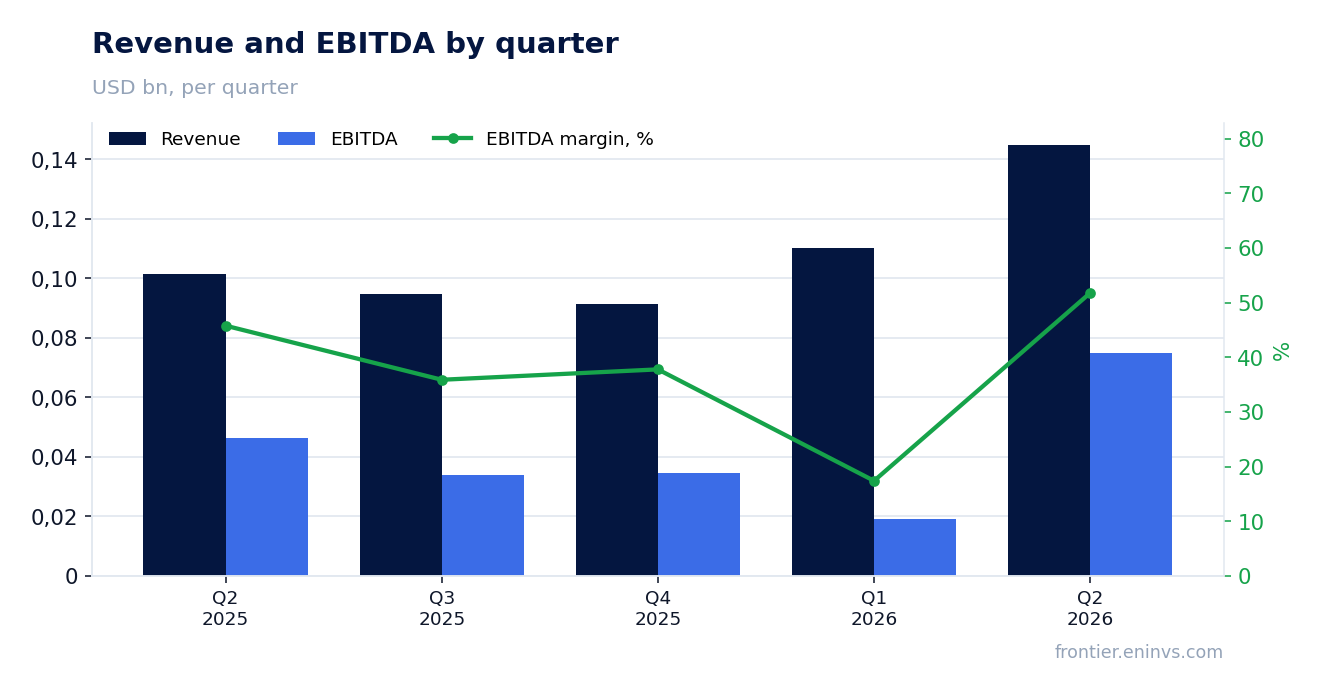
On August 25, Obsidian Energy released its Q2 2026 results. Revenue rose 43.0% year-on-year to $144.9 million, EBITDA — by 49.1% to $77.2 million, net profit — by 173.0% to $30.2 million. EBITDA margin improved to 53.3% from 51.1% a year earlier. However, net debt rose from $0.2 billion to $0.2 billion over the quarter, while operating cash flow fell to $27.5 million. The stock trades at 34.7x LTM earnings and 5.8x LTM EBITDA, offering no margin of safety, hence the verdict is neutral.
Key takeaways
— Revenue grew 43.0% year-on-year, but EBITDA added only 49.1% — margin barely changed
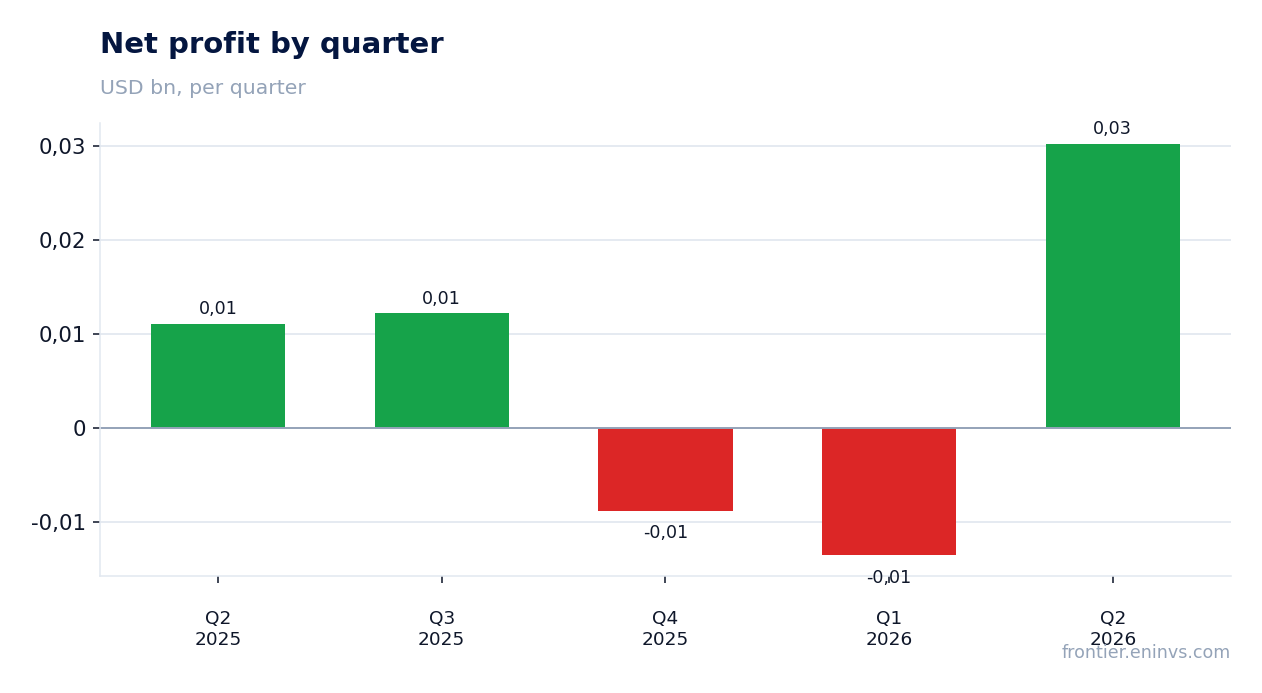
— Net profit rose 173.0% year-on-year, yet operating cash flow fell to $27.5 million
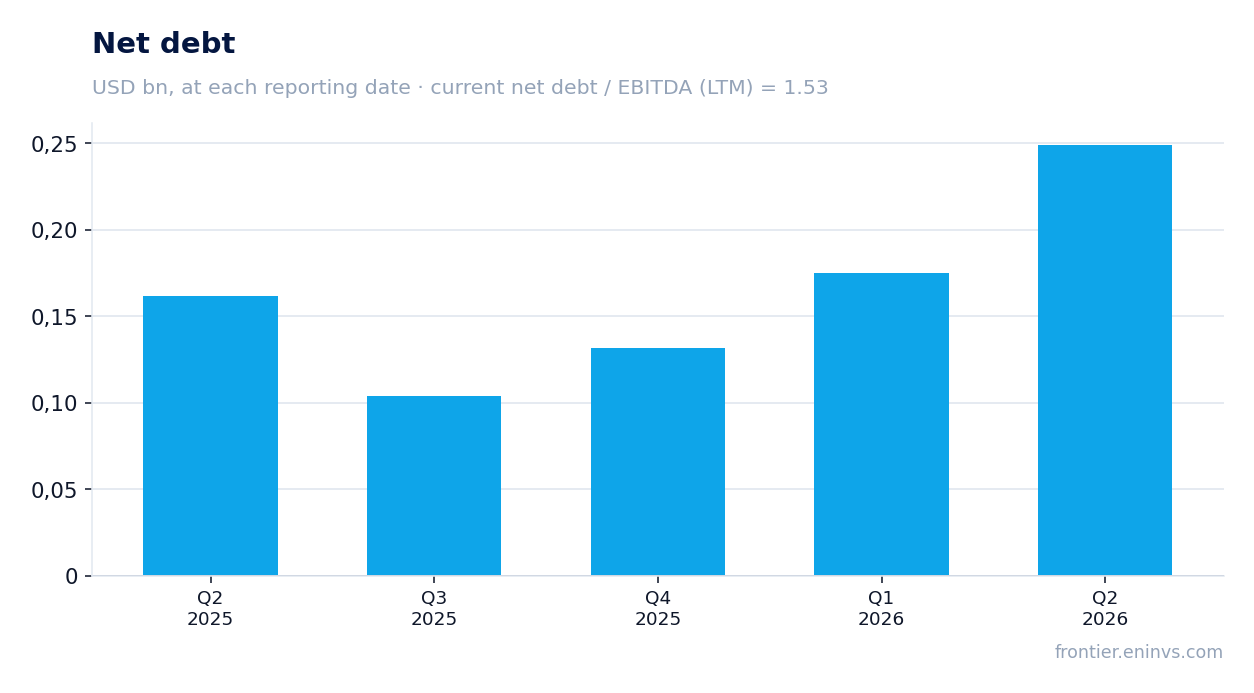
— Net debt rose from $0.2 billion to $0.2 billion over the quarter, with net debt/EBITDA LTM at 1.53
— LTM earnings imply a P/E of 34.7, above historical levels and leaving no room for error
— The portal's model values the share 60% below fair value, but that is our own estimate, not consensus
Attractiveness
Key figures, USD bn
| Metric | Q2 2025 | Q2 2026 | Change |
|---|---|---|---|
| Revenue | 0.10 | 0.14 | +43.0% |
| EBITDA | 0.05 | 0.08 | +49.1% |
| Operating profit | 0.01 | 0.04 | +228.0% |
| Net profit | 0.01 | 0.03 | +173.0% |
| Operating cash flow | 0.04 | 0.03 | -31.2% |
| EBITDA margin | 51.1% | 53.3% | +2.2 pp |
| Net margin | 10.9% | 20.8% | +9.9 pp |
Revenue grew 43.0% year-on-year, but EBITDA added only 49.1% — margin barely changed
Revenue in Q2 2026 was $144.9 million, up 43.0% from Q2 2025. This growth could stem from higher production volumes or favourable prices, but the facts provided lack detail on drivers. We note this is the highest quarterly revenue in the last five quarters.
EBITDA rose to $77.2 million, up 49.1% year-on-year. However, EBITDA margin improved only slightly, from 51.1% to 53.3%. This means revenue growth almost proportionally translated into EBITDA, without significant operating efficiency gains. The main contributor to absolute EBITDA growth was higher revenue, not cost reduction.
Net profit rose 173.0% year-on-year, yet operating cash flow fell to $27.5 million
Net profit in Q2 2026 reached $30.2 million, up 173.0% from Q2 2025. Net margin rose to 20.8% from 10.9% a year earlier. Such a jump in profit with more modest EBITDA growth indicates that a significant portion of the improvement came from below operating profit — possibly lower interest expenses or one-off items, but the exact cause is not disclosed in the facts.
Operating cash flow for the quarter was $27.5 million, notably below both net profit and EBITDA. This discrepancy could be explained by working capital increases or other non-cash items. Importantly, while profit grew, cash flow declined, casting doubt on the sustainability of the earnings improvement.
Net debt rose from $0.2 billion to $0.2 billion over the quarter, with net debt/EBITDA LTM at 1.53
Net debt as of June 30, 2026, was $0.2 billion, up from $0.2 billion on March 31, 2026. The quarterly increase was $0.1 billion. Over the last twelve months, net debt also rose by $0.1 billion — from $0.2 billion on June 30, 2025. This means the company directed part of its cash flow to financing operations rather than reducing debt.
The net debt/EBITDA LTM ratio stands at 1.53. This is a moderate level that does not create immediate risks but also does not provide much flexibility. We cannot claim that leverage rose or fell, as the facts do not provide a previous value for this ratio. We only state the current level.
LTM earnings imply a P/E of 34.7, above historical levels and leaving no room for error
Obsidian Energy's market capitalisation is $692.9 million. With net profit of $20.0 million over the last twelve months, the P/E LTM ratio is 34.7. This is a high level, implying either expectations of significant future profit growth or an underestimation of risks. For comparison, EV/EBITDA LTM is 5.8 — a more moderate valuation that accounts for debt.
Return on equity (ROE) over the last twelve months is 12.4%. This is a decent figure but does not justify such a high P/E. Investors should understand that the current valuation leaves no room for error: any slowdown in growth or decline in profit could lead to a re-rating of the shares.
The portal's model values the share 60% below fair value, but that is our own estimate, not consensus
According to our own model, which re-prices EBITDA at current commodity prices using a target EV/EBITDA multiple, the fair value of Obsidian Energy shares is 60% below the current market price. This means that, in our view, the market is overvaluing the company. However, this is not a consensus forecast but solely our analytical calculation based on current assumptions.
This valuation is sensitive to assumptions about oil and gas prices, as well as the target multiple. If commodity prices turn out higher than our assumptions or the company improves operational efficiency, fair value could be revised upwards. But at present, the model indicates significant downside.
Valuation on the latest reported figures
| Metric | Value |
|---|---|
| Market cap | 0.69 bn USD |
| P/E (LTM) | 34.7 |
| EV/EBITDA (LTM) | 5.8 |
| P/B | 0.70 |
| Net debt / EBITDA (LTM) | 1.53 |
| Operating cash flow (LTM) | 0.12 bn |
| ROE | 12.4% |
Bottom line
Bottom line: in Q2 2026, Obsidian Energy delivered strong revenue and profit growth, but the quality of this growth is questionable. Net profit rose 173.0% year-on-year, yet operating cash flow fell to $27.5 million, and net debt increased by $0.1 billion over the quarter. The P/E LTM of 34.7 leaves no margin for error, and our model indicates 60% downside. Verdict: neutral — the current price already reflects positive expectations, and a sustainable improvement in cash flow and a reduction in debt are needed to justify a higher valuation.
Open the company's financial profile OBE →
See also: market overview · valuation map · stock screeners