Obsidian Energy: revenue up a third, but profit barely moved – margin ate the growth
Obsidian Energy's third-quarter 2026 report showed revenue of USD 125.714m, up 32.5% year on year, and net profit of USD 12.813m, up only 5.1%. Net margin narrowed to 10.2% from 12.8% a year earlier, and revenue growth decelerated from 43.0% in the second quarter to 32.5% in the third. At 31.0 times trailing twelve-month earnings and 5.3 times EBITDA the share looks neutral: leverage of 1.68 times EBITDA is moderate, but the portal's model implies a 47% downside to fair value.
Key takeaways
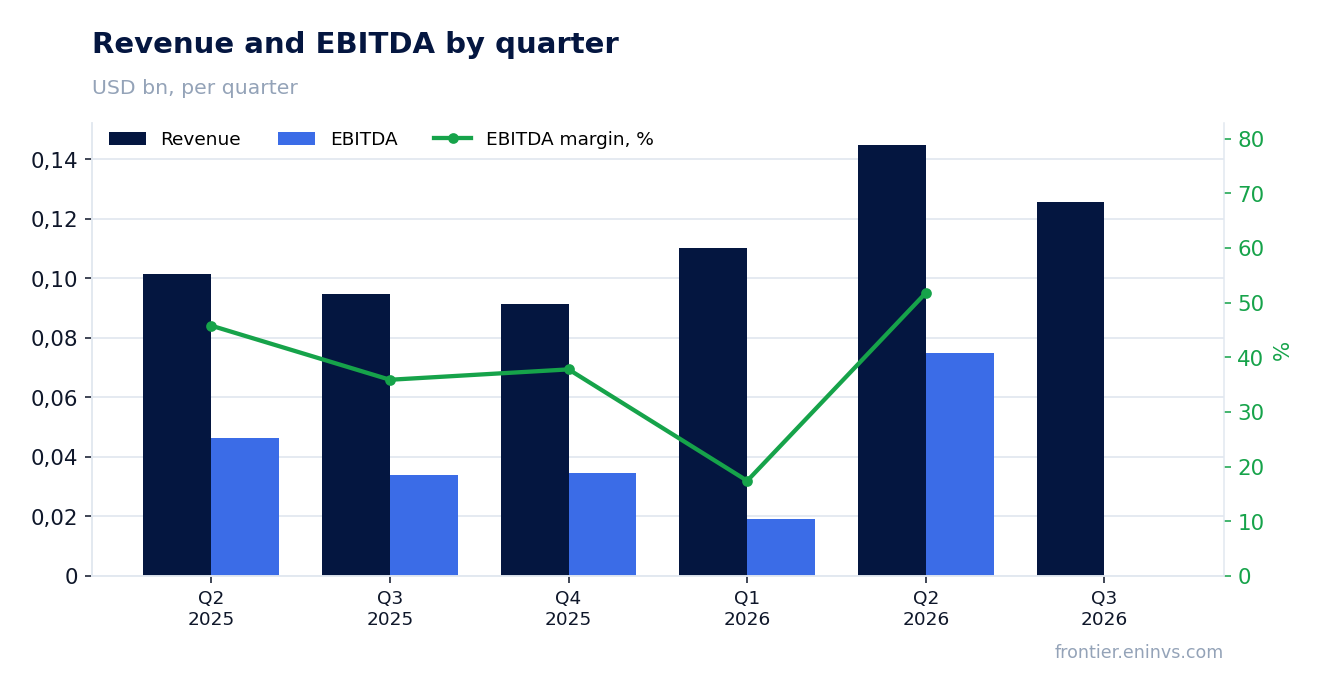
— Revenue rose 32.5% year on year, but growth decelerated from 43.0% a quarter earlier
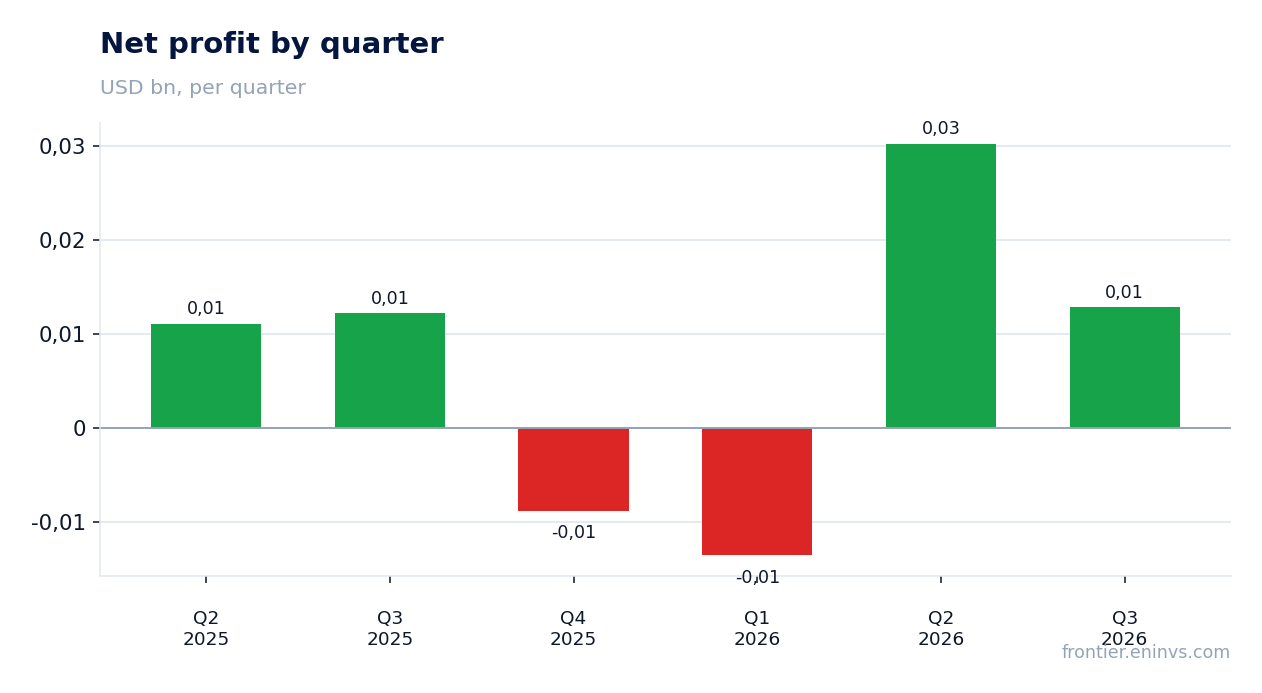
— Net profit grew only 5.1% because margin narrowed to 10.2% from 12.8%
— Operating cash flow of USD 61.932m was nearly twice capital spending of USD 53.816m
— Net debt rose over the year from USD 0.1bn to USD 0.2bn and stands at 1.68 times EBITDA
— At 31.0 times trailing earnings and 5.3 times EBITDA there is little cushion as growth slows
— The portal's model at current commodity prices implies 47% downside to fair value
Attractiveness
Key figures, USD bn
| Metric | Q3 2025 | Q3 2026 | Change |
|---|---|---|---|
| Revenue | 0.09 | 0.13 | +32.5% |
| EBITDA | 0.03 | — | — |
| Operating profit | 0.00 | — | — |
| Net profit | 0.01 | 0.01 | +5.1% |
| Operating cash flow | 0.03 | 0.06 | +88.0% |
| EBITDA margin | 35.9% | — | — |
| Net margin | 12.8% | 10.2% | -2.6 pp |
Revenue rose 32.5% year on year, but growth decelerated from 43.0% a quarter earlier
In the third quarter of 2026 revenue was USD 125.714m, 32.5% above the same quarter a year earlier. That is a strong result in itself: quarterly revenue has stayed above USD 100m for four consecutive quarters.
The growth rate, however, decelerated. In the second quarter revenue grew 43.0% year on year, in the third 32.5%. A slowdown of 10.5 percentage points suggests the low-base effect from last year is fading, and the report shows no new growth drivers.
For an investor this means the top line is still growing at a double-digit pace, but momentum is being lost. The next quarter will show whether the deceleration was one-off or a trend.
Net profit grew only 5.1% because margin narrowed to 10.2% from 12.8%
Net profit for the third quarter of 2026 was USD 12.813m, 5.1% more than a year earlier. With revenue up 32.5%, such profit dynamics mean costs grew faster than revenue.
Net margin fell to 10.2% from 12.8% in the third quarter of 2025. A 2.6 percentage point squeeze absorbed almost the entire effect of revenue growth: each additional hundred dollars of revenue now brings noticeably less profit than a year ago.
The facts do not disclose the cause of the margin squeeze. What is visible is that profit is growing slower than revenue – and that is the main question for the report: if cost pressure persists, profit may stop growing altogether.
Operating cash flow of USD 61.932m was nearly twice capital spending of USD 53.816m
Operating cash flow for the third quarter of 2026 was USD 61.932m, capital spending USD 53.816m. The difference of USD 8.116m is free cash flow left after investment.
The ratio is healthy: operating cash flow covers capital spending with a margin. But that margin is small relative to the size of the business – free cash flow is about 6.5% of quarterly revenue.
For a company investing in production, this balance means growth consumes almost all of operating cash flow. If commodity prices fall, free cash flow could quickly disappear.
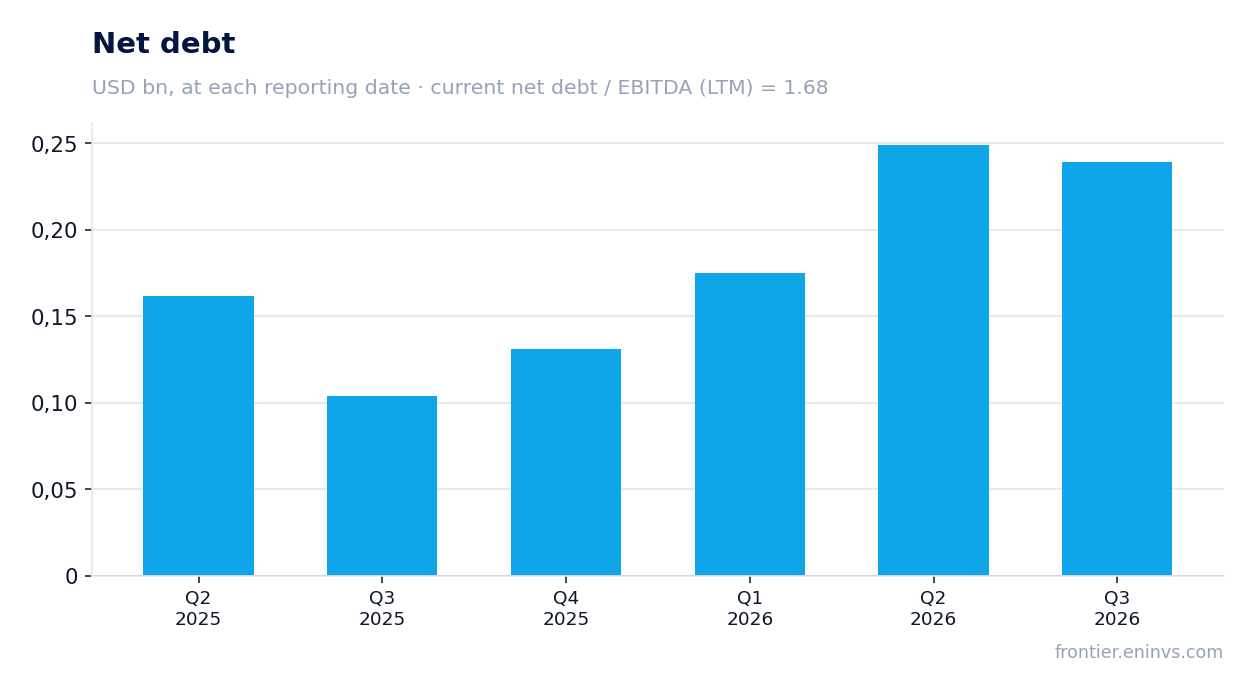
Net debt rose over the year from USD 0.1bn to USD 0.2bn and stands at 1.68 times EBITDA
Net debt at 30 September 2026 was USD 239.089m, or USD 0.2bn. A year earlier, at 30 September 2025, it was USD 0.1bn – a 12-month increase of USD 0.1bn. Since the end of June 2026 debt has barely changed: USD 0.2bn at 30 June and USD 0.2bn at 30 September.
The ratio of net debt to trailing twelve-month EBITDA is 1.68. That is a moderate level: the company services its debt without strain, but there is little room for a new borrowing spree.
The rise in debt over the year coincided with a period of active capital spending. If the investment programme continues at the same pace, debt may keep growing, and leverage with it.
At 31.0 times trailing earnings and 5.3 times EBITDA there is little cushion as growth slows
On trailing twelve-month earnings the share trades at 31.0 times, on EBITDA at 5.3 times. The EV/EBITDA ratio looks modest for a commodity company, but a P/E of 31.0 means the market is paying a high price for current earnings.
Meanwhile third-quarter profit grew only 5.1% and margin narrowed. A high P/E against decelerating profit growth is a vulnerable combination: if profit does not accelerate, the multiple will adjust.
Return on equity is 12.4% – decent but not outstanding. To justify the current valuation the company needs either to accelerate profit growth or to improve margin substantially.
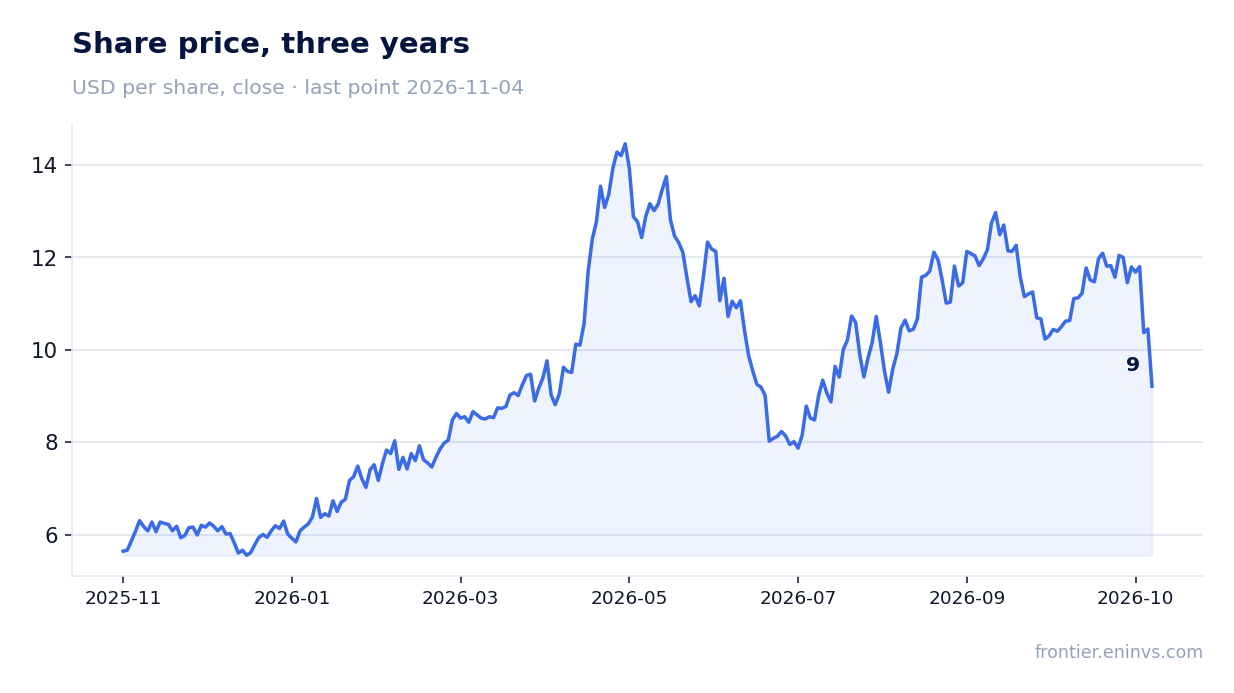
The portal's model at current commodity prices implies 47% downside to fair value
The portal's model, which reprices EBITDA at current commodity prices and a target EV/EBITDA, puts fair value 47% below the current market price. This is our own estimate, not a market consensus.
The gap arises because the market, judging by the valuation, is pricing in higher commodity prices or a more resilient margin than the current environment. If prices stay at current levels, the share has notable downside.
The model is sensitive to price assumptions and the target multiple. But even allowing for that sensitivity, the signal is unambiguous: at current prices the stock looks expensive.
Valuation on the latest reported figures
| Metric | Value |
|---|---|
| Market cap | 0.62 bn USD |
| P/E (LTM) | 31.0 |
| EV/EBITDA (LTM) | 5.3 |
| P/B | 0.62 |
| Net debt / EBITDA (LTM) | 1.68 |
| Operating cash flow (LTM) | 0.12 bn |
| ROE | 12.4% |
Bottom line
The strong side of the report is revenue: USD 125.714m, up 32.5% year on year, and operating cash flow of USD 61.932m covering capital spending. The weak side is profit: it grew only 5.1% because margin narrowed to 10.2% from 12.8%. Leverage of 1.68 times EBITDA is moderate, but net debt rose over the year from USD 0.1bn to USD 0.2bn. The key question for a holder is whether the company can accelerate profit growth to justify a P/E of 31.0; the portal's model says that at current commodity prices the share is 47% above fair value.
Open the company's financial profile OBE →
See also: market overview · valuation map · stock screeners