OMV: revenue up 40.6%, but the 85.3% profit jump came from margin, not volumes
OMV reported results for the third quarter of 2026. Revenue came in at USD 10,292.1 million, EBITDA at USD 2,970.8 million, and net profit at USD 1,176.4 million. Year on year revenue rose 40.6%, EBITDA 59.5%, and net profit 85.3%, while the EBITDA margin climbed to 28.9% from 25.4%. Yet top-line growth decelerated from 41.7% in the second quarter, and EV/EBITDA of 4.0x sits above the company's own three-year average of 2.3x – the share looks more expensive than its own history, so the verdict is neutral.
Key takeaways
— Revenue rose 40.6% year on year, but growth decelerated from 41.7% in the second quarter
— EBITDA grew 59.5% on 40.6% revenue growth – the margin rose to 28.9% from 25.4%
— Net profit rose 85.3%, lifting its margin to 11.4% from 8.7% a year earlier
— Operating cash flow for the quarter was USD 2,526.2 million – above net profit
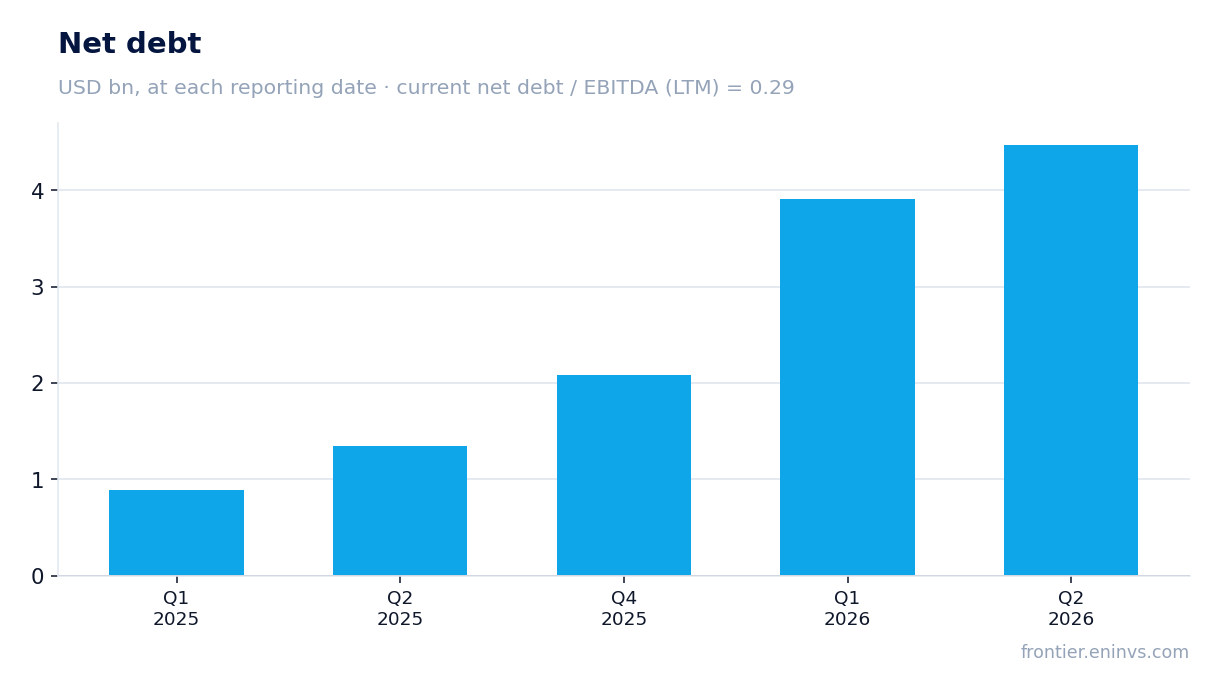
— Leverage on the latest balance sheet stands at 0.29x LTM EBITDA
— Trailing twelve-month dividend yield is 6.0%, with payouts covered by profit
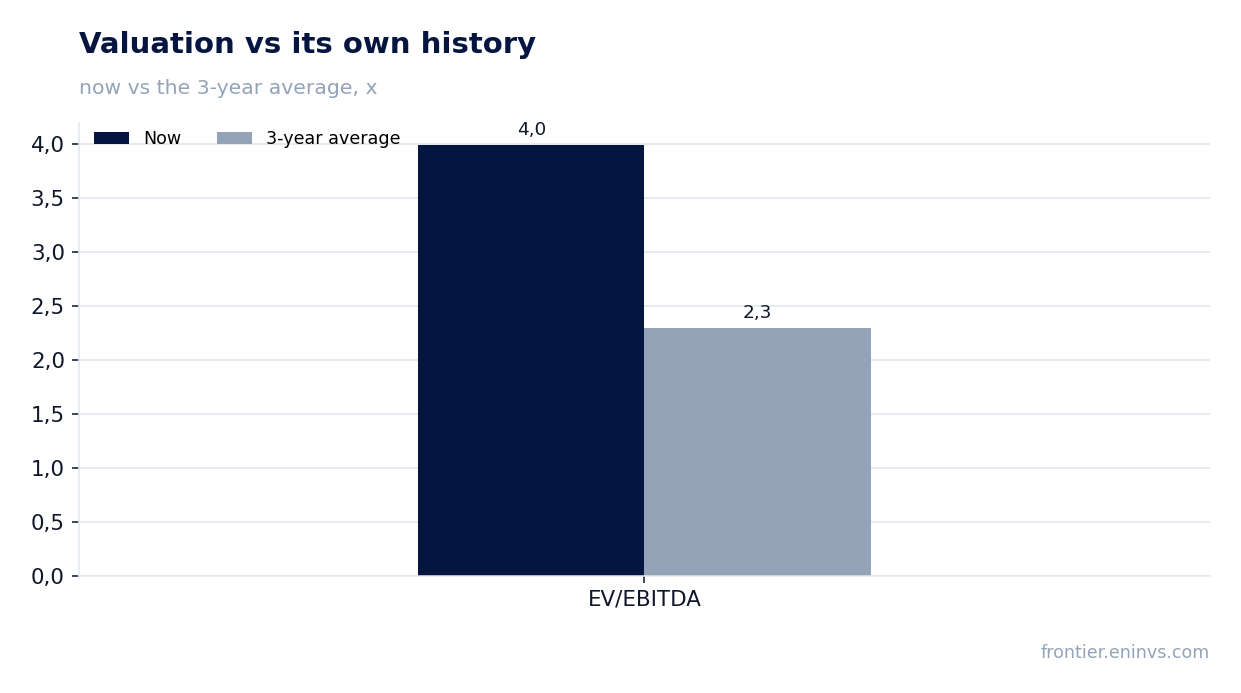
— EV/EBITDA of 4.0x is 74% above its own three-year average of 2.3x
Attractiveness
Key figures, USD bn
| Metric | Q3 2025 | Q3 2026 | Change |
|---|---|---|---|
| Revenue | 7.32 | 10.3 | +40.6% |
| EBITDA | 1.86 | 2.97 | +59.5% |
| Operating profit | 1.26 | 2.41 | +91.7% |
| Net profit | 0.63 | 1.18 | +85.3% |
| Operating cash flow | 1.28 | 2.53 | +97.5% |
| EBITDA margin | 25.4% | 28.9% | +3.5 pp |
| Net margin | 8.7% | 11.4% | +2.7 pp |
Revenue rose 40.6% year on year, but growth decelerated from 41.7% in the second quarter
Third-quarter 2026 revenue was USD 10,292.1 million versus 7,319.5 million a year earlier. Growth of 40.6% is strong, but it is slower than the 41.7% posted in the second quarter – quarterly momentum decelerated.
The slowdown is small – under one percentage point – yet it shows the main growth impulse has already played out. The second quarter delivered 9,332.5 million and the third 10,292.1 million, so sequential growth continues; the year-ago base is simply getting higher.
The facts do not break down what supported revenue. What is clear is that the company is selling materially more than a year ago and doing so at a higher margin – growth is not being bought with discounts.
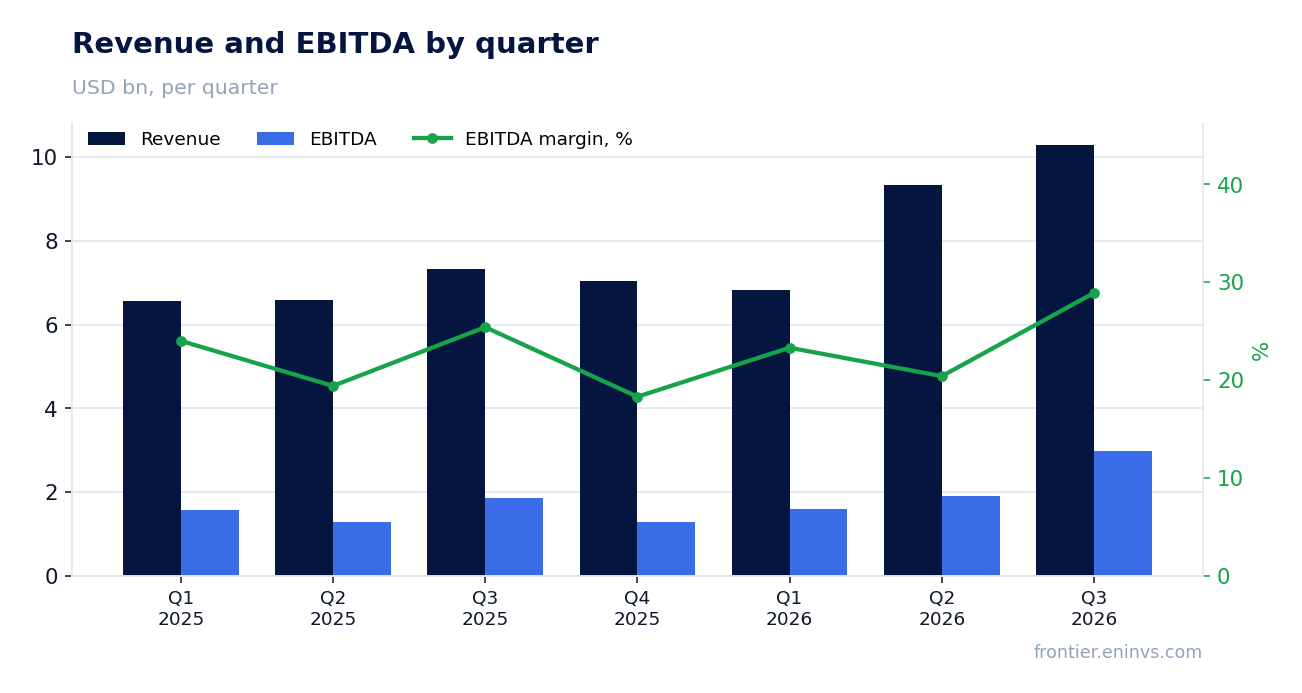
EBITDA grew 59.5% on 40.6% revenue growth – the margin rose to 28.9% from 25.4%
Third-quarter EBITDA was USD 2,970.8 million versus 1,862.6 million a year earlier, up 59.5%. That is faster than revenue, so the EBITDA margin rose to 28.9% from 25.4%.
Operating profit was 2,406.7 million, implying roughly 564 million of depreciation inside EBITDA. The gap between EBITDA growth and revenue growth means costs rose more slowly than sales; the facts do not specify which cost lines held back spending.
For a shareholder the fact itself matters: the company is growing both volume and unit profitability at once. That is higher-quality growth than simply selling more at the same margin.
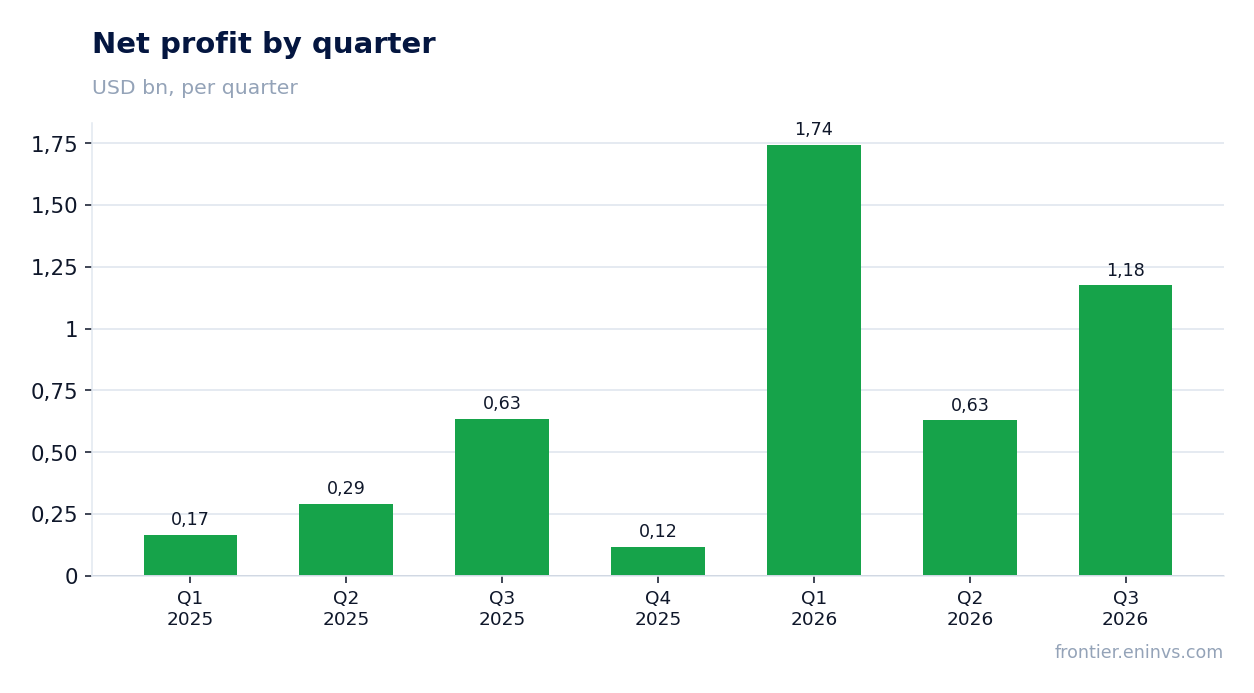
Net profit rose 85.3%, lifting its margin to 11.4% from 8.7% a year earlier
Third-quarter net profit was USD 1,176.4 million versus 634.9 million a year earlier, up 85.3%. The net margin rose to 11.4% from 8.7%.
Profit is growing faster than EBITDA, so something below the operating line also improved – either interest costs fell, the tax burden eased, or one-offs helped. The facts do not disclose the cause, so this gap should not be treated as sustainable.
Over the trailing twelve months net profit was USD 3,668.2 million. That is a level, not a growth rate: comparing it with quarterly growth rates is invalid, but it shows the quarterly result fits the annual picture.
Operating cash flow for the quarter was USD 2,526.2 million – above net profit
Third-quarter operating cash flow was USD 2,526.2 million, 2.1 times net profit. Earnings are backed by cash, not by an accounting result.
Over the trailing twelve months operating cash flow was USD 6,910.1 million against net profit of 3,668.2 million. The company consistently converts profit into cash, and the quarter confirmed it.
Capital expenditure is not disclosed in the facts, so free cash flow is not calculated. But with 2,526.2 million of quarterly operating flow, the company has room for investment and shareholder payouts.
Leverage on the latest balance sheet stands at 0.29x LTM EBITDA
Net debt on the latest annual balance sheet was USD 2,088.0 million, or 0.29x LTM EBITDA. Leverage is low: debt is almost fully covered by a single quarter's EBITDA.
Debt rose from 895.5 million at the end of the first quarter of 2025 to 4,473.3 million at the end of the second quarter of 2026, but fell back to 2,088.0 million on the latest balance sheet. The direction of the leverage ratio is not disclosed in the facts, so we state the level only.
With leverage this low, interest costs should not weigh heavily on profit. That helps explain why net profit is growing faster than EBITDA, though the facts do not give the precise cause.
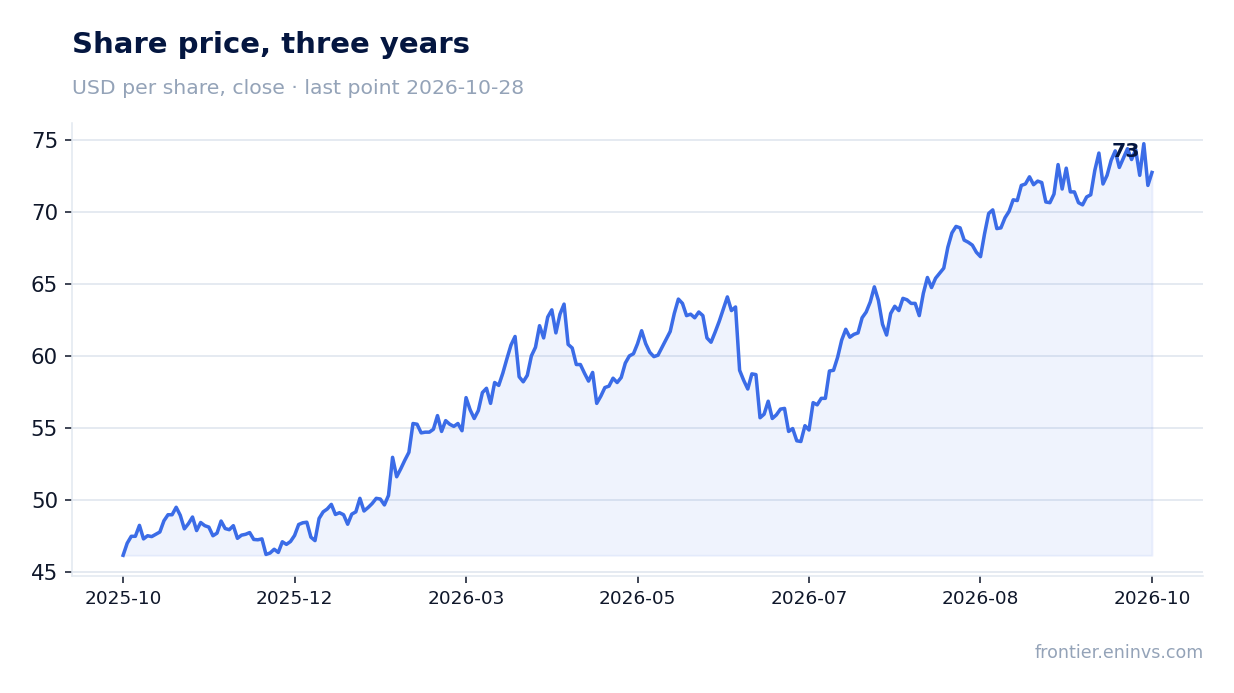
Trailing twelve-month dividend yield is 6.0%, with payouts covered by profit
The trailing twelve-month dividend yield is 6.0%. Payouts are covered by profit: over the same period net profit was USD 3,668.2 million and operating cash flow 6,910.1 million.
Our estimate for the current year's dividend assumes the yield stays near 6%. It rests on two things: profit remaining positive and leverage of 0.29x EBITDA, which does not require cash to be diverted to debt.
A 6.0% yield is notably high for a company with such low leverage, and that is the main argument for the share. A fall in profit or a rise in capital expenditure – not disclosed in the facts – could reduce the payout.
EV/EBITDA of 4.0x is 74% above its own three-year average of 2.3x
LTM EV/EBITDA is 4.0x against its own three-year average of 2.3x. The share trades 74% above its own history on this multiple.
LTM P/E is 7.2x, which looks inexpensive for a company with an 11.4% net margin and a 20.9% return on equity. But EV/EBITDA shows the market has already priced in an earnings recovery.
On the portal's model, which re-prices EBITDA at current commodity prices against a target EV/EBITDA, the share sits 15% below fair value. That is our own estimate, not a market consensus.
Valuation on the latest reported figures
| Metric | Value |
|---|---|
| Market cap | 26.5 bn USD |
| P/E (LTM) | 7.2 |
| EV/EBITDA (LTM) | 4.0 |
| P/B | 1.38 |
| Net debt / EBITDA (LTM) | 0.29 |
| Operating cash flow (LTM) | 6.91 bn |
| ROE | 20.9% |
| Dividend yield (12m) | 6.0% |
| EV/EBITDA, 3-year average | 2.3 |
Bottom line
The quarter was strong: revenue rose 40.6%, EBITDA 59.5%, net profit 85.3%, and the EBITDA margin climbed to 28.9%. Growth is backed by cash – operating flow of USD 2,526.2 million exceeded profit – and leverage of 0.29x EBITDA leaves room. But revenue growth decelerated from 41.7%, and EV/EBITDA of 4.0x is 74% above its own three-year average of 2.3x. The key question for a holder is whether the margin holds as the year-ago base rises, and whether the market's valuation is justified. The verdict is neutral: a 6.0% dividend is attractive, but the price already reflects a lot of good news.
Open the company's financial profile OMV →
See also: market overview · valuation map · stock screeners