Osisko Gold Royalties: gold up 23.4% while revenue rose 76% – but spot has fallen and the portal model shows negative upside
Contents

On 12 November Osisko Gold Royalties reported results for the third quarter of 2026. The average gold price in the period was 4,268 dollars per ounce against 3,459 a year earlier (+23.4%), and down 5.5% from the previous quarter. Revenue reached 90.2 million dollars (+76.0% year on year), net profit was 55.4 million (-6.6%) and operating cash flow 77.6 million. At the year-ago volumes and costs, moving only the gold price, our calculation puts revenue at 63.2 million – the company earned 27.0 million more, a gap explained by higher volumes and one-off receipts rather than by price. Our conclusion: the share is unattractive – the portal model puts the upside to fair value at minus 51%. Our view: the share is unattractive at the current price; upside on the portal model -51%.
Our view: is there upside
Our view in numbers
| Metric | Our read |
|---|---|
| Verdict | Unattractive |
| Upside on the portal model | -51% |
| How the model works | spot model: EBITDA re-priced to current commodity prices at the target EV/EBITDA, against market cap |
| EV/EBITDA now and 3-year average | 18.6 vs 29.7 – a 37% discount to its history |
| Dividend yield, 12m | 0.5% |
| Net debt / EBITDA | 0.41 – low leverage |
| Strongest case for | Leverage of 0.41 times EBITDA and quarterly operating cash flow of 77.6 million give the company room for new deals even on a weak price backdrop. |
| Strongest case against | The portal model shows minus 51% upside to fair value, and spot is 8.3% below the reported-period average – next year's profit will be lower. |
| What would change the view | The verdict would improve by one step if gold holds sustainably above 4,268 dollars per ounce, bringing the price effect back into profit and lifting the portal model's upside. |
Key takeaways
— Gold averaged 4,268 dollars per ounce – 23.4% above a year earlier but 5.5% below the previous quarter
— At year-ago prices and costs revenue would have been 63.2 million; the company booked 90.2 million – the 27.0 million gap came from volumes and one-off receipts
— Revenue grew 76.0% year on year but decelerated from 126.4% in the previous quarter
— Net profit fell 6.6% to 55.4 million because the year-ago base contained a one-off gain that lifted the margin to 115.7%
— Leverage is low: net debt of 151.5 million, 0.41 times trailing twelve-month EBITDA
— A dividend yield of 0.52% does not cover inflation and offers no margin of safety
— EV/EBITDA of 18.6 is 37% below its own three-year average of 29.7, yet the portal model still shows the share 51% overvalued
Key figures, USD bn
| Metric | Q3 2025 | Q3 2026 | Change |
|---|---|---|---|
| Revenue | 0.05 | 0.09 | +76.0% |
| EBITDA | 0.04 | — | — |
| Operating profit | 0.03 | 0.07 | +102.2% |
| Net profit | 0.06 | 0.06 | -6.6% |
| Operating cash flow | 0.05 | 0.08 | +69.1% |
| Capex | 0.01 | — | — |
| EBITDA margin | 87.5% | — | — |
| Net margin | 115.7% | 61.4% | -54.3 pp |
Gold averaged 4,268 dollars per ounce – 23.4% above a year earlier but 5.5% below the previous quarter
The average gold price in the third quarter of 2026 was 4,268 dollars per ounce against 3,459 dollars a year earlier, up 23.4%. Against the previous quarter the price fell 5.5%, from 4,514 dollars. For a royalty company this is the main external driver: revenue tracks the metal price almost without intermediate costs.
Spot on 12 November was 3,916 dollars, 8.3% below the average for the reported period. The quarterly results were therefore built on prices the market no longer offers. The next report will come against a weaker price backdrop unless spot recovers.
Commodity prices: period average and now
| Benchmark | Year ago | Q3 2026 | YoY | Spot 2026-11-12 |
|---|---|---|---|---|
| Gold, USD | 3 459 | 4 268 | +23,4% | 3 916 |
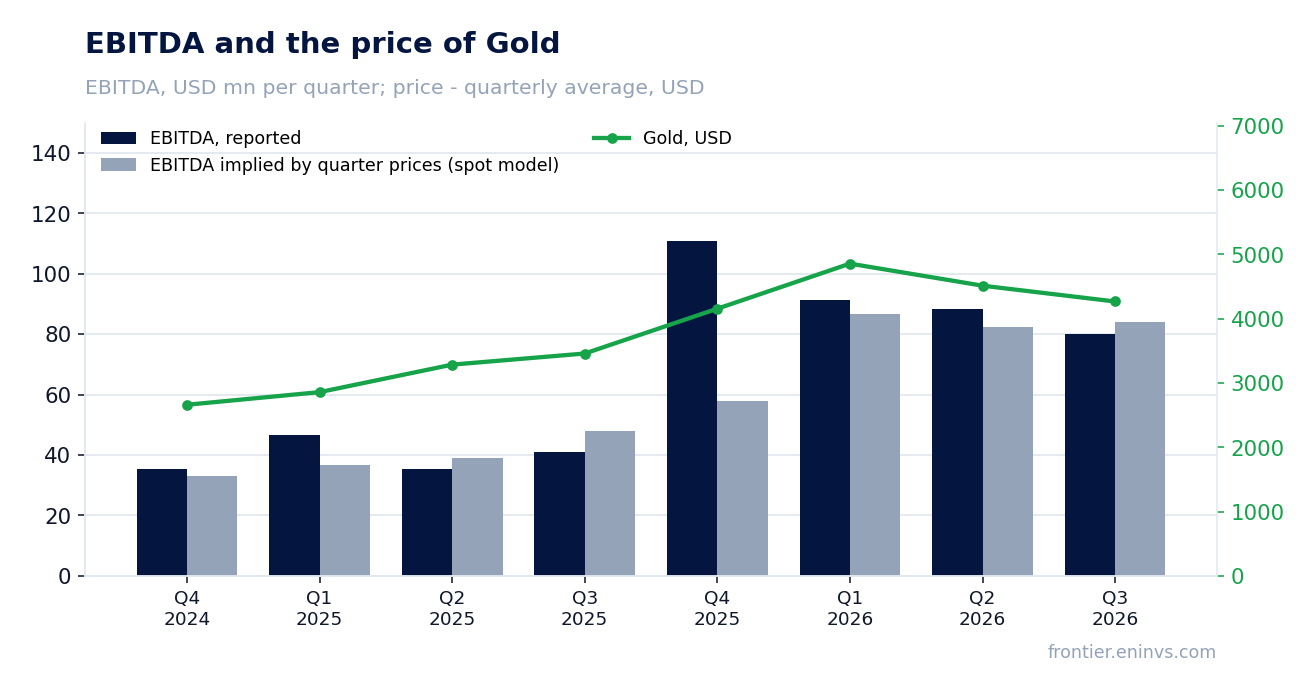
At year-ago prices and costs revenue would have been 63.2 million; the company booked 90.2 million – the 27.0 million gap came from volumes and one-off receipts
At the year-ago volumes and costs, moving only this period's gold price, our calculation puts revenue at 63.2 million dollars and EBITDA at 56.8 million. Actual revenue was 90.2 million, 27.0 million or 42.6% higher. The price effect contributed only 12.0 million of that increase.
The rest came from volumes and from receipts not tied to production. The facts give no breakdown by asset, so the specific mine or transaction behind the gap cannot be named. But the size of the gap – almost half of actual revenue – shows the quarter is atypical for a royalty model, where revenue should track price.
The portal's spot model, built from the average of the previous four quarters, expected revenue of 95.6 million and EBITDA of 84.1 million. Actual revenue came in 5.6% below the model. That deviation runs the other way – the model overestimated volumes rather than underestimating them.
What the prices implied and what the company earned
| Base (Q3 2025) | Implied at period prices | Reported | Reported vs implied | |
|---|---|---|---|---|
| Revenue, USD mn | 51,3 | 63,2 | 90,2 | +42,6% |
| EBITDA, USD mn | 44,9 | 56,8 | — | — |
| EBITDA, portal spot model, USD mn | — | 84,1 | — | — |
Revenue and EBITDA by quarter
| Period | Measure | bn USD |
|---|---|---|
| Q4 2024 | Revenue | 0.057694000000000016 |
| Q1 2025 | Revenue | 0.054916 |
| Q2 2025 | Revenue | 0.043199 |
| Q3 2025 | Revenue | 0.051258000000000005 |
| Q4 2025 | Revenue | 0.127997 |
| Q1 2026 | Revenue | 0.10283199999999999 |
| Q2 2026 | Revenue | 0.09781999999999999 |
| Q3 2026 | Revenue | 0.090205 |
| Q4 2024 | EBITDA | 0.03547699999999999 |
| Q1 2025 | EBITDA | 0.046547 |
| Q2 2025 | EBITDA | 0.035307000000000005 |
| Q3 2025 | EBITDA | 0.040920000000000005 |
| Q4 2025 | EBITDA | 0.110981 |
| Q1 2026 | EBITDA | 0.091235 |
| Q2 2026 | EBITDA | 0.088167 |
| Q3 2026 | EBITDA | 0.079991 |
EBITDA margin
| Period | Measure | % |
|---|---|---|
| Q4 2024 | EBITDA margin | 61.5 |
| Q1 2025 | EBITDA margin | 84.8 |
| Q2 2025 | EBITDA margin | 81.7 |
| Q3 2025 | EBITDA margin | 79.8 |
| Q4 2025 | EBITDA margin | 86.7 |
| Q1 2026 | EBITDA margin | 88.7 |
| Q2 2026 | EBITDA margin | 90.1 |
| Q3 2026 | EBITDA margin | 88.7 |
Revenue grew 76.0% year on year but decelerated from 126.4% in the previous quarter
Third-quarter 2026 revenue was 90.2 million dollars, 76.0% above the 51.3 million of a year earlier. That is strong growth, but noticeably slower than the 126.4% of the second quarter. The deceleration has two causes: the year-ago base rose, and the gold price fell 5.5% from the previous quarter.
Sequentially, revenue fell from 97.8 million to 90.2 million. At the previous quarter's volumes and costs and this period's price, our calculation puts revenue at 92.5 million, so the actual figure is 2.5% lower. Price explains most of the sequential decline, but not all of it.
Year on year growth remains a multiple, and that is the main point. The question is whether it holds once the price effect fades: at today's spot of 3,916 dollars, the next quarter will be compared with a period when gold cost around 4,000 dollars.
Net profit fell 6.6% to 55.4 million because the year-ago base contained a one-off gain that lifted the margin to 115.7%
Net profit for the reported quarter was 55.4 million dollars against 59.3 million a year earlier, a fall of 6.6%, while revenue rose 76.0%. The cause is the comparison base: a year earlier the net margin was 115.7%, meaning profit exceeded revenue. That happens when a one-off gain sits in the profit line, unrelated to operations.
In the reported quarter the margin returned to 61.4% – high for an ordinary company but normal for a low-cost royalty model. Operating profit was 67.6 million and operating cash flow 77.6 million. The gap between profit and cash flow is small, so earnings quality is good.
The one-off gain a year ago is the only explanation for profit falling while revenue rose. Without it, profit would have grown with revenue. For valuation, the normal 61.4% margin matters, not the distorted base of last year.
Leverage is low: net debt of 151.5 million, 0.41 times trailing twelve-month EBITDA
As of 30 September 2026 net debt was 151.5 million dollars. Against trailing twelve-month EBITDA of 367.6 million that is 0.41 times – low leverage that constrains neither dividends nor new deals. Operating cash flow over the last twelve months was 349.5 million, comfortably covering debt service.
Capital expenditure is not disclosed for the reported quarter, but in the first and second quarters of 2026 it was 98.5 million and 282.9 million – the company invested in new royalties and streams. That reinvestment should support future volumes, and it also explains why net debt appeared despite strong operating cash flow.
At current gold prices the portal model puts EBITDA at 311.2 million and net debt to that EBITDA at 0.49. Even on a weaker price backdrop leverage stays below 0.5, so debt is not the main risk in this story.
Valuation vs its own history
now vs the 3-year average
| Period | Measure | × |
|---|---|---|
| EV/EBITDA | Now | 18.590079757218376 |
| EV/EBITDA | 3-year average | 29.738578721404373 |
A dividend yield of 0.52% does not cover inflation and offers no margin of safety
The trailing twelve-month dividend yield is 0.52% on a market capitalisation of 6,733.8 million dollars. For a low-cost royalty company that is modest: the payout competes with neither the key rate nor long-bond yields. The dividend here is a symbolic part of capital return rather than an income source.
Our estimate for the current year's dividend starts from trailing twelve-month profit of 288.3 million and the payout ratio the company has historically kept. The facts give no exact policy, so we do not name a sum. What matters is that at a 0.52% yield even a doubling of the payout would not change the picture for a holder.
A fall in the gold price could cut the payout: at spot of 3,916 dollars the portal model puts EBITDA at 311.2 million against 367.6 million over the last twelve months, 9.0% lower. If the price stays there, next year's profit will be lower, and the dividend would have to be maintained from the balance sheet or reduced.
Share price, three years
close, last point 2026-11-11
| Period | Measure | USD per share |
|---|---|---|
| 2025-11-12 | Closing price | 33.369998931884766 |
| 2025-11-13 | Closing price | 32.720001220703125 |
| 2025-11-14 | Closing price | 32.400001525878906 |
| 2025-11-17 | Closing price | 31.889999389648438 |
| 2025-11-18 | Closing price | 32.459999084472656 |
| 2025-11-19 | Closing price | 33.11000061035156 |
| 2025-11-20 | Closing price | 32.2400016784668 |
| 2025-11-21 | Closing price | 32.22999954223633 |
| 2025-11-24 | Closing price | 33.650001525878906 |
| 2025-11-25 | Closing price | 33.58000183105469 |
| 2025-11-26 | Closing price | 34.189998626708984 |
| 2025-11-28 | Closing price | 34.900001525878906 |
| 2025-12-01 | Closing price | 34.5 |
| 2025-12-02 | Closing price | 34.029998779296875 |
| 2025-12-03 | Closing price | 34.060001373291016 |
| 2025-12-04 | Closing price | 34.209999084472656 |
| 2025-12-05 | Closing price | 33.95000076293945 |
| 2025-12-08 | Closing price | 33.540000915527344 |
| 2025-12-09 | Closing price | 34.70000076293945 |
| 2025-12-10 | Closing price | 35.2400016784668 |
| 2025-12-11 | Closing price | 35.90999984741211 |
| 2025-12-12 | Closing price | 36.04999923706055 |
| 2025-12-15 | Closing price | 34.709999084472656 |
| 2025-12-16 | Closing price | 35.79999923706055 |
| 2025-12-17 | Closing price | 35.5 |
| 2025-12-18 | Closing price | 35.59000015258789 |
| 2025-12-19 | Closing price | 36.970001220703125 |
| 2025-12-22 | Closing price | 36.91999816894531 |
| 2025-12-23 | Closing price | 37.400001525878906 |
| 2025-12-24 | Closing price | 37.040000915527344 |
| 2025-12-26 | Closing price | 37.58000183105469 |
| 2025-12-29 | Closing price | 35.58000183105469 |
| 2025-12-30 | Closing price | 35.970001220703125 |
| 2025-12-31 | Closing price | 35.38999938964844 |
| 2026-01-02 | Closing price | 35.209999084472656 |
| 2026-01-05 | Closing price | 35.529998779296875 |
| 2026-01-06 | Closing price | 36.849998474121094 |
| 2026-01-07 | Closing price | 38.36000061035156 |
| 2026-01-08 | Closing price | 38.04999923706055 |
| 2026-01-09 | Closing price | 38.599998474121094 |
| 2026-01-12 | Closing price | 40.119998931884766 |
| 2026-01-13 | Closing price | 40.939998626708984 |
| 2026-01-14 | Closing price | 40.77000045776367 |
| 2026-01-15 | Closing price | 40.84000015258789 |
| 2026-01-16 | Closing price | 41.20000076293945 |
| 2026-01-20 | Closing price | 43.7599983215332 |
| 2026-01-21 | Closing price | 43.29999923706055 |
| 2026-01-22 | Closing price | 45.310001373291016 |
| 2026-01-23 | Closing price | 45.20000076293945 |
| 2026-01-26 | Closing price | 45.54999923706055 |
| 2026-01-27 | Closing price | 46.02000045776367 |
| 2026-01-28 | Closing price | 46.81999969482422 |
| 2026-01-29 | Closing price | 45.709999084472656 |
| 2026-01-30 | Closing price | 39.439998626708984 |
| 2026-02-02 | Closing price | 38.720001220703125 |
| 2026-02-03 | Closing price | 40.279998779296875 |
| 2026-02-04 | Closing price | 41.06999969482422 |
| 2026-02-05 | Closing price | 38.66999816894531 |
| 2026-02-06 | Closing price | 40.029998779296875 |
| 2026-02-09 | Closing price | 42.119998931884766 |
| 2026-02-10 | Closing price | 42.939998626708984 |
| 2026-02-11 | Closing price | 43.86000061035156 |
| 2026-02-12 | Closing price | 40.34000015258789 |
| 2026-02-13 | Closing price | 42.689998626708984 |
| 2026-02-17 | Closing price | 42.310001373291016 |
| 2026-02-18 | Closing price | 43.529998779296875 |
| 2026-02-19 | Closing price | 41.93000030517578 |
| 2026-02-20 | Closing price | 43.68000030517578 |
| 2026-02-23 | Closing price | 44.72999954223633 |
| 2026-02-24 | Closing price | 45.43000030517578 |
| 2026-02-25 | Closing price | 45.81999969482422 |
| 2026-02-26 | Closing price | 47.0099983215332 |
| 2026-02-27 | Closing price | 47.38999938964844 |
| 2026-03-02 | Closing price | 47.72999954223633 |
| 2026-03-03 | Closing price | 44.09000015258789 |
| 2026-03-04 | Closing price | 44.02000045776367 |
| 2026-03-05 | Closing price | 43.040000915527344 |
| 2026-03-06 | Closing price | 43.099998474121094 |
| 2026-03-09 | Closing price | 43.41999816894531 |
| 2026-03-10 | Closing price | 43.689998626708984 |
| 2026-03-11 | Closing price | 42.97999954223633 |
| 2026-03-12 | Closing price | 42.04999923706055 |
| 2026-03-13 | Closing price | 40.33000183105469 |
| 2026-03-16 | Closing price | 40.2599983215332 |
| 2026-03-17 | Closing price | 39.75 |
| 2026-03-18 | Closing price | 36.86000061035156 |
| 2026-03-19 | Closing price | 34.599998474121094 |
| 2026-03-20 | Closing price | 32.869998931884766 |
| 2026-03-23 | Closing price | 34.36000061035156 |
| 2026-03-24 | Closing price | 34.630001068115234 |
| 2026-03-25 | Closing price | 34.77000045776367 |
| 2026-03-26 | Closing price | 34.119998931884766 |
| 2026-03-27 | Closing price | 35.22999954223633 |
| 2026-03-30 | Closing price | 35.25 |
| 2026-03-31 | Closing price | 38.02000045776367 |
| 2026-04-01 | Closing price | 40.11000061035156 |
| 2026-04-02 | Closing price | 40.27000045776367 |
| 2026-04-06 | Closing price | 39.779998779296875 |
| 2026-04-07 | Closing price | 40.119998931884766 |
| 2026-04-08 | Closing price | 40.22999954223633 |
| 2026-04-09 | Closing price | 39.650001525878906 |
| 2026-04-10 | Closing price | 39.439998626708984 |
| 2026-04-13 | Closing price | 39.470001220703125 |
| 2026-04-14 | Closing price | 40.11000061035156 |
| 2026-04-15 | Closing price | 40.130001068115234 |
| 2026-04-16 | Closing price | 40.869998931884766 |
| 2026-04-17 | Closing price | 42.619998931884766 |
| 2026-04-20 | Closing price | 42.7400016784668 |
| 2026-04-21 | Closing price | 39.540000915527344 |
| 2026-04-22 | Closing price | 40.45000076293945 |
| 2026-04-23 | Closing price | 40.040000915527344 |
| 2026-04-24 | Closing price | 40.349998474121094 |
| 2026-04-27 | Closing price | 38.88999938964844 |
| 2026-04-28 | Closing price | 37.58000183105469 |
| 2026-04-29 | Closing price | 36.5 |
| 2026-04-30 | Closing price | 36.90999984741211 |
| 2026-05-01 | Closing price | 36.720001220703125 |
| 2026-05-04 | Closing price | 36.09000015258789 |
| 2026-05-05 | Closing price | 36.09000015258789 |
| 2026-05-06 | Closing price | 38.7400016784668 |
| 2026-05-07 | Closing price | 37.47999954223633 |
| 2026-05-08 | Closing price | 38.41999816894531 |
| 2026-05-11 | Closing price | 39.79999923706055 |
| 2026-05-12 | Closing price | 39.61000061035156 |
| 2026-05-13 | Closing price | 39.20000076293945 |
| 2026-05-14 | Closing price | 38.369998931884766 |
| 2026-05-15 | Closing price | 36.41999816894531 |
| 2026-05-18 | Closing price | 36.16999816894531 |
| 2026-05-19 | Closing price | 35.4900016784668 |
| 2026-05-20 | Closing price | 36.04999923706055 |
| 2026-05-21 | Closing price | 35.56999969482422 |
| 2026-05-22 | Closing price | 35.599998474121094 |
| 2026-05-26 | Closing price | 36.90999984741211 |
| 2026-05-27 | Closing price | 35.689998626708984 |
| 2026-05-28 | Closing price | 35.869998931884766 |
| 2026-05-29 | Closing price | 37.0099983215332 |
| 2026-06-01 | Closing price | 35.95000076293945 |
| 2026-06-02 | Closing price | 36.849998474121094 |
| 2026-06-03 | Closing price | 35.310001373291016 |
| 2026-06-04 | Closing price | 36.11000061035156 |
| 2026-06-05 | Closing price | 33.869998931884766 |
| 2026-06-08 | Closing price | 33.779998779296875 |
| 2026-06-09 | Closing price | 33.040000915527344 |
| 2026-06-10 | Closing price | 31.469999313354492 |
| 2026-06-11 | Closing price | 32.7400016784668 |
| 2026-06-12 | Closing price | 33.83000183105469 |
| 2026-06-15 | Closing price | 36.15999984741211 |
| 2026-06-16 | Closing price | 36.849998474121094 |
| 2026-06-17 | Closing price | 36.060001373291016 |
| 2026-06-18 | Closing price | 34.86000061035156 |
| 2026-06-22 | Closing price | 33.88999938964844 |
| 2026-06-23 | Closing price | 32.20000076293945 |
| 2026-06-24 | Closing price | 31.40999984741211 |
| 2026-06-25 | Closing price | 31.459999084472656 |
| 2026-06-26 | Closing price | 32.25 |
| 2026-06-29 | Closing price | 31.979999542236328 |
| 2026-06-30 | Closing price | 31.6299991607666 |
| 2026-07-01 | Closing price | 31.399999618530273 |
| 2026-07-02 | Closing price | 31.440000534057617 |
| 2026-07-06 | Closing price | 30.809999465942383 |
| 2026-07-07 | Closing price | 30.110000610351562 |
| 2026-07-08 | Closing price | 29.229999542236328 |
| 2026-07-09 | Closing price | 29.75 |
| 2026-07-10 | Closing price | 29.280000686645508 |
| 2026-07-13 | Closing price | 28.729999542236328 |
| 2026-07-14 | Closing price | 28.899999618530273 |
| 2026-07-15 | Closing price | 28.799999237060547 |
| 2026-07-16 | Closing price | 28.049999237060547 |
| 2026-07-17 | Closing price | 28.299999237060547 |
| 2026-07-20 | Closing price | 28.059999465942383 |
| 2026-07-21 | Closing price | 29.219999313354492 |
| 2026-07-22 | Closing price | 29.489999771118164 |
| 2026-07-23 | Closing price | 29.049999237060547 |
| 2026-07-24 | Closing price | 29.200000762939453 |
| 2026-07-27 | Closing price | 29.540000915527344 |
| 2026-07-28 | Closing price | 29.440000534057617 |
| 2026-07-29 | Closing price | 29.489999771118164 |
| 2026-07-30 | Closing price | 30.690000534057617 |
| 2026-07-31 | Closing price | 29.760000228881836 |
| 2026-08-03 | Closing price | 30.43000030517578 |
| 2026-08-04 | Closing price | 30.760000228881836 |
| 2026-08-05 | Closing price | 32.2400016784668 |
| 2026-08-06 | Closing price | 32.150001525878906 |
| 2026-08-07 | Closing price | 33.08000183105469 |
| 2026-08-10 | Closing price | 33.7400016784668 |
| 2026-08-11 | Closing price | 33.689998626708984 |
| 2026-08-12 | Closing price | 33.709999084472656 |
| 2026-08-13 | Closing price | 32.810001373291016 |
| 2026-08-14 | Closing price | 33.36000061035156 |
| 2026-08-17 | Closing price | 33.33000183105469 |
| 2026-08-18 | Closing price | 32.310001373291016 |
| 2026-08-19 | Closing price | 34.900001525878906 |
| 2026-08-20 | Closing price | 35.290000915527344 |
| 2026-08-21 | Closing price | 36.09000015258789 |
| 2026-08-24 | Closing price | 37.4900016784668 |
| 2026-08-25 | Closing price | 38.91999816894531 |
| 2026-08-26 | Closing price | 38.43000030517578 |
| 2026-08-27 | Closing price | 38.63999938964844 |
| 2026-08-28 | Closing price | 37.400001525878906 |
| 2026-08-31 | Closing price | 36.959999084472656 |
| 2026-09-01 | Closing price | 35.59000015258789 |
| 2026-09-02 | Closing price | 36.810001373291016 |
| 2026-09-03 | Closing price | 37.68000030517578 |
| 2026-09-04 | Closing price | 37.310001373291016 |
| 2026-09-08 | Closing price | 36.90999984741211 |
| 2026-09-09 | Closing price | 37.150001525878906 |
| 2026-09-10 | Closing price | 35.84000015258789 |
| 2026-09-11 | Closing price | 36.029998779296875 |
| 2026-09-14 | Closing price | 35.52000045776367 |
| 2026-09-15 | Closing price | 35.58000183105469 |
| 2026-09-16 | Closing price | 35.470001220703125 |
| 2026-09-17 | Closing price | 36.9900016784668 |
| 2026-09-18 | Closing price | 36.7400016784668 |
| 2026-09-21 | Closing price | 36.11000061035156 |
| 2026-09-22 | Closing price | 37.54999923706055 |
| 2026-09-23 | Closing price | 36.06999969482422 |
| 2026-09-24 | Closing price | 35.7400016784668 |
| 2026-09-25 | Closing price | 35.779998779296875 |
| 2026-09-28 | Closing price | 34.279998779296875 |
| 2026-09-29 | Closing price | 34.34000015258789 |
| 2026-09-30 | Closing price | 34.34000015258789 |
| 2026-10-01 | Closing price | 33.97999954223633 |
| 2026-10-02 | Closing price | 34.470001220703125 |
| 2026-10-05 | Closing price | 34.459999084472656 |
| 2026-10-06 | Closing price | 34.470001220703125 |
| 2026-10-07 | Closing price | 33.91999816894531 |
| 2026-10-08 | Closing price | 34.18000030517578 |
| 2026-10-09 | Closing price | 34.84000015258789 |
| 2026-10-12 | Closing price | 34.68000030517578 |
| 2026-10-13 | Closing price | 34.52000045776367 |
| 2026-10-14 | Closing price | 33.36000061035156 |
| 2026-10-15 | Closing price | 35.15999984741211 |
| 2026-10-16 | Closing price | 35.54999923706055 |
| 2026-10-19 | Closing price | 34.79999923706055 |
| 2026-10-20 | Closing price | 34.779998779296875 |
| 2026-10-21 | Closing price | 34.810001373291016 |
| 2026-10-22 | Closing price | 33.33000183105469 |
| 2026-10-23 | Closing price | 32.849998474121094 |
| 2026-10-26 | Closing price | 33.400001525878906 |
| 2026-10-27 | Closing price | 34.099998474121094 |
| 2026-10-28 | Closing price | 34.0 |
| 2026-10-29 | Closing price | 33.310001373291016 |
| 2026-10-30 | Closing price | 31.829999923706055 |
| 2026-11-02 | Closing price | 32.790000915527344 |
| 2026-11-03 | Closing price | 32.16999816894531 |
| 2026-11-04 | Closing price | 34.5 |
| 2026-11-05 | Closing price | 35.209999084472656 |
| 2026-11-06 | Closing price | 36.220001220703125 |
| 2026-11-09 | Closing price | 37.81999969482422 |
| 2026-11-10 | Closing price | 36.40999984741211 |
| 2026-11-11 | Closing price | 35.599998474121094 |
EV/EBITDA of 18.6 is 37% below its own three-year average of 29.7, yet the portal model still shows the share 51% overvalued
On a trailing twelve-month EV/EBITDA of 18.6 the share trades 37% below its own three-year average of 29.7. That looks like a discount, but it is deceptive: the last twelve months' earnings were made at high gold prices, while spot is already 8.3% below the reported-period average. At current prices EV/EBITDA is 22.1, so the discount to history almost disappears.
The portal model re-prices EBITDA to current commodity prices at a target multiple. With EBITDA of 311.2 million and a market capitalisation of 6,733.8 million, the upside to fair value is minus 51%. This is our own estimate, not a market consensus.
The trailing twelve-month P/E is 23.4 and ROE is 14.8%. For a company growing revenue by a multiple, these figures do not look cheap. The main argument against is not the multiple itself but that it is calculated on peak gold prices.
Valuation on the latest reported figures
| Metric | Value |
|---|---|
| Market cap | 6.73 bn USD |
| P/E (LTM) | 23.4 |
| EV/EBITDA (LTM) | 18.6 |
| P/B | 5.40 |
| Net debt / EBITDA (LTM) | 0.41 |
| Operating cash flow (LTM) | 0.35 bn |
| ROE | 14.8% |
| Dividend yield (12m) | 0.5% |
| EV/EBITDA, 3-year average | 29.7 |
Net profit by quarter
| Period | Measure | bn USD |
|---|---|---|
| Q4 2024 | Net profit | 0.007325999999999998 |
| Q1 2025 | Net profit | 0.02564 |
| Q2 2025 | Net profit | 0.023157 |
| Q3 2025 | Net profit | 0.059287999999999993 |
| Q4 2025 | Net profit | 0.098003 |
| Q1 2026 | Net profit | 0.073582 |
| Q2 2026 | Net profit | 0.061392 |
| Q3 2026 | Net profit | 0.055367 |
Bottom line
What was genuinely strong in the report was everything tied to price: gold rose 23.4% year on year, revenue grew 76.0%, operating cash flow was 77.6 million and leverage remains low at 0.41 times EBITDA. But part of the increase was one-off receipts: our calculation attributes only 12.0 million of the 27.0 million gap to the year-ago period to price. The real question for a holder is whether profit holds once the price effect fades: spot is already 8.3% below the quarterly average, and the portal model shows the share 51% overvalued. Our conclusion: the share is unattractive – the portal model puts the upside to fair value at minus 51%. Our view: the share is unattractive at the current price; upside on the portal model -51%.