Pan American Silver: silver up 58% but EBITDA came in 36% below what the price implied
Contents

On 11 November Pan American Silver reported results for the third quarter of 2026. The average silver price in the period was 62.8 USD against 39.9 USD a year earlier (+57.6%), and gold rose 23.4% to 4268 USD. Revenue grew 17.7% to 1006.0 million USD, EBITDA by 27.1% to 466.0 million USD and net profit by 111.7% to 357.0 million USD. At the year-ago volumes and costs and current prices, our calculation puts revenue at 1215.1 million USD and EBITDA at 727.0 million USD; the EBITDA shortfall is 261.0 million USD, or 35.9%. Our conclusion: rather unattractive – on the portal's model the upside to fair value is minus 39%. Our view: the share is rather unattractive at the current price; upside on the portal model -39%.
Our view: is there upside
Our view in numbers
| Metric | Our read |
|---|---|
| Verdict | Rather unattractive |
| Upside on the portal model | -39% |
| How the model works | spot model: EBITDA re-priced to current commodity prices at the target EV/EBITDA, against market cap |
| EV/EBITDA now and 3-year average | 6.4 vs 9.1 – a 30% discount to its history |
| Dividend yield, 12m | 1.4% |
| Net debt / EBITDA | -0.34 – net cash |
| Strongest case for | EV/EBITDA of 6.4 is 30% below the three-year average of 9.1, and net cash of 790.0 million USD with operating cash flow of 377.0 million USD gives balance-sheet headroom. |
| Strongest case against | At today's silver price of 52.3 USD annual EBITDA falls to 1400.1 million USD – minus 38.4% against the last twelve months – and EV/EBITDA rises to 10.3. |
| What would change the view | A return of silver to 62.8 USD or growth in sales volumes would move the verdict one step up towards neutral; a fall below 52.3 USD would move it one step down. |
Key takeaways
— Silver averaged 62.8 USD in the quarter – 57.6% above a year earlier but already 14.1% below the previous quarter
— Our calculation says prices implied EBITDA of 727.0 million USD, while the company earned 466.0 million – a gap of 261.0 million USD
— Revenue rose only 17.7% with prices 42.2% higher – so less metal was sold
— The EBITDA margin rose to 46.3% from 42.9%, but at these prices it should have been materially higher
— Net cash of 790.0 million USD and operating cash flow of 377.0 million USD cover capital expenditure of 120.0 million USD with room to spare
— At EV/EBITDA of 6.4 the share trades 30% below its own three-year average of 9.1, but those are earnings made at past prices
— The portal's spot model at today's prices gives annual EBITDA of 1400.1 million USD against 2274 million for the last twelve months – minus 38.4%
Key figures, USD bn
| Metric | Q3 2025 | Q3 2026 | Change |
|---|---|---|---|
| Revenue | 0.85 | 1.01 | +17.7% |
| EBITDA | 0.37 | 0.47 | +27.1% |
| Operating profit | 0.25 | 0.35 | +38.6% |
| Net profit | 0.17 | 0.36 | +111.7% |
| Operating cash flow | 0.31 | 0.38 | +22.1% |
| Capex | 0.09 | 0.12 | +31.7% |
| EBITDA margin | 42.9% | 46.3% | +3.4 pp |
| Net margin | 19.7% | 35.5% | +15.8 pp |
Silver averaged 62.8 USD in the quarter – 57.6% above a year earlier but already 14.1% below the previous quarter
Silver accounts for 55% of Pan American Silver's sales, so its price drives revenue and profit more than any other factor. In the third quarter of 2026 the metal averaged 62.8 USD an ounce against 39.9 USD a year earlier – a rise of 57.6%. Gold, which accounts for 45% of sales, rose 23.4% to 4268 USD.
Against the previous quarter both metals fell: silver by 14.1% from 73.1 USD, gold by 5.5% from 4514 USD. On 11 November 2026 silver trades at 52.3 USD, 16.8% below the reported-period average, and gold at 4045 USD, 5.2% below. For a producer this means the next report's revenue and EBITDA will be measured from a lower base.
Commodity prices: period average and now
| Benchmark | Year ago | Q3 2026 | YoY | Spot 2026-11-11 |
|---|---|---|---|---|
| Silver, USD | 39,9 | 62,8 | +57,6% | 52,3 |
| Gold, USD | 3 459 | 4 268 | +23,4% | 4 045 |
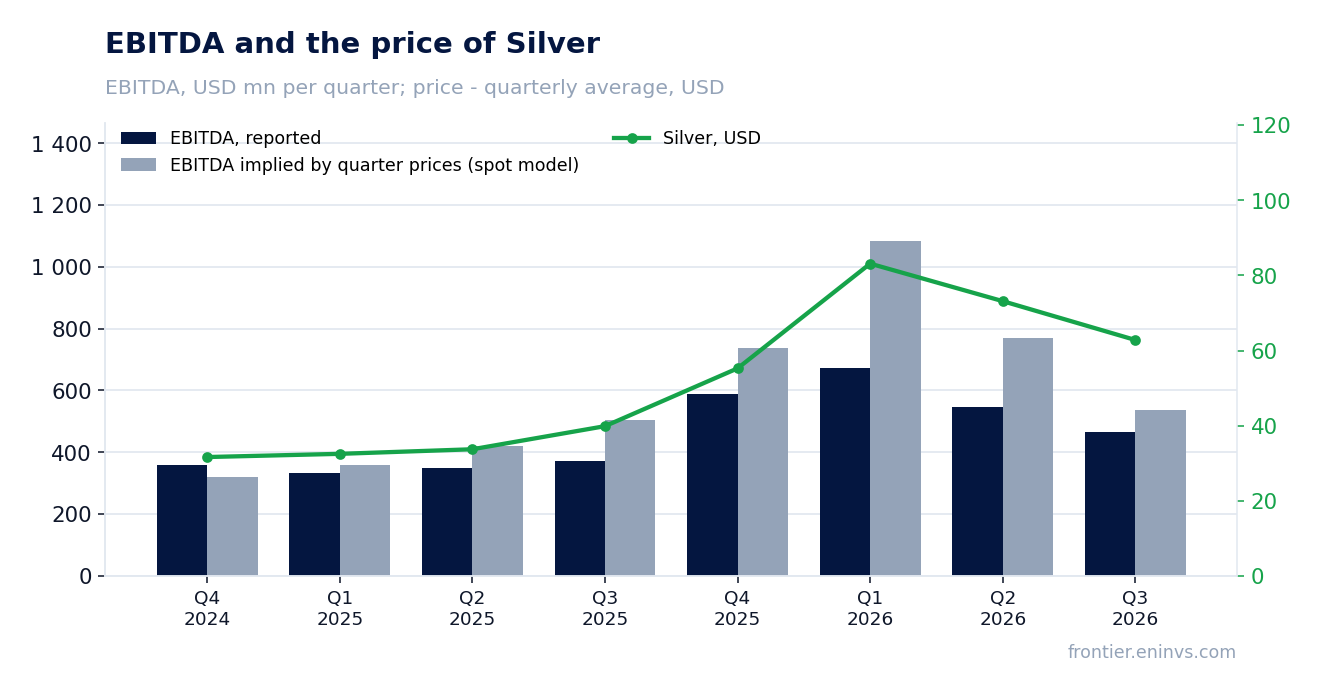
Our calculation says prices implied EBITDA of 727.0 million USD, while the company earned 466.0 million – a gap of 261.0 million USD
Taking the sales volumes and non-commodity costs of the third quarter of 2025 and substituting only current prices gives revenue of 1215.1 million USD and EBITDA of 727.0 million USD. The company actually reported 1006.0 million USD of revenue and 466.0 million USD of EBITDA. The revenue gap is 209.1 million USD, or 17.2%, and the EBITDA gap 261.0 million USD, or 35.9%.
The portal's spot model, which re-prices the average volumes of the previous four quarters at the reported period's prices, expected EBITDA of 538.2 million USD and revenue of 1086 million USD. The actual result is 13.4% below the model on EBITDA and 7.4% below on revenue. In the four preceding periods the deviation was even larger – between 20.3% and 38.0% – so the model systematically overstates the company's result.
The gap is explained by volumes and by the realised price relative to the benchmark: with prices 42.2% higher, revenue grew only 17.7%. The facts give no other causes – no hedges or one-offs inside EBITDA – so we go no further than that.
What the prices implied and what the company earned
| Base (Q3 2025) | Implied at period prices | Reported | Reported vs implied | |
|---|---|---|---|---|
| Revenue, USD mn | 854,6 | 1 215 | 1 006 | -17,2% |
| EBITDA, USD mn | 366,5 | 727,0 | 466,0 | -35,9% |
| EBITDA, portal spot model, USD mn | — | 538,2 | 466,0 | -13,4% |
Revenue and EBITDA by quarter
| Period | Measure | bn USD |
|---|---|---|
| Q4 2024 | Revenue | 0.8152 |
| Q1 2025 | Revenue | 0.773 |
| Q2 2025 | Revenue | 0.8119 |
| Q3 2025 | Revenue | 0.8546 |
| Q4 2025 | Revenue | 1.1793 |
| Q1 2026 | Revenue | 1.154 |
| Q2 2026 | Revenue | 1.124 |
| Q3 2026 | Revenue | 1.006 |
| Q4 2024 | EBITDA | 0.3588 |
| Q1 2025 | EBITDA | 0.333 |
| Q2 2025 | EBITDA | 0.3506 |
| Q3 2025 | EBITDA | 0.3708 |
| Q4 2025 | EBITDA | 0.588 |
| Q1 2026 | EBITDA | 0.673 |
| Q2 2026 | EBITDA | 0.547 |
| Q3 2026 | EBITDA | 0.466 |
EBITDA margin
| Period | Measure | % |
|---|---|---|
| Q4 2024 | EBITDA margin | 44.0 |
| Q1 2025 | EBITDA margin | 43.1 |
| Q2 2025 | EBITDA margin | 43.2 |
| Q3 2025 | EBITDA margin | 43.4 |
| Q4 2025 | EBITDA margin | 49.9 |
| Q1 2026 | EBITDA margin | 58.3 |
| Q2 2026 | EBITDA margin | 48.7 |
| Q3 2026 | EBITDA margin | 46.3 |
Revenue rose only 17.7% with prices 42.2% higher – so less metal was sold
Revenue in the third quarter of 2026 was 1006.0 million USD against 854.6 million USD a year earlier, up 17.7%. That is markedly slower than the previous quarter's 38.4% growth: the deceleration reflects both a smaller year-on-year price gain and lower sales volumes.
Our calculation puts the price effect at 42.2% of revenue growth. The actual 17.7% means the volume of metal sold fell year on year. By how much and why the facts do not disclose; the company's report names no cause, so we record the fact of the decline rather than its source.
Against the previous quarter revenue fell from 1124.0 million USD to 1006.0 million USD. On our calculation prices alone would have produced 1009 million USD, so the actual result almost matched the price-implied one – minus 0.3%. Volumes and costs were therefore little changed quarter on quarter, and the entire revenue decline is explained by prices.
The EBITDA margin rose to 46.3% from 42.9%, but at these prices it should have been materially higher
EBITDA in the third quarter of 2026 was 466.0 million USD against 370.8 million USD a year earlier, up 27.1%. The EBITDA margin rose to 46.3% from 42.9%. Operating profit was 347.0 million USD and depreciation 119 million USD.
The margin gain looks modest at these prices: our calculation puts the price effect at 261.0 million USD above the actual EBITDA. In other words, higher silver and gold prices lifted the margin, but not by as much as unchanged volumes and costs would have allowed. The cause is less metal sold and, judging by the gap, a higher unit cost; the facts give no precise cash cost or AISC figures.
Net profit rose 111.7% to 357.0 million USD and the net margin to 35.5% from 19.7%. Profit grows faster than EBITDA because some items – other income, interest, FX – sit below operating profit and are not in EBITDA. Which item produced the jump the facts do not disclose.
Net cash of 790.0 million USD and operating cash flow of 377.0 million USD cover capital expenditure of 120.0 million USD with room to spare
At 30 September 2026 the company had net cash of 790.0 million USD: more cash than debt. Net debt to EBITDA for the last twelve months is minus 0.34 – a level, not a direction of change. Operating cash flow in the quarter was 377.0 million USD and capital expenditure 120.0 million USD, so investment is covered more than three times over by the flow.
Over the last twelve months operating cash flow was 1758.1 million USD against EBITDA of 2340.4 million USD. The 582.3 million USD difference is taxes, interest and working-capital movements. Capital expenditure over the same period, summed from the quarterly figures, is 418.4 million USD, so free cash flow remains substantial.
The trailing twelve-month dividend yield is 1.36%. With net cash and a flow that covers investment, the payout puts no strain on the balance sheet. But for a mining company the dividend is a derivative of the metal price, and with silver at 52.3 USD the base for payouts will be lower than in the reported quarter.
Valuation vs its own history
now vs the 3-year average
| Period | Measure | × |
|---|---|---|
| EV/EBITDA | Now | 6.359511981254517 |
| EV/EBITDA | 3-year average | 9.07573381412145 |
At EV/EBITDA of 6.4 the share trades 30% below its own three-year average of 9.1, but those are earnings made at past prices
EV/EBITDA for the last twelve months is 6.4 against a three-year average of 9.1, a 30% discount. P/E for the same period is 9.7 and return on equity 19.4%. At first glance the share is cheaper than its own history, and that is the only argument in its favour.
The last twelve months, however, include quarters with higher silver prices than today. The portal's spot model at current prices gives annual EBITDA of 1400.1 million USD against 2274 million for the last twelve months – a fall of 38.4%. On that base EV/EBITDA is already 10.3, not 6.4, and the discount to history disappears.
That figure – 10.3 – is what decides the valuation. On the portal's model fair value is 39% below the current market price. The discrepancy with the multiple is explained by the market still looking at the profit of past quarters rather than the profit the company will earn at today's prices.
Share price, three years
close, last point 2026-11-10
| Period | Measure | USD per share |
|---|---|---|
| 2025-11-10 | Closing price | 37.400001525878906 |
| 2025-11-11 | Closing price | 37.59000015258789 |
| 2025-11-12 | Closing price | 38.369998931884766 |
| 2025-11-13 | Closing price | 39.04999923706055 |
| 2025-11-14 | Closing price | 38.5099983215332 |
| 2025-11-17 | Closing price | 37.38999938964844 |
| 2025-11-18 | Closing price | 38.06999969482422 |
| 2025-11-19 | Closing price | 39.04999923706055 |
| 2025-11-20 | Closing price | 36.47999954223633 |
| 2025-11-21 | Closing price | 36.7400016784668 |
| 2025-11-24 | Closing price | 38.9900016784668 |
| 2025-11-25 | Closing price | 39.4900016784668 |
| 2025-11-26 | Closing price | 42.59000015258789 |
| 2025-11-28 | Closing price | 45.66999816894531 |
| 2025-12-01 | Closing price | 46.08000183105469 |
| 2025-12-02 | Closing price | 44.849998474121094 |
| 2025-12-03 | Closing price | 44.439998626708984 |
| 2025-12-04 | Closing price | 44.20000076293945 |
| 2025-12-05 | Closing price | 44.38999938964844 |
| 2025-12-08 | Closing price | 43.54999923706055 |
| 2025-12-09 | Closing price | 48.40999984741211 |
| 2025-12-10 | Closing price | 48.65999984741211 |
| 2025-12-11 | Closing price | 50.349998474121094 |
| 2025-12-12 | Closing price | 49.72999954223633 |
| 2025-12-15 | Closing price | 49.34000015258789 |
| 2025-12-16 | Closing price | 49.2599983215332 |
| 2025-12-17 | Closing price | 50.0 |
| 2025-12-18 | Closing price | 50.04999923706055 |
| 2025-12-19 | Closing price | 51.77000045776367 |
| 2025-12-22 | Closing price | 53.7400016784668 |
| 2025-12-23 | Closing price | 53.84000015258789 |
| 2025-12-24 | Closing price | 53.83000183105469 |
| 2025-12-26 | Closing price | 55.38999938964844 |
| 2025-12-29 | Closing price | 52.2400016784668 |
| 2025-12-30 | Closing price | 52.689998626708984 |
| 2025-12-31 | Closing price | 51.810001373291016 |
| 2026-01-02 | Closing price | 51.040000915527344 |
| 2026-01-05 | Closing price | 53.130001068115234 |
| 2026-01-06 | Closing price | 55.5099983215332 |
| 2026-01-07 | Closing price | 53.349998474121094 |
| 2026-01-08 | Closing price | 53.09000015258789 |
| 2026-01-09 | Closing price | 54.27000045776367 |
| 2026-01-12 | Closing price | 55.720001220703125 |
| 2026-01-13 | Closing price | 55.93000030517578 |
| 2026-01-14 | Closing price | 56.11000061035156 |
| 2026-01-15 | Closing price | 55.880001068115234 |
| 2026-01-16 | Closing price | 55.20000076293945 |
| 2026-01-20 | Closing price | 58.619998931884766 |
| 2026-01-21 | Closing price | 57.209999084472656 |
| 2026-01-22 | Closing price | 61.720001220703125 |
| 2026-01-23 | Closing price | 64.5 |
| 2026-01-26 | Closing price | 64.81999969482422 |
| 2026-01-27 | Closing price | 64.30999755859375 |
| 2026-01-28 | Closing price | 65.91999816894531 |
| 2026-01-29 | Closing price | 63.290000915527344 |
| 2026-01-30 | Closing price | 54.599998474121094 |
| 2026-02-02 | Closing price | 53.630001068115234 |
| 2026-02-03 | Closing price | 56.66999816894531 |
| 2026-02-04 | Closing price | 57.5099983215332 |
| 2026-02-05 | Closing price | 52.40999984741211 |
| 2026-02-06 | Closing price | 55.209999084472656 |
| 2026-02-09 | Closing price | 58.970001220703125 |
| 2026-02-10 | Closing price | 59.290000915527344 |
| 2026-02-11 | Closing price | 59.880001068115234 |
| 2026-02-12 | Closing price | 54.59000015258789 |
| 2026-02-13 | Closing price | 57.93000030517578 |
| 2026-02-17 | Closing price | 56.09000015258789 |
| 2026-02-18 | Closing price | 58.0099983215332 |
| 2026-02-19 | Closing price | 61.209999084472656 |
| 2026-02-20 | Closing price | 64.69999694824219 |
| 2026-02-23 | Closing price | 65.18000030517578 |
| 2026-02-24 | Closing price | 65.36000061035156 |
| 2026-02-25 | Closing price | 64.30000305175781 |
| 2026-02-26 | Closing price | 67.51000213623047 |
| 2026-02-27 | Closing price | 68.69999694824219 |
| 2026-03-02 | Closing price | 67.0199966430664 |
| 2026-03-03 | Closing price | 61.59000015258789 |
| 2026-03-04 | Closing price | 61.849998474121094 |
| 2026-03-05 | Closing price | 59.95000076293945 |
| 2026-03-06 | Closing price | 59.560001373291016 |
| 2026-03-09 | Closing price | 60.560001373291016 |
| 2026-03-10 | Closing price | 61.5099983215332 |
| 2026-03-11 | Closing price | 60.83000183105469 |
| 2026-03-12 | Closing price | 60.06999969482422 |
| 2026-03-13 | Closing price | 56.119998931884766 |
| 2026-03-16 | Closing price | 56.40999984741211 |
| 2026-03-17 | Closing price | 55.810001373291016 |
| 2026-03-18 | Closing price | 51.790000915527344 |
| 2026-03-19 | Closing price | 48.34000015258789 |
| 2026-03-20 | Closing price | 46.65999984741211 |
| 2026-03-23 | Closing price | 49.13999938964844 |
| 2026-03-24 | Closing price | 49.869998931884766 |
| 2026-03-25 | Closing price | 51.459999084472656 |
| 2026-03-26 | Closing price | 49.650001525878906 |
| 2026-03-27 | Closing price | 51.70000076293945 |
| 2026-03-30 | Closing price | 51.15999984741211 |
| 2026-03-31 | Closing price | 54.630001068115234 |
| 2026-04-01 | Closing price | 55.58000183105469 |
| 2026-04-02 | Closing price | 55.77000045776367 |
| 2026-04-06 | Closing price | 55.959999084472656 |
| 2026-04-07 | Closing price | 56.20000076293945 |
| 2026-04-08 | Closing price | 57.369998931884766 |
| 2026-04-09 | Closing price | 56.849998474121094 |
| 2026-04-10 | Closing price | 57.63999938964844 |
| 2026-04-13 | Closing price | 57.27000045776367 |
| 2026-04-14 | Closing price | 58.119998931884766 |
| 2026-04-15 | Closing price | 57.34000015258789 |
| 2026-04-16 | Closing price | 56.5099983215332 |
| 2026-04-17 | Closing price | 59.060001373291016 |
| 2026-04-20 | Closing price | 58.70000076293945 |
| 2026-04-21 | Closing price | 55.61000061035156 |
| 2026-04-22 | Closing price | 56.459999084472656 |
| 2026-04-23 | Closing price | 55.119998931884766 |
| 2026-04-24 | Closing price | 55.9900016784668 |
| 2026-04-27 | Closing price | 55.22999954223633 |
| 2026-04-28 | Closing price | 52.38999938964844 |
| 2026-04-29 | Closing price | 51.279998779296875 |
| 2026-04-30 | Closing price | 52.290000915527344 |
| 2026-05-01 | Closing price | 51.810001373291016 |
| 2026-05-04 | Closing price | 51.11000061035156 |
| 2026-05-05 | Closing price | 50.52000045776367 |
| 2026-05-06 | Closing price | 56.59000015258789 |
| 2026-05-07 | Closing price | 57.810001373291016 |
| 2026-05-08 | Closing price | 59.13999938964844 |
| 2026-05-11 | Closing price | 62.290000915527344 |
| 2026-05-12 | Closing price | 63.779998779296875 |
| 2026-05-13 | Closing price | 63.65999984741211 |
| 2026-05-14 | Closing price | 61.09000015258789 |
| 2026-05-15 | Closing price | 56.400001525878906 |
| 2026-05-18 | Closing price | 55.189998626708984 |
| 2026-05-19 | Closing price | 52.869998931884766 |
| 2026-05-20 | Closing price | 54.83000183105469 |
| 2026-05-21 | Closing price | 54.79999923706055 |
| 2026-05-22 | Closing price | 53.939998626708984 |
| 2026-05-26 | Closing price | 55.349998474121094 |
| 2026-05-27 | Closing price | 53.31999969482422 |
| 2026-05-28 | Closing price | 55.15999984741211 |
| 2026-05-29 | Closing price | 56.9900016784668 |
| 2026-06-01 | Closing price | 55.5 |
| 2026-06-02 | Closing price | 55.20000076293945 |
| 2026-06-03 | Closing price | 52.59000015258789 |
| 2026-06-04 | Closing price | 53.04999923706055 |
| 2026-06-05 | Closing price | 47.58000183105469 |
| 2026-06-08 | Closing price | 47.279998779296875 |
| 2026-06-09 | Closing price | 46.130001068115234 |
| 2026-06-10 | Closing price | 44.16999816894531 |
| 2026-06-11 | Closing price | 46.529998779296875 |
| 2026-06-12 | Closing price | 48.13999938964844 |
| 2026-06-15 | Closing price | 50.970001220703125 |
| 2026-06-16 | Closing price | 51.91999816894531 |
| 2026-06-17 | Closing price | 50.459999084472656 |
| 2026-06-18 | Closing price | 49.0 |
| 2026-06-22 | Closing price | 48.90999984741211 |
| 2026-06-23 | Closing price | 46.220001220703125 |
| 2026-06-24 | Closing price | 44.38999938964844 |
| 2026-06-25 | Closing price | 44.9900016784668 |
| 2026-06-26 | Closing price | 45.45000076293945 |
| 2026-06-29 | Closing price | 44.66999816894531 |
| 2026-06-30 | Closing price | 44.790000915527344 |
| 2026-07-01 | Closing price | 44.33000183105469 |
| 2026-07-02 | Closing price | 46.290000915527344 |
| 2026-07-06 | Closing price | 45.02000045776367 |
| 2026-07-07 | Closing price | 44.15999984741211 |
| 2026-07-08 | Closing price | 42.599998474121094 |
| 2026-07-09 | Closing price | 44.119998931884766 |
| 2026-07-10 | Closing price | 43.66999816894531 |
| 2026-07-13 | Closing price | 42.70000076293945 |
| 2026-07-14 | Closing price | 43.5099983215332 |
| 2026-07-15 | Closing price | 43.56999969482422 |
| 2026-07-16 | Closing price | 41.97999954223633 |
| 2026-07-17 | Closing price | 41.77000045776367 |
| 2026-07-20 | Closing price | 42.189998626708984 |
| 2026-07-21 | Closing price | 44.43000030517578 |
| 2026-07-22 | Closing price | 45.290000915527344 |
| 2026-07-23 | Closing price | 44.189998626708984 |
| 2026-07-24 | Closing price | 44.029998779296875 |
| 2026-07-27 | Closing price | 44.130001068115234 |
| 2026-07-28 | Closing price | 43.22999954223633 |
| 2026-07-29 | Closing price | 42.54999923706055 |
| 2026-07-30 | Closing price | 44.029998779296875 |
| 2026-07-31 | Closing price | 43.11000061035156 |
| 2026-08-03 | Closing price | 43.72999954223633 |
| 2026-08-04 | Closing price | 44.90999984741211 |
| 2026-08-05 | Closing price | 48.2400016784668 |
| 2026-08-06 | Closing price | 48.04999923706055 |
| 2026-08-07 | Closing price | 51.220001220703125 |
| 2026-08-10 | Closing price | 51.79999923706055 |
| 2026-08-11 | Closing price | 51.790000915527344 |
| 2026-08-12 | Closing price | 52.380001068115234 |
| 2026-08-13 | Closing price | 47.29999923706055 |
| 2026-08-14 | Closing price | 47.41999816894531 |
| 2026-08-17 | Closing price | 48.11000061035156 |
| 2026-08-18 | Closing price | 46.599998474121094 |
| 2026-08-19 | Closing price | 50.29999923706055 |
| 2026-08-20 | Closing price | 51.91999816894531 |
| 2026-08-21 | Closing price | 53.06999969482422 |
| 2026-08-24 | Closing price | 53.630001068115234 |
| 2026-08-25 | Closing price | 54.209999084472656 |
| 2026-08-26 | Closing price | 52.630001068115234 |
| 2026-08-27 | Closing price | 54.88999938964844 |
| 2026-08-28 | Closing price | 52.869998931884766 |
| 2026-08-31 | Closing price | 51.91999816894531 |
| 2026-09-01 | Closing price | 50.0 |
| 2026-09-02 | Closing price | 51.540000915527344 |
| 2026-09-03 | Closing price | 52.599998474121094 |
| 2026-09-04 | Closing price | 51.34000015258789 |
| 2026-09-08 | Closing price | 51.0 |
| 2026-09-09 | Closing price | 52.900001525878906 |
| 2026-09-10 | Closing price | 50.650001525878906 |
| 2026-09-11 | Closing price | 50.34000015258789 |
| 2026-09-14 | Closing price | 48.63999938964844 |
| 2026-09-15 | Closing price | 48.41999816894531 |
| 2026-09-16 | Closing price | 47.560001373291016 |
| 2026-09-17 | Closing price | 49.619998931884766 |
| 2026-09-18 | Closing price | 49.9900016784668 |
| 2026-09-21 | Closing price | 48.75 |
| 2026-09-22 | Closing price | 50.849998474121094 |
| 2026-09-23 | Closing price | 48.11000061035156 |
| 2026-09-24 | Closing price | 47.5099983215332 |
| 2026-09-25 | Closing price | 48.040000915527344 |
| 2026-09-28 | Closing price | 45.77000045776367 |
| 2026-09-29 | Closing price | 46.13999938964844 |
| 2026-09-30 | Closing price | 45.5099983215332 |
| 2026-10-01 | Closing price | 44.97999954223633 |
| 2026-10-02 | Closing price | 45.5099983215332 |
| 2026-10-05 | Closing price | 45.31999969482422 |
| 2026-10-06 | Closing price | 45.91999816894531 |
| 2026-10-07 | Closing price | 44.349998474121094 |
| 2026-10-08 | Closing price | 45.310001373291016 |
| 2026-10-09 | Closing price | 46.27000045776367 |
| 2026-10-12 | Closing price | 45.709999084472656 |
| 2026-10-13 | Closing price | 44.529998779296875 |
| 2026-10-14 | Closing price | 42.33000183105469 |
| 2026-10-15 | Closing price | 43.77000045776367 |
| 2026-10-16 | Closing price | 44.209999084472656 |
| 2026-10-19 | Closing price | 44.43000030517578 |
| 2026-10-20 | Closing price | 44.290000915527344 |
| 2026-10-21 | Closing price | 43.650001525878906 |
| 2026-10-22 | Closing price | 41.06999969482422 |
| 2026-10-23 | Closing price | 40.150001525878906 |
| 2026-10-26 | Closing price | 40.31999969482422 |
| 2026-10-27 | Closing price | 41.65999984741211 |
| 2026-10-28 | Closing price | 41.95000076293945 |
| 2026-10-29 | Closing price | 40.75 |
| 2026-10-30 | Closing price | 37.97999954223633 |
| 2026-11-02 | Closing price | 38.91999816894531 |
| 2026-11-03 | Closing price | 38.290000915527344 |
| 2026-11-04 | Closing price | 41.4900016784668 |
| 2026-11-05 | Closing price | 40.58000183105469 |
| 2026-11-06 | Closing price | 41.16999816894531 |
| 2026-11-09 | Closing price | 42.36000061035156 |
| 2026-11-10 | Closing price | 39.97999954223633 |
The portal's spot model at today's prices gives annual EBITDA of 1400.1 million USD against 2274 million for the last twelve months – minus 38.4%
On 11 November silver trades at 52.3 USD, 16.8% below the reported quarter's average, and gold at 4045 USD, 5.2% below. If these prices hold, annual EBITDA will be 1400.1 million USD against 2274 million for the last twelve months. With net cash of 790.0 million USD, net debt to EBITDA on the new base is minus 0.56.
For a mining company this is the earnings base the valuation should start from: the last twelve months reflect prices that no longer exist. EV/EBITDA of 10.3 at current prices is no longer a cheap share but a company trading roughly at its three-year average of 9.1, slightly above it.
The main risk to the valuation is further movement in silver. If the metal returns to 62.8 USD, earnings and the multiple improve again; if it falls below 52.3 USD, the margin of safety disappears.
Valuation on the latest reported figures
| Metric | Value |
|---|---|
| Market cap | 15.3 bn USD |
| P/E (LTM) | 9.7 |
| EV/EBITDA (LTM) | 6.4 |
| P/B | 2.18 |
| Net debt / EBITDA (LTM) | -0.34 |
| Operating cash flow (LTM) | 1.76 bn |
| ROE | 19.4% |
| Dividend yield (12m) | 1.4% |
| EV/EBITDA, 3-year average | 9.1 |
Net profit by quarter
| Period | Measure | bn USD |
|---|---|---|
| Q4 2024 | Net profit | 0.10809999999999999 |
| Q1 2025 | Net profit | 0.169 |
| Q2 2025 | Net profit | 0.18919999999999998 |
| Q3 2025 | Net profit | 0.1686 |
| Q4 2025 | Net profit | 0.4515 |
| Q1 2026 | Net profit | 0.457 |
| Q2 2026 | Net profit | 0.304 |
| Q3 2026 | Net profit | 0.357 |
Bottom line
The balance sheet remains the strong point: net cash of 790.0 million USD and operating cash flow of 377.0 million USD against capital expenditure of 120.0 million USD. The 46.3% EBITDA margin and 111.7% net profit growth look impressive, but they were earned at prices that no longer exist: silver is already 16.8% lower. Our calculation says prices implied EBITDA of 727.0 million USD while the company earned 466.0 million – the 261.0 million USD gap is explained by lower sales volumes and a higher unit cost. Our conclusion: rather unattractive – on the portal's model the upside to fair value is minus 39%. Our view: the share is rather unattractive at the current price; upside on the portal model -39%.