Par Pacific: revenue up 51.6% but margin compressed while net debt nearly vanished
On 4 November Par Pacific released its third-quarter 2026 results. Revenue reached USD 3,052.4 mn, up 51.6% year on year, EBITDA came in at USD 511.2 mn (+29.5%) and net profit at USD 353.3 mn (+34.5%). The EBITDA margin compressed to 16.7% from 19.6% a year earlier, while net debt at quarter-end stood at just USD 0.1 bn versus 1.3 bn a year ago. At an EV/EBITDA of 2.5 against its own three-year average of 3.7 the share looks cheap, and the verdict is rather attractive.
Key takeaways
— Revenue rose 51.6% but growth decelerated from 56.8% in the second quarter
— EBITDA grew 29.5% yet the margin compressed to 16.7% from 19.6% a year earlier
— Net profit rose 34.5% while the net margin fell to 11.6% from 13.0%
— Free cash flow strengthened: operating cash flow of USD 838.9 mn against capex of just 37.4 mn
— Net debt fell from USD 1.3 bn on 30 September 2025 to 0.1 bn on 30 September 2026
— The EV/EBITDA multiple of 2.5 is 32% below its own three-year average of 3.7
— The portal model implies only +1% upside to the share price
Attractiveness
Key figures, USD bn
| Metric | Q3 2025 | Q3 2026 | Change |
|---|---|---|---|
| Revenue | 2.01 | 3.05 | +51.6% |
| EBITDA | 0.39 | 0.51 | +29.5% |
| Operating profit | 0.36 | 0.47 | +31.7% |
| Net profit | 0.26 | 0.35 | +34.5% |
| Operating cash flow | 0.22 | 0.84 | +282.4% |
| Capex | 0.03 | 0.04 | +15.9% |
| EBITDA margin | 19.6% | 16.7% | -2.9 pp |
| Net margin | 13.0% | 11.6% | -1.4 pp |
Revenue rose 51.6% but growth decelerated from 56.8% in the second quarter
In the third quarter of 2026 Par Pacific's revenue reached USD 3,052.4 mn, up 51.6% year on year. This is the second consecutive quarter of double-digit growth after 56.8% in the second quarter, but the pace decelerated: growth of 51.6% is slower than the previous quarter.
The deceleration does not change the picture: the company has now posted revenue above USD 3 bn for two quarters in a row, whereas in the first quarter of 2026 it was USD 1,823.8 mn. Year-on-year revenue growth accelerated from 4.5% in the first quarter to 56.8% in the second and 51.6% in the third.
For an investor what matters more than growth itself is that it comes with margin compression. Revenue is growing faster than EBITDA, which means each additional unit of sales brings less profit than before.
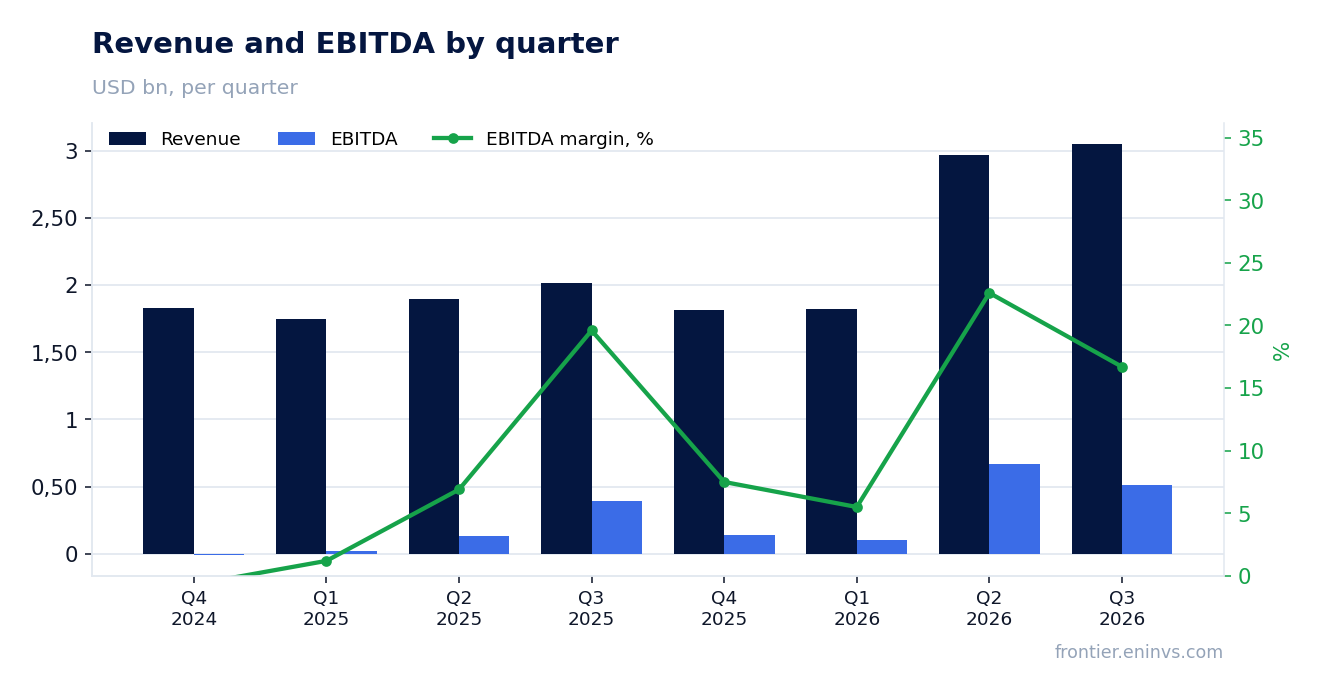
EBITDA grew 29.5% yet the margin compressed to 16.7% from 19.6% a year earlier
EBITDA for the third quarter of 2026 came in at USD 511.2 mn, up 29.5% year on year. At the same time the EBITDA margin fell to 16.7% from 19.6% in the third quarter of 2025.
The gap between revenue growth and EBITDA growth explains the margin compression: revenue added 51.6% while EBITDA added only 29.5%. This means costs grew faster than revenue, and operating leverage worked in reverse.
Operating profit for the quarter was USD 472.1 mn, which also points to pressure on costs. The company is scaling volumes but efficiency is falling, and that is the main question for the report.
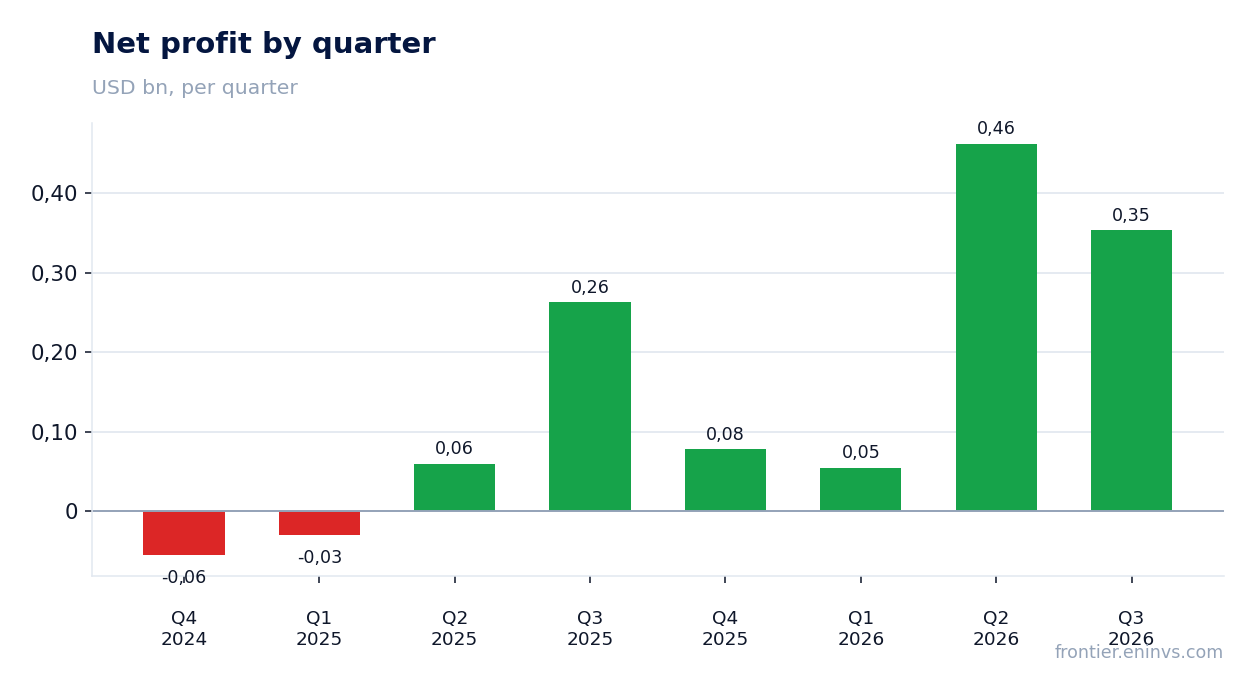
Net profit rose 34.5% while the net margin fell to 11.6% from 13.0%
Net profit for the third quarter of 2026 was USD 353.3 mn, up 34.5% year on year. The net margin fell to 11.6% from 13.0% in the third quarter of 2025.
The decline in profitability is consistent with the EBITDA dynamics: pressure on costs at the operating level carries through to net profit. At the same time the absolute growth in profit remains significant.
Over the trailing twelve months net profit was USD 947.6 mn on revenue of USD 9,700.0 mn and EBITDA of USD 1,800.8 mn. These figures describe the annual period, not a single quarter, and cannot be directly compared with quarterly growth rates.
Free cash flow strengthened: operating cash flow of USD 838.9 mn against capex of just 37.4 mn
Operating cash flow for the third quarter of 2026 was USD 838.9 mn, while capital expenditures were just USD 37.4 mn. This means free cash flow for the quarter exceeded USD 800 mn.
This ratio of cash flow to capex indicates that the company is not burdened by a large investment programme. The low level of capital expenditure allows almost the entire operating cash flow to be directed towards debt reduction.
Over the trailing twelve months operating cash flow was USD 1,174.6 mn. This is a steady ability to generate cash, which is what allowed the company to radically reduce its debt burden.
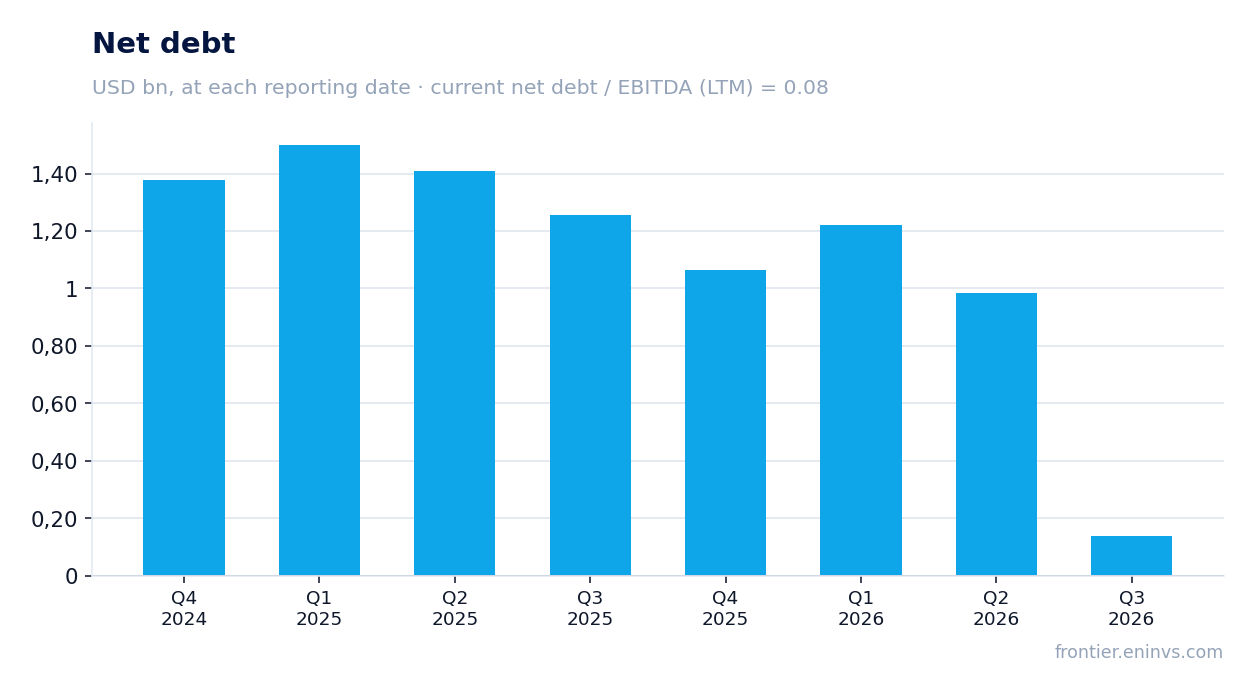
Net debt fell from USD 1.3 bn on 30 September 2025 to 0.1 bn on 30 September 2026
Net debt on 30 September 2026 was USD 0.1 bn, compared with USD 1.3 bn on 30 September 2025. Over the year the figure fell by USD 1.1 bn. It also declined over the quarter from USD 1.0 bn on 30 June 2026 to 0.1 bn on 30 September.
The debt reduction came from strong operating cash flow with low capital expenditure. The ratio of net debt to EBITDA over the trailing twelve months is 0.08, meaning debt is practically absent.
Low leverage gives the company freedom of action, but at the same time it means the effect of financial leverage on profit is minimal. For a shareholder this is more of a defensive factor than a growth driver.
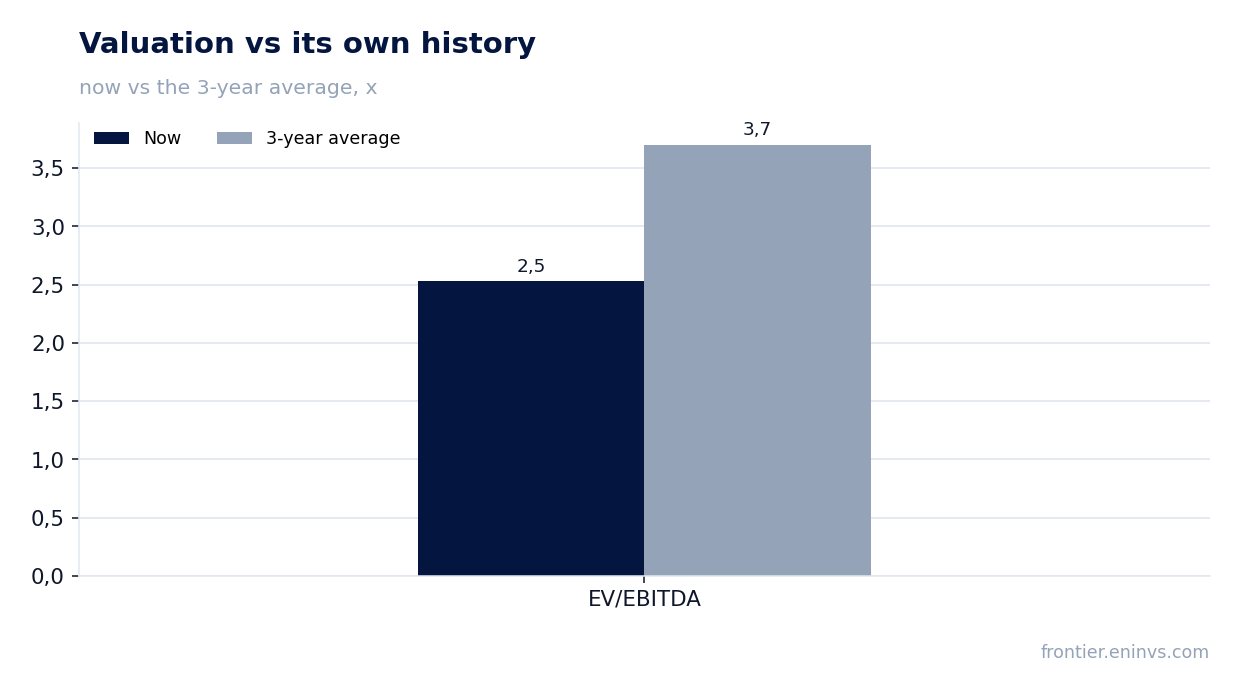
The EV/EBITDA multiple of 2.5 is 32% below its own three-year average of 3.7
The current EV/EBITDA multiple over the trailing twelve months is 2.5, while its own three-year average is 3.7. The share trades 32% below its historical valuation on this multiple.
The P/E multiple over the trailing twelve months is 3.6, which also points to a low valuation. Return on equity stands at 65.5%, reflecting high returns on capital with low leverage.
However, the low valuation may be a consequence of margin compression. If the market expects profitability to fall further, the current multiple does not necessarily mean undervaluation.
The portal model implies only +1% upside to the share price
According to the portal model, which re-prices EBITDA at current commodity prices at the target EV/EBITDA, the upside to the share's fair value is +1%. This is our own estimate, not a market consensus.
A near-zero upside means the current price is already close to fair value on our model. The main argument for the share is the low multiple relative to history, but it is offset by the risk of further margin compression.
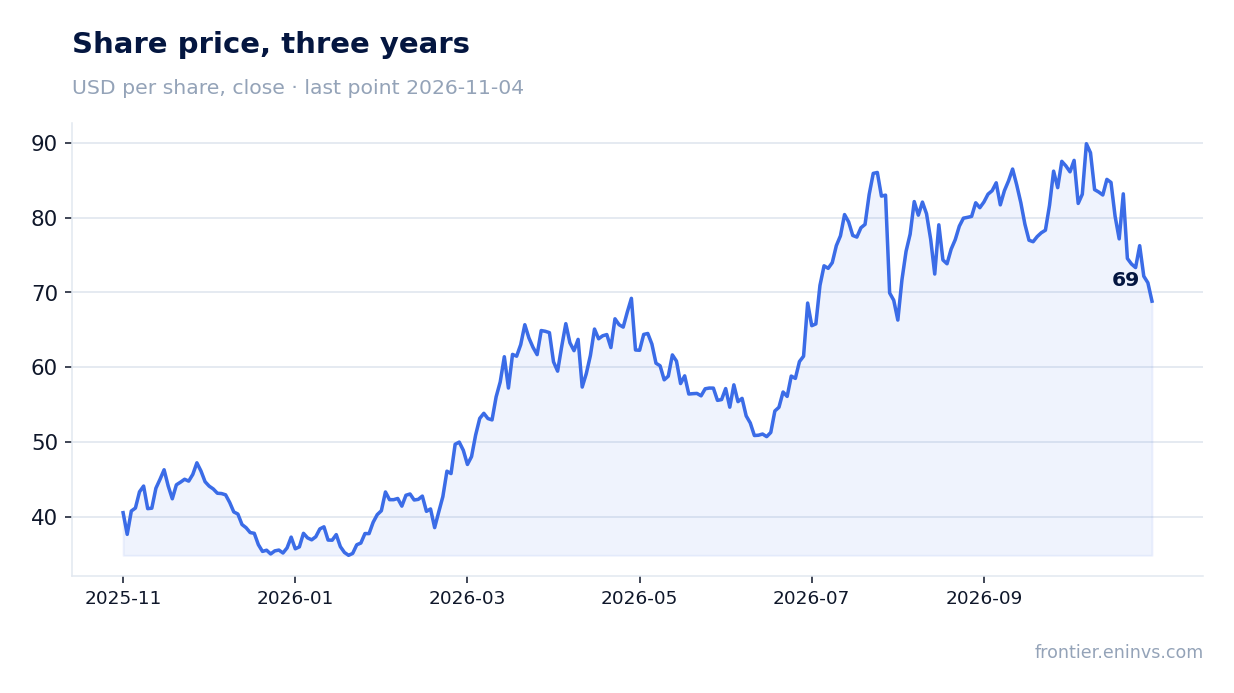
The share price at the close before the release was USD 71.28; on the release day it fell 3.5% and remained at that level by 4 November 2026. The market reacted to the report with restraint.
Valuation on the latest reported figures
| Metric | Value |
|---|---|
| Market cap | 3.45 bn USD |
| P/E (LTM) | 3.6 |
| EV/EBITDA (LTM) | 2.5 |
| P/B | 2.22 |
| Net debt / EBITDA (LTM) | 0.08 |
| Operating cash flow (LTM) | 1.17 bn |
| ROE | 65.5% |
| EV/EBITDA, 3-year average | 3.7 |
Bottom line
The strong side of the report is cash flow and debt: operating cash flow of USD 838.9 mn with capex of USD 37.4 mn allowed net debt to fall from USD 1.3 bn a year earlier to 0.1 bn. However, revenue growth of 51.6% comes with EBITDA margin compression to 16.7% from 19.6%, and that is the main question for a shareholder. The EV/EBITDA multiple of 2.5 against a three-year average of 3.7 looks cheap, but the portal model implies only +1% upside. The verdict is rather attractive: the low valuation and strong balance sheet outweigh, but a turnaround in margin is needed for growth.
Open the company's financial profile PARR →
See also: market overview · valuation map · stock screeners