PBF Energy: profit up ninefold on record cracks, but the market delivered it, not the company
On 29 October PBF Energy reported third-quarter 2026 results: revenue of $12,132.8 million (+58.6% year on year), EBITDA of $2,105.0 million and net profit of $1,529.3 million (+799.1%). The profit came not from volumes – throughput rose only to 923.8 thousand barrels per day from 871.0 thousand – but from crack spreads: gross refining margin excluding special items reached $34.56 per barrel against $9.00 a year earlier. Net debt swung to net cash: from $1.6 billion on 30 June to minus $0.4 billion on 30 September. At an LTM EV/EBITDA of 1.93 and a portal-model upside of +91%, the share looks attractive, but that valuation rests on a crack level the company does not control.
Key takeaways
— Revenue accelerated to +58.6%, and almost all of the growth came from oil and crack prices, not volumes
— The $34.56 per-barrel refining margin is the market's: the New York Brent 2-1-1 crack rose to 64.77 from 25.82
— Net profit of $1,529.3 million is almost clean of one-offs: special items took only $28.9 million
— Debt turned into $0.4 billion of net cash, and the company redeemed its expensive 7.875% and 9.875% notes
— Quarterly capex of $118.4 million looks small against the $825–875 million plan for the year
— The dividend was raised 18% to $0.325 per share, but a 1.46% yield loses to the risk-free rate
— An LTM EV/EBITDA of 1.93 and P/E of 3.2 is a peak-cycle price, not a price for sustainable earnings
Attractiveness
Key figures, USD bn
| Metric | Q3 2025 | Q3 2026 | Change |
|---|---|---|---|
| Revenue | 7.65 | 12.1 | +58.6% |
| EBITDA | 0.45 | 2.10 | +364.4% |
| Operating profit | 0.29 | 2.10 | +634.8% |
| Net profit | 0.17 | 1.53 | +799.1% |
| Operating cash flow | 0.03 | 1.88 | +7206.2% |
| Capex | 0.15 | 0.12 | -20.3% |
| EBITDA margin | 5.9% | 17.3% | +11.4 pp |
| Net margin | 2.2% | 12.6% | +10.4 pp |
Revenue accelerated to +58.6%, and almost all of the growth came from oil and crack prices, not volumes
Third-quarter revenue was $12,132.8 million against $7,651.1 million a year earlier, growth of +58.6%. That is an acceleration from +56.2% in the second quarter, and the operating data show why: throughput rose to 923.8 thousand barrels per day from 871.0 thousand, roughly 6%. The rest of the growth came from price.
Average Dated Brent was $97.24 per barrel in the quarter against $69.17 a year earlier. Cracks rose faster than crude: the New York Dated Brent 2-1-1 spread was 64.77 against 25.82, the Chicago WTI 4-3-1 was 54.64 against 22.01. Revenue per barrel of throughput reached $142.75 against $95.49.
For a holder this means operating leverage worked in both directions at once: both the feedstock price and the refining margin were exceptionally high. The company did not gain market share or add capacity – it sold roughly the same volume at a multiple of the price.
The $34.56 per-barrel refining margin is the market's: the New York Brent 2-1-1 crack rose to 64.77 from 25.82
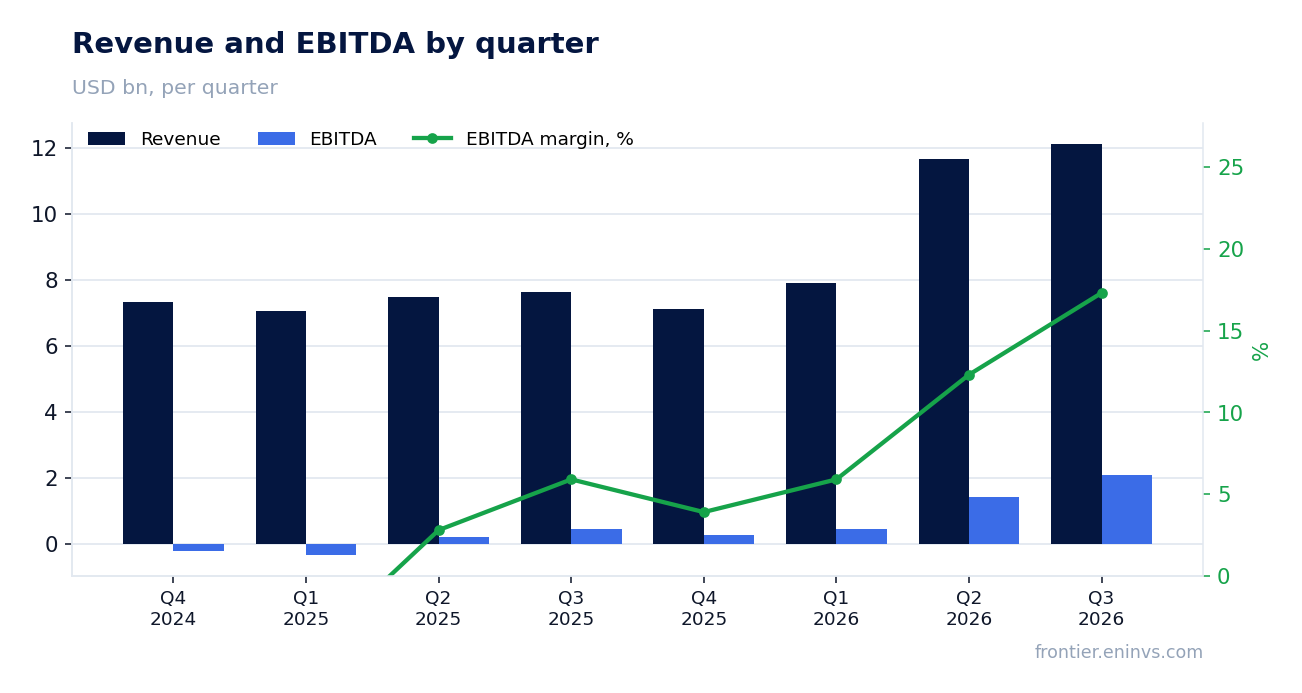
Gross refining margin excluding special items was $34.56 per barrel against $9.00 a year earlier. Consolidated gross margin was $25.54 against $0.49. EBITDA reached $2,105.0 million at a 17.3% margin against 5.9% a year earlier, and the net margin was 12.6% against 2.2%.
The gap between gross and net margin is cost: refining operating expense was $7.80 per barrel against $7.35, essentially unchanged per barrel. All of the margin gain came from above, from cracks, not from cost cuts.
By segment the West Coast was the strongest: refining margin there was $38.64 per barrel against 7.96, and throughput rose to 293.1 thousand barrels per day from 234.0 thousand after Martinez returned to service in May. The East Coast delivered 33.54, the Mid-Continent 36.86 and the Gulf Coast 27.61.
The RBI programme, per the company, generated more than $230 million of run-rate savings in 2025 and is expected to exceed $350 million by the end of 2026. Against quarterly EBITDA of $2.1 billion that is small, and it does not explain the quarter's result.
Net profit of $1,529.3 million is almost clean of one-offs: special items took only $28.9 million
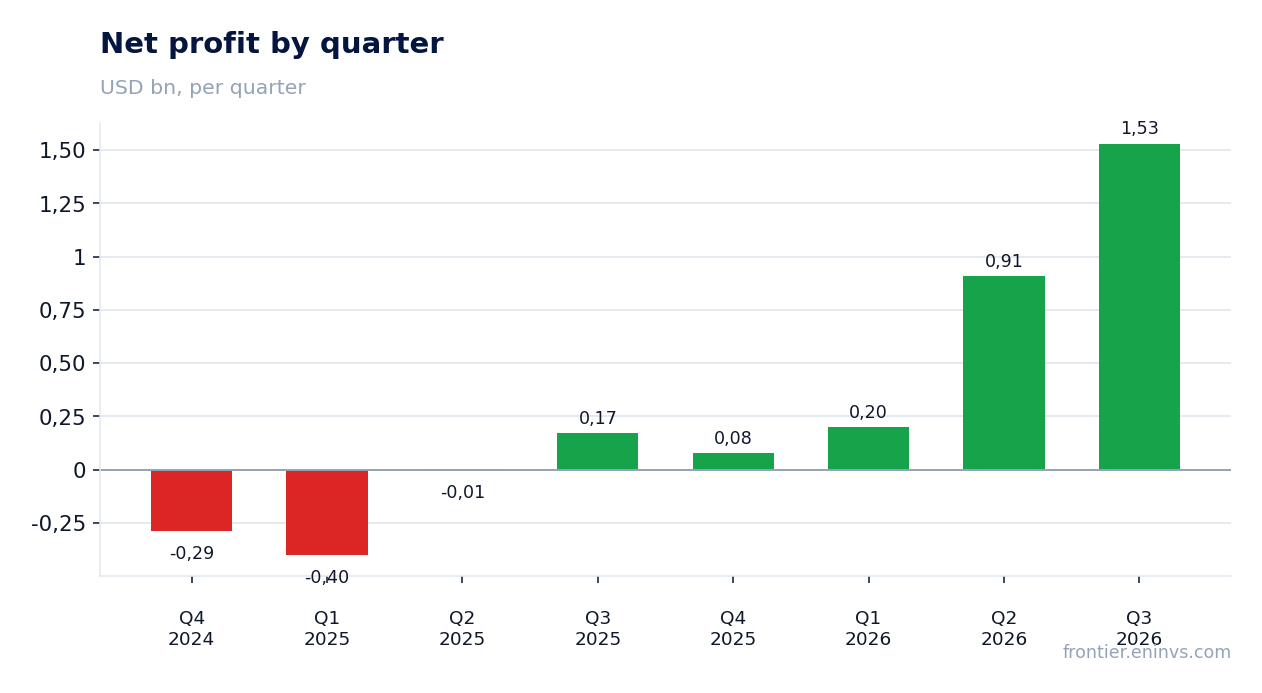
Net profit attributable to PBF Energy shareholders was $1,529.3 million, or $12.54 per diluted share, against $170.1 million and $1.45 a year earlier. Income from operations was $2,100.9 million against $285.9 million.
Special items in the quarter were small and mostly non-cash: a loss on debt extinguishment and RBI programme costs produced a net after-tax charge of $28.9 million, or $0.24 per share. Profit excluding special items was $1,568.6 million, or $12.78 per share, against a loss of $60.3 million a year earlier.
An important difference from the nine-month figure: over nine months the company reversed a $313.0 million inventory reserve, which increased income from operations and net profit by $231.6 million. There was no such reversal in the third quarter, so the quarterly profit is an operating result, not an accounting adjustment.
Tax took a substantial share: tax expense was $503.8 million on pre-tax income of $2,047.1 million. That is a normal rate rather than a one-off, and it has to be counted when assessing sustainable earnings.
Debt turned into $0.4 billion of net cash, and the company redeemed its expensive 7.875% and 9.875% notes
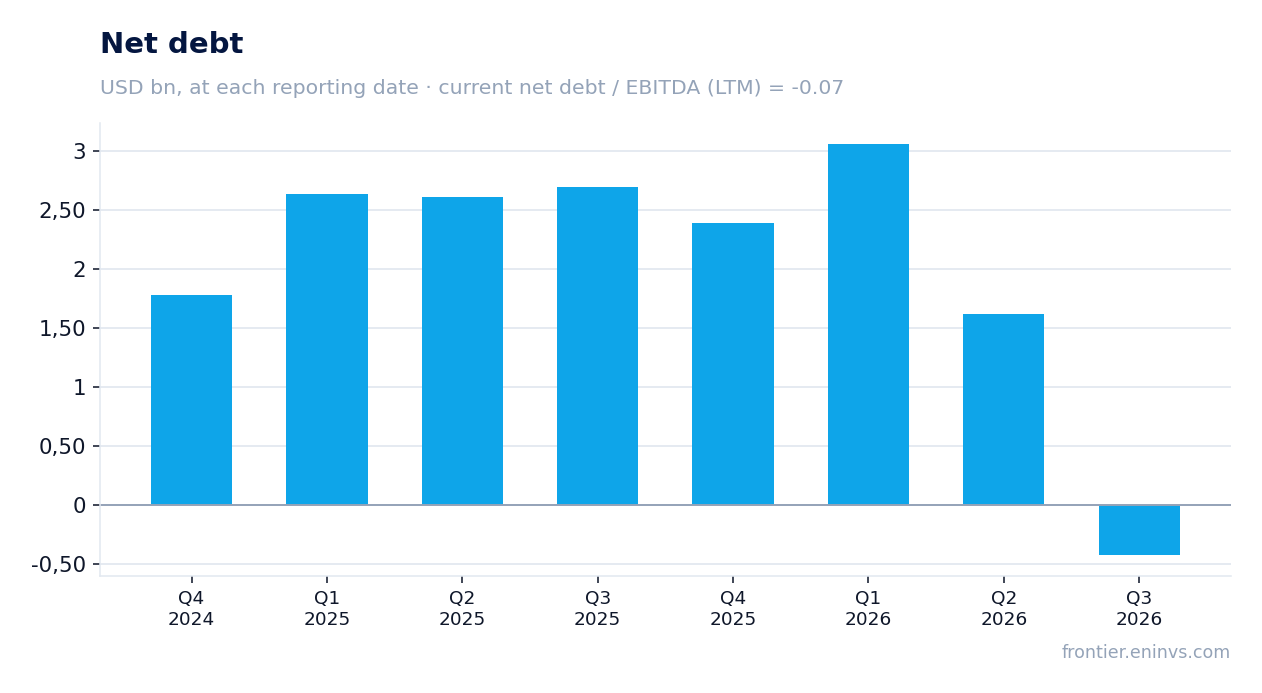
Net debt at 30 September was minus $425.9 million, meaning cash exceeds debt. On 30 June net debt was $1.6 billion and on 30 September 2025 it was $2.7 billion; the change was minus $2.0 billion for the quarter and minus $3.1 billion over the year. Net debt to LTM EBITDA is minus 0.07.
The company issued $550 million of 0% exchangeable notes due 2032 and redeemed $500 million of 7.875% notes due 2030. After the quarter it called and repaid the remaining $800 million of 9.875% notes due 2030 from cash. That lowers interest expense: it was $27.2 million in the quarter against $50.3 million a year earlier.
Operating cash flow for the quarter was $1,877.7 million, which funded the redemptions. Capital expenditure was only $118.4 million, so almost all of the flow went to the balance sheet. Over nine months operating cash flow was $3,142.8 million against an outflow of $444.6 million a year earlier.
For a holder this means balance-sheet risk is minimal now: net cash and a lower cost of debt give the company room through a weak cycle. But that room was created by the quarter's peak margin, not by a steady ability to generate cash.
Quarterly capex of $118.4 million looks small against the $825–875 million plan for the year
Capital expenditure in the third quarter was $118.4 million, below the $148.5 million of a year earlier. The company's 2026 plan remains $825–875 million excluding the Martinez rebuild. Over nine months spending was $685.1 million, so the fourth quarter should be noticeably heavier on cash.
Part of the plan has moved: the company deferred planned turnarounds at Chalmette and Toledo from the fourth quarter to 2027, while the Martinez and Paulsboro turnarounds began in September and finished in October. The plan also includes advance purchases of materials for the 2027 turnarounds.
The light quarterly capex is a calendar effect, not a saving on the future. Against operating cash flow of $1,877.7 million it left almost all of the revenue in the bank, and that is why net debt went negative. The effect will be weaker in the fourth quarter.
The dividend was raised 18% to $0.325 per share, but a 1.46% yield loses to the risk-free rate
The company declared a quarterly dividend of $0.325 per Class A share payable on 24 November 2026, 18% above the previous $0.275. Over nine months $0.825 per share was paid. The trailing twelve-month yield is 1.46%.
Against quarterly earnings of $12.54 per share, a $0.325 payment is a small share, about 2.6%. The company directs cash to the balance sheet and debt repayment rather than to payouts. Our estimate: at the current rate the annual dividend will be $1.30, and everything hinges on earnings staying above $10 per share.
A 1.46% yield is below the risk-free rate, so the dividend is not a reason to hold the share. The 18% increase is a signal of management confidence, not a source of income. A fall in cracks could cut the payout: at 2025 margins earnings barely covered costs, and the dividend was then paid out of the balance sheet.
An LTM EV/EBITDA of 1.93 and P/E of 3.2 is a peak-cycle price, not a price for sustainable earnings
With a market capitalisation of $8,680.7 million and LTM EBITDA of $5,743.6 million, the LTM EV/EBITDA is 1.93 and the LTM P/E is 3.2. Return on equity is 85.2%. These levels reflect the earnings of the last twelve months, which included two exceptionally strong quarters – the second and third of 2026.
A comparison with its own history is not possible: the facts contain no three-year average. But the cycle logic is visible from the quarters themselves: EBITDA was minus $216.3 million in the fourth quarter of 2024, minus $336.0 million in the first quarter of 2025 and $209.3 million in the second quarter of 2025. At those levels the multiple would be meaningless.
On the portal's model, repricing EBITDA to current commodity prices at the target EV/EBITDA puts the share's upside to fair value at +91%. That is our own estimate, not a consensus. It rests on the current crack level, and if that holds the share really is cheap.
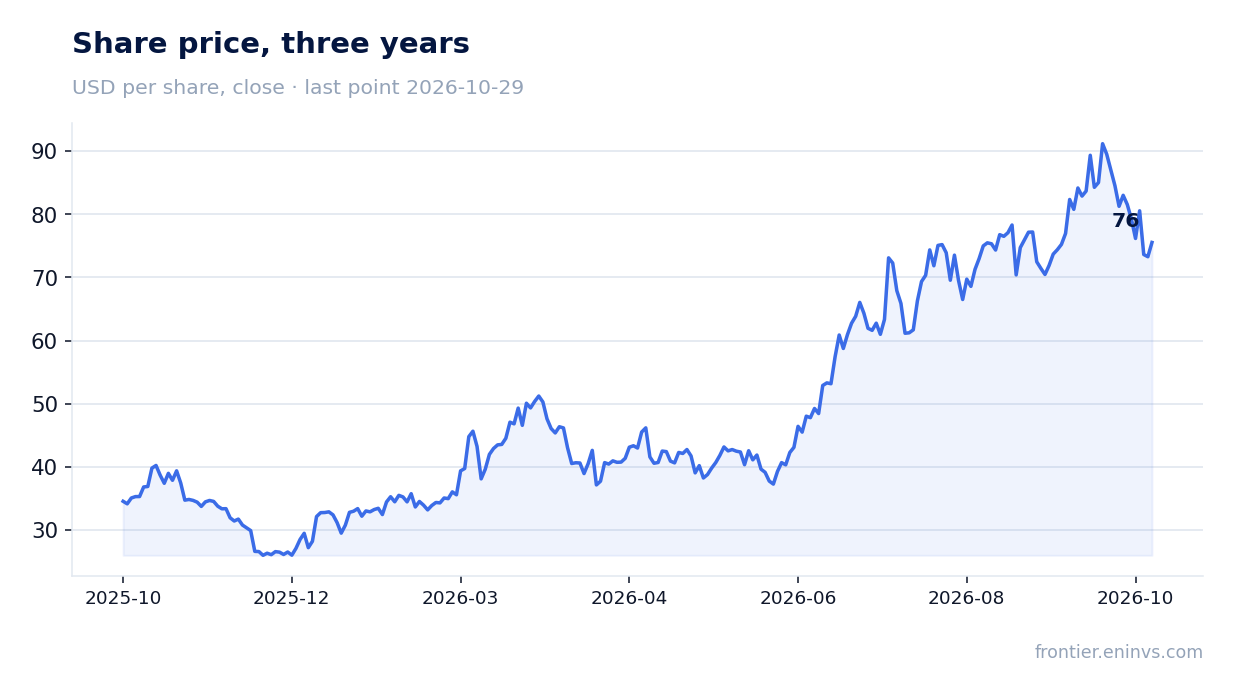
The market reacted modestly: the share added 3.1% on the release day and the same from the release to 29 October. At $73.28 before publication, investors had already priced in a strong quarter.
Valuation on the latest reported figures
| Metric | Value |
|---|---|
| Market cap | 8.68 bn USD |
| P/E (LTM) | 3.2 |
| EV/EBITDA (LTM) | 1.9 |
| P/B | 1.63 |
| Net debt / EBITDA (LTM) | -0.07 |
| ROE | 85.2% |
| Dividend yield (12m) | 1.5% |
Tracked metrics of the idea
The metrics we track our idea "PBF Energy (13 ideas)" of 2026-07-16 by - at the idea date and now. The share price moved +24% over the period. Original write-up: https://frontier.eninvs.com/region/commodities/article/pbf
Idea: at publication and now
| Metric | 2026-07-16, price 60.94 | Now, price 75.54 |
|---|---|---|
| Fundamental value created, share of market cap | +100% | +74% |
| Upside on the commodity model (conservative price: midpoint of spot and 3-year average) | +141% | +91% |
Bottom line
The quarter was exceptionally strong: revenue of $12,132.8 million, EBITDA of $2,105.0 million, net profit of $1,529.3 million, and almost all of that profit is operating, without large one-offs. The balance sheet turned to net cash: from $1.6 billion of net debt on 30 June to minus $0.4 billion on 30 September, with the expensive 7.875% and 9.875% notes redeemed. But the company earned on cracks, not on itself: refining margin rose to $34.56 per barrel with per-barrel costs almost unchanged. An LTM EV/EBITDA of 1.93 and P/E of 3.2 is a price for peak earnings, and the +91% upside on the portal's model rests on cracks holding at current levels. The verdict is attractive, with a caveat: if cracks return to 2025 levels, the profit disappears and the multiples stop meaning anything.
Open the company's financial profile PBF →
See also: market overview · valuation map · stock screeners