Petrobras: revenue up 56.2%, but the multiple sits above its own history
On 25 August Petrobras released its Q2 2026 results. Revenue came in at USD 33.4 bn, EBITDA at USD 18.5 bn and net profit at USD 10.3 bn. Year on year revenue rose 56.2%, EBITDA doubled, and the EBITDA margin climbed to 55.4% from 43.2%. At the same time, LTM EV/EBITDA stands at 3.8 – 21% above its own three-year average of 3.2 – while the portal's model puts the upside of the share at minus 28%. The share looks rather unattractive at the current level.
Key takeaways
— Revenue rose 56.2% year on year, an acceleration from 12.5% a quarter earlier
— EBITDA doubled to USD 18.5 bn, lifting the margin to 55.4%
— Net profit rose 115.3% to USD 10.3 bn
— Operating cash flow of USD 12.2 bn covers capital expenditure of USD 4.5 bn
— Net debt declined to USD 61.6 bn from USD 64.6 bn at the end of March
— EV/EBITDA of 3.8 is above its own three-year average of 3.2
— Trailing twelve-month dividend yield stands at 3.7%
Attractiveness
Key figures, USD bn
| Metric | Q2 2025 | Q2 2026 | Change |
|---|---|---|---|
| Revenue | 21.4 | 33.4 | +56.2% |
| EBITDA | 9.22 | 18.5 | +100.4% |
| Operating profit | 5.46 | 14.2 | +160.7% |
| Net profit | 4.80 | 10.3 | +115.3% |
| Operating cash flow | 7.61 | 12.2 | +60.0% |
| Capex | 4.16 | 4.54 | +9.2% |
| EBITDA margin | 43.2% | 55.4% | +12.2 pp |
| Net margin | 22.5% | 31.0% | +8.5 pp |
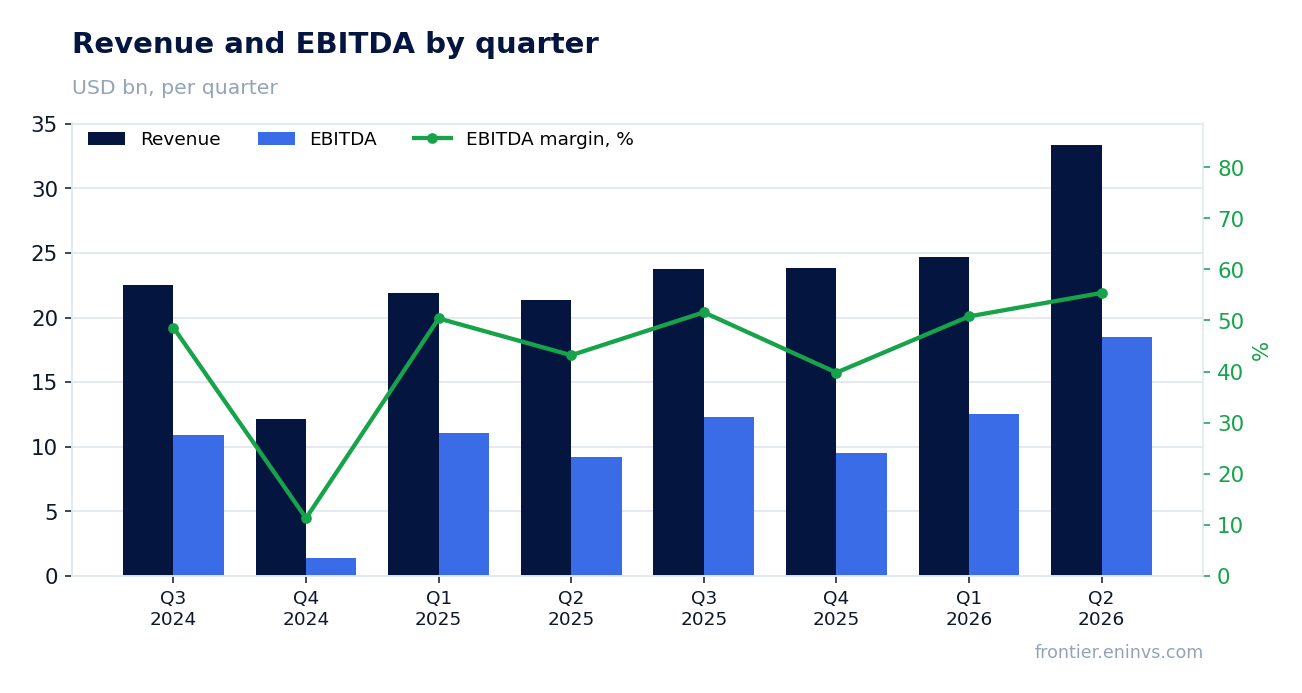
Revenue rose 56.2% year on year, an acceleration from 12.5% a quarter earlier
In Q2 2026 Petrobras revenue reached USD 33.4 bn, up 56.2% year on year. This marks a clear acceleration from 12.5% growth in Q1 2026. For context, revenue grew 18.5% in Q4 2025, 5.7% in Q3 2025, while Q1 and Q2 2025 saw declines.
The surge is largely explained by a low base effect: in Q2 2025 revenue was USD 21.4 bn, down 1.9% year on year. The current quarter's USD 33.4 bn represents not just a recovery but substantial growth in absolute terms. Sequentially, revenue rose from USD 24.7 bn in Q1 2026, a strong increase.
The acceleration in revenue growth is a key positive from the report. However, the year-on-year comparison is against a period of suppressed revenue. The sustainability of this growth will depend on oil prices and production volumes in coming quarters.
EBITDA doubled to USD 18.5 bn, lifting the margin to 55.4%
EBITDA in Q2 2026 reached USD 18.5 bn, up 100.4% year on year. The EBITDA margin rose to 55.4% from 43.2% in Q2 2025. This is a very high level, reflecting both revenue growth and cost control.
Operating profit was USD 14.2 bn. With revenue of USD 33.4 bn, operating costs (including cost of goods sold, SG&A, but excluding depreciation) were about USD 19.1 bn. The decline in the cost share of revenue drove the margin expansion.
Doubling EBITDA is a strong result, but it is largely due to a low base: EBITDA was USD 9.2 bn a year earlier. Sequentially, EBITDA rose from USD 12.5 bn in Q1 2026. The sustainability of such a high margin will depend on oil prices and operational efficiency.
Net profit rose 115.3% to USD 10.3 bn
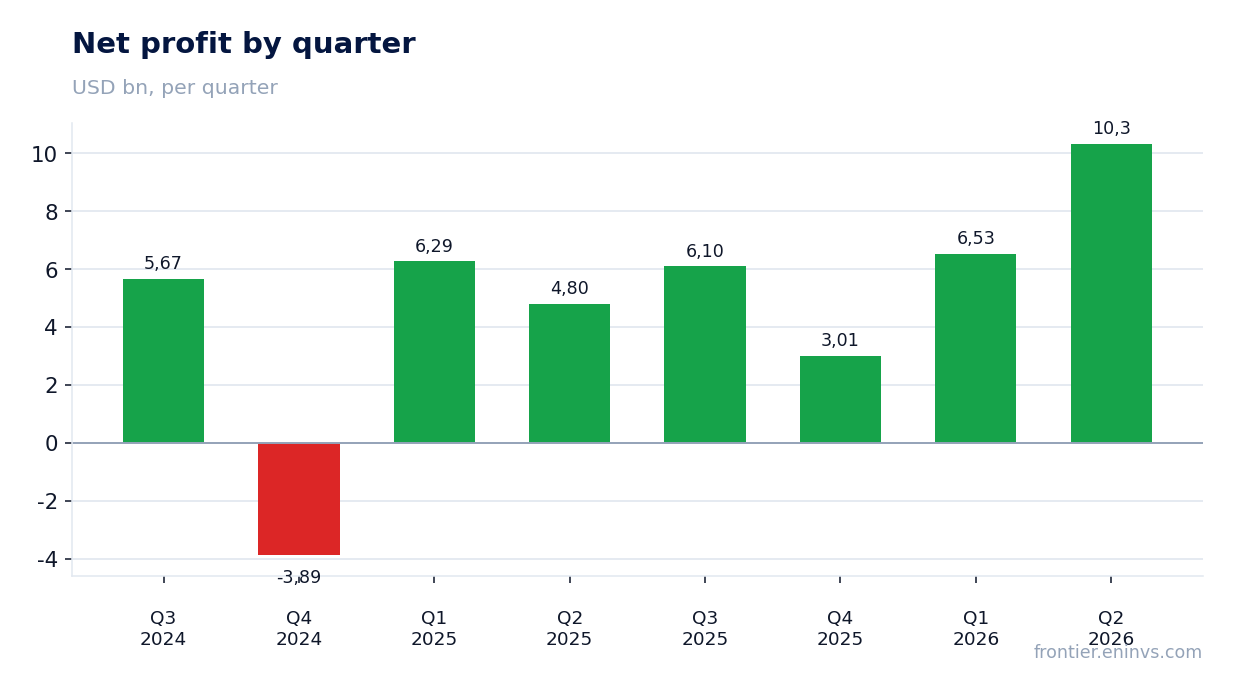
Net profit in Q2 2026 was USD 10.3 bn, up 115.3% year on year. The net margin rose to 31.0% from 22.5% in Q2 2025. This reflects both higher operating profit and possibly lower financial expenses or taxes.
Net profit growth outpaced EBITDA growth, which may indicate an improvement in interest expenses or taxes. However, details of financial items are not disclosed in the provided data. Importantly, the profit does not appear to contain large one-off items based on available information.
Net profit of USD 10.3 bn is a substantial sum that supports the dividend base. Over the trailing twelve months, net profit was USD 25.8 bn, giving a P/E of 5.4.
Operating cash flow of USD 12.2 bn covers capital expenditure of USD 4.5 bn
Operating cash flow in Q2 2026 was USD 12.2 bn. Capital expenditure for the same period was USD 4.5 bn. Thus, free cash flow (before working capital changes and other items) exceeds USD 7.7 bn.
For comparison: in Q1 2026 operating cash flow was USD 8.8 bn and capex USD 4.7 bn. In Q2 2025 operating cash flow was USD 7.6 bn and capex USD 4.2 bn. The current quarter shows significant growth in operating cash flow with stable capex.
Over the trailing twelve months, operating cash flow was USD 40.9 bn. This is a solid base for funding capex and dividends. However, capex of USD 4.5 bn per quarter appears relatively low compared to operating cash flow, which may indicate underinvestment or that major projects have not yet started.
Net debt declined to USD 61.6 bn from USD 64.6 bn at the end of March
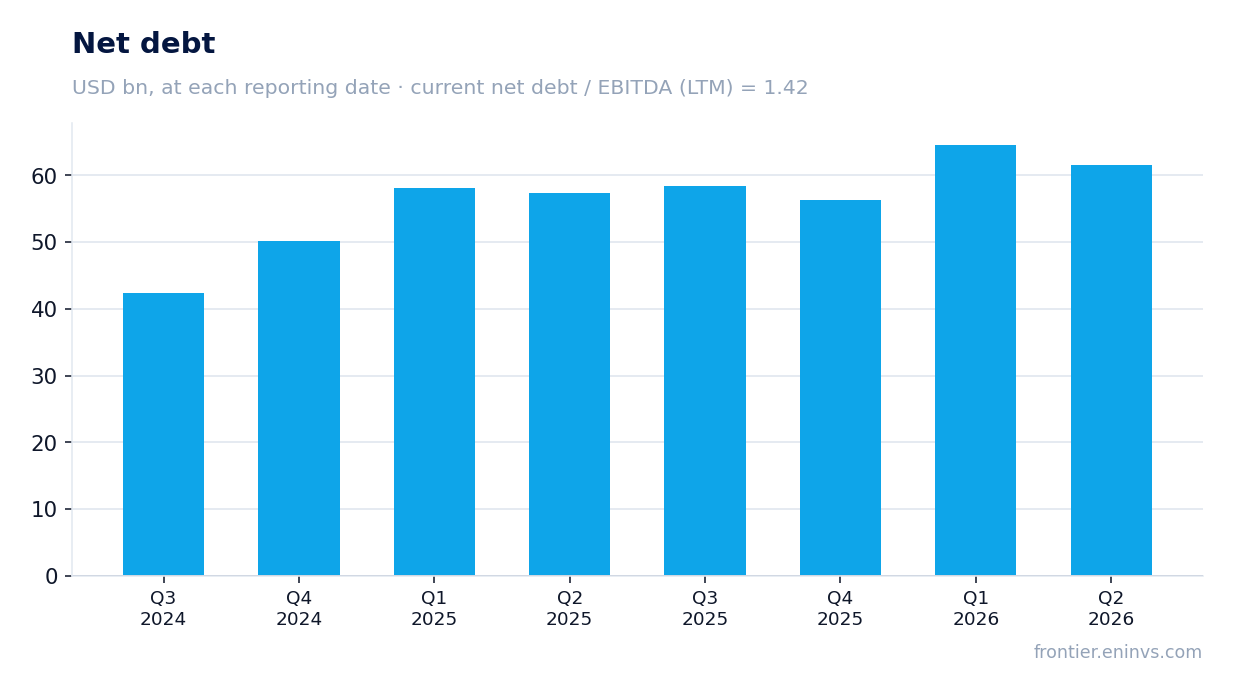
Net debt as of 30 June 2026 was USD 61.6 bn. At the end of Q1 2026 it was USD 64.6 bn, a decrease of USD 3.0 bn. However, a year earlier, on 30 June 2025, net debt was USD 57.3 bn, so over 12 months it increased by USD 4.3 bn.
The net debt to EBITDA ratio for the trailing twelve months is 1.2. This is a moderate level that does not raise concerns. However, the previous value of this ratio is not provided, so it cannot be stated whether leverage decreased or increased – only the current level can be noted.
The quarterly decline in net debt occurred against strong operating cash flow, which exceeded capex and likely allowed part of the funds to be directed to debt repayment. This is a positive signal, but the annual dynamics show that debt is still higher than a year ago.
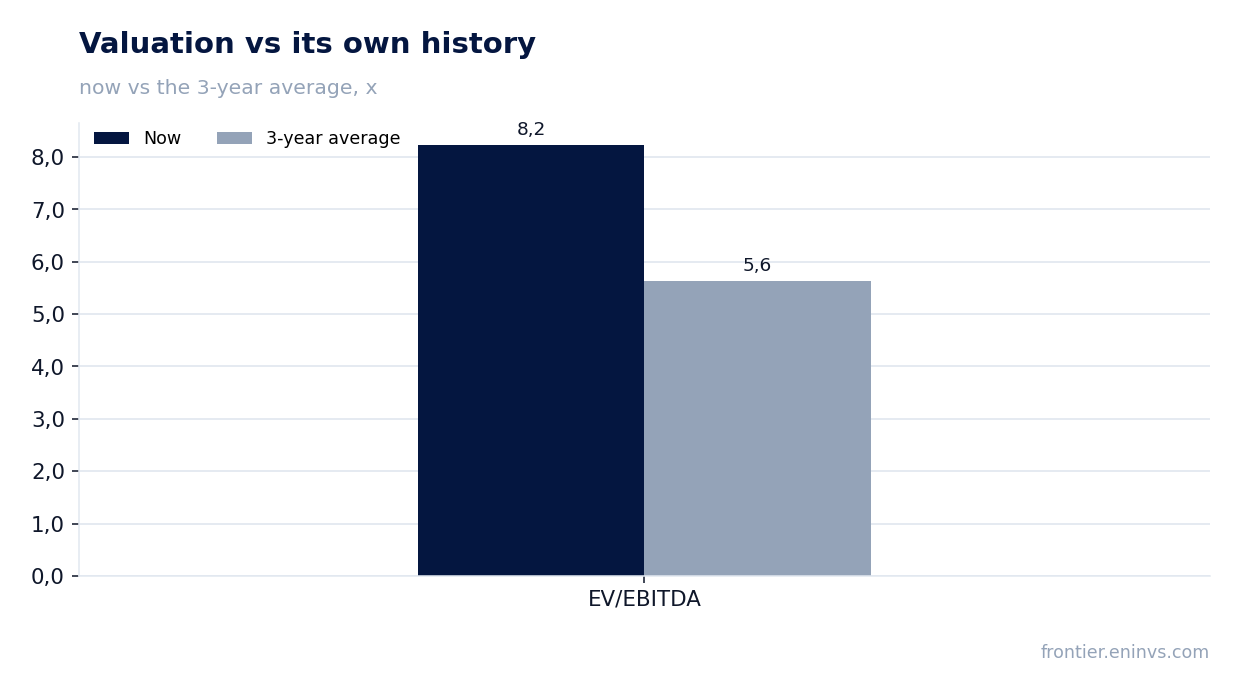
EV/EBITDA of 3.8 is above its own three-year average of 3.2
The EV/EBITDA multiple for the trailing twelve months is 3.8. This is 21% above its own three-year average of 3.2. Thus, the stock is valued more expensively than usual relative to its own history on this multiple.
For comparison, the P/E for the trailing twelve months is 5.4. This is a low level that may indicate undervaluation, but EV/EBITDA accounts for debt, and its excess over the historical average suggests the market is already pricing in a profit recovery.
The portal's model, which re-prices EBITDA at current commodity prices at the target EV/EBITDA, shows a downside of 28% to fair value. This is the portal's own calculation, not a market consensus. It confirms that the current price may be inflated relative to fundamental value.
Trailing twelve-month dividend yield stands at 3.7%
The dividend yield over the trailing twelve months is 3.7%. This is a moderate level, lower than might be expected from a company with such high profit and low P/E. Possibly the company directs a significant portion of profit to investments or debt repayment.
The provided data does not include information on specific dividend payments over the last year or on dividend policy. Therefore, it is impossible to assess what share of profit the company allocates to dividends and how sustainable the payments are. A yield of 3.7% at a key rate not specified in the facts could be either attractive or not.
For a dividend-oriented investor, it is important to understand that the current yield is not exceptionally high. However, if profit remains at the current level and the payout ratio increases, the yield could rise. But without data on the company's policy, this is only an assumption.
Valuation on the latest reported figures
| Metric | Value |
|---|---|
| Market cap | 140 bn USD |
| P/E (LTM) | 5.4 |
| EV/EBITDA (LTM) | 3.8 |
| P/B | 1.83 |
| Net debt / EBITDA (LTM) | 1.20 |
| Operating cash flow (LTM) | 40.9 bn |
| ROE | 45.0% |
| Dividend yield (12m) | 3.7% |
| EV/EBITDA, 3-year average | 3.2 |
Bottom line
In Q2 2026 Petrobras delivered strong results: revenue rose 56.2%, EBITDA doubled, and net profit more than doubled. Operating cash flow significantly exceeds capex, and net debt declined over the quarter. However, these achievements are largely due to a low base effect, and the sustainability of such growth is questionable. The EV/EBITDA multiple is above its own three-year average, and the portal's model indicates a 28% downside. A dividend yield of 3.7% does not appear high enough to compensate for these risks. The share looks rather unattractive at the current level.
Open the company's financial profile PBR →
See also: market overview · valuation map · stock screeners