Parex Resources: profit jumped ninefold, but almost all of it is paper
Parex Resources reported Q2 2026 results. Revenue rose 94.3% year-on-year to $468.9 million, EBITDA jumped 343.4% to $205.7 million, and net profit surged 804.6% to $444.3 million. However, the profit growth was largely driven by one-off items rather than operations: operating cash flow was only $199.2 million, and net debt increased from $0.1 billion to $0.6 billion during the quarter. With an EV/EBITDA multiple of 4.44 versus its own three-year average of 2.06, the stock looks neutral: a 5.77% dividend yield supports valuation, but the sustainability of earnings is questionable.
Key takeaways
— Revenue grew 94.3% year-on-year, but growth was only 1.9% in the prior quarter – the acceleration was driven by a one-off factor
— EBITDA margin jumped to 101.4% from 44.4% a year earlier, which is atypical for an oil and gas company
— Net profit of $444.3 million was nearly double revenue due to an item unrelated to core operations
— Operating cash flow of $199.2 million was less than half of net profit – the gap points to the non-cash nature of earnings
— Net debt rose from $0.1 billion to $0.6 billion during the quarter, with net debt/EBITDA LTM at 1.56
— A 5.77% dividend yield and P/E LTM of 2.78 make the stock cheap by historical standards, but EV/EBITDA of 4.44 is above the three-year average of 2.06
— The portal's model estimates upside to fair value at +12%
Attractiveness
Key figures, USD bn
| Metric | Q2 2025 | Q2 2026 | Change |
|---|---|---|---|
| Revenue | 0.24 | 0.47 | +94.3% |
| EBITDA | 0.11 | 0.48 | +343.4% |
| Operating profit | 0.06 | 0.14 | +144.6% |
| Net profit | 0.05 | 0.44 | +804.6% |
| Operating cash flow | 0.14 | 0.20 | +39.7% |
| EBITDA margin | 44.4% | 101.4% | +57.0 pp |
| Net margin | 20.3% | 94.7% | +74.4 pp |
Revenue grew 94.3% year-on-year, but growth was only 1.9% in the prior quarter – the acceleration was driven by a one-off factor
In Q2 2026, Parex Resources revenue reached $468.9 million, up 94.3% year-on-year. For comparison, growth in Q1 was only 1.9% year-on-year. Thus, there was a sharp acceleration in growth.
However, such a jump appears one-off: sequential growth from Q1 2026 ($273.1 million) was 71.7%, which is atypical for an oil and gas company without major acquisitions or abnormal prices. The facts provide no explanation for this surge, so we can only state the fact of acceleration.
For an investor, it is important that organic growth is likely much more modest. Without the one-off factor, revenue might have remained near the levels of previous quarters – around $250–270 million. This means the current valuation may rely on an inflated base.
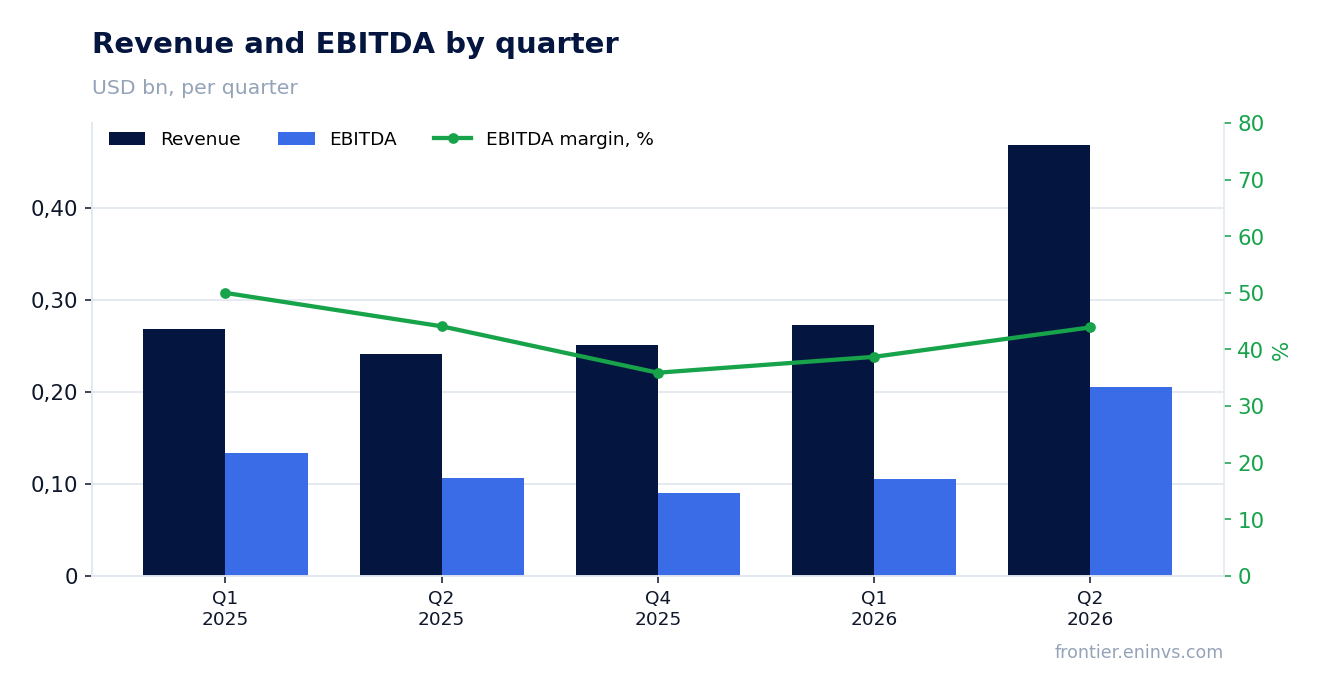
EBITDA margin jumped to 101.4% from 44.4% a year earlier, which is atypical for an oil and gas company
EBITDA in Q2 2026 was $205.7 million, with a margin of 101.4% versus 44.4% a year earlier. A margin above 100% means EBITDA exceeded revenue, which is possible with large one-off income unrelated to core operations.
Operating profit was $143.3 million, significantly below EBITDA. The gap between EBITDA and operating profit points to substantial non-cash or one-off items forming EBITDA.
Such a high margin is unsustainable. In previous quarters, EBITDA margin fluctuated in the 35–50% range (calculated from available data). A return to normal levels would lead to a sharp drop in both EBITDA and profit.
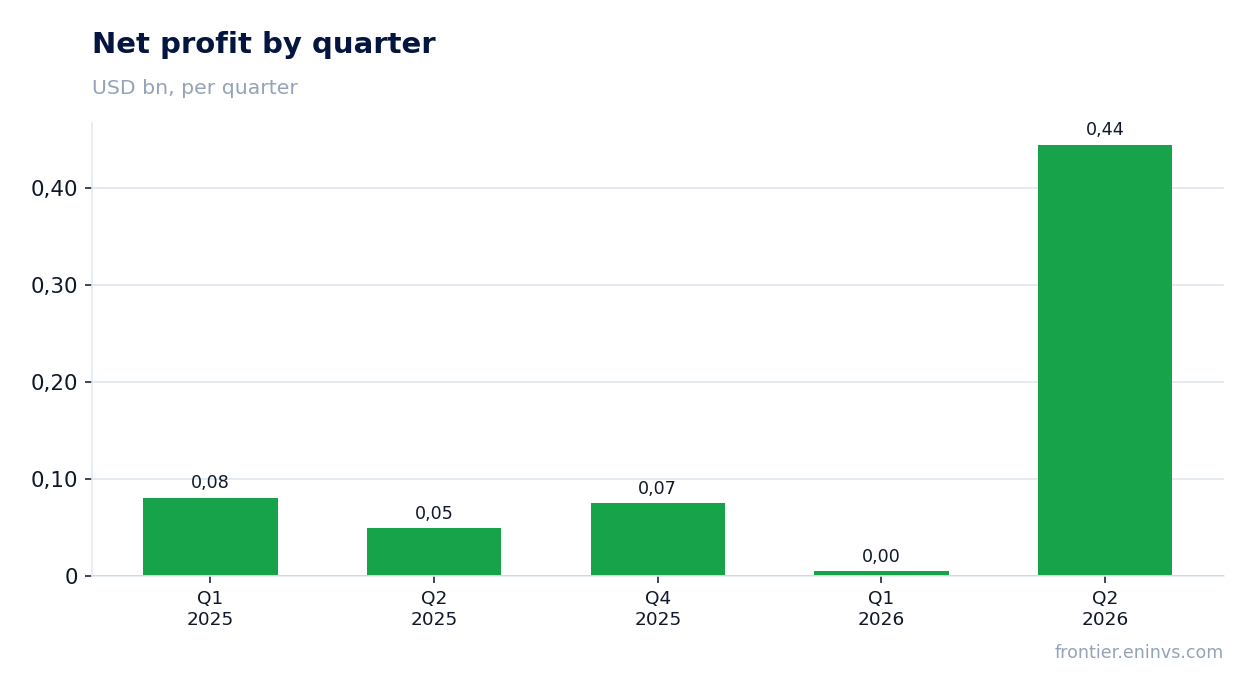
Net profit of $444.3 million was nearly double revenue due to an item unrelated to core operations
Net profit in Q2 2026 was $444.3 million, up 804.6% year-on-year. Revenue was $468.9 million, meaning profit was almost equal to revenue.
Such a ratio is only possible with a large one-off gain, such as from asset sales or revaluation. The facts do not provide details, but operating profit of $143.3 million confirms that core operations did not generate such profit.
To assess business sustainability, one should rely on operating profit, which grew from $58.6 million a year earlier to $143.3 million, i.e., 2.4 times. This is also strong growth, but much more modest than net profit growth.
Operating cash flow of $199.2 million was less than half of net profit – the gap points to the non-cash nature of earnings
Operating cash flow in Q2 2026 was $199.2 million, up 39.7% from $142.6 million a year earlier. However, this is only 44.8% of net profit of $444.3 million.
Such a significant gap between profit and cash flow confirms that a large part of profit was not received in cash. This may be due to non-cash income recorded in the income statement.
For an investor, cash flow is more important than accounting profit. Operating cash flow of $199.2 million with revenue of $468.9 million means the company converts less than half of revenue into cash, which may be normal for the industry, but not in combination with abnormally high profit.
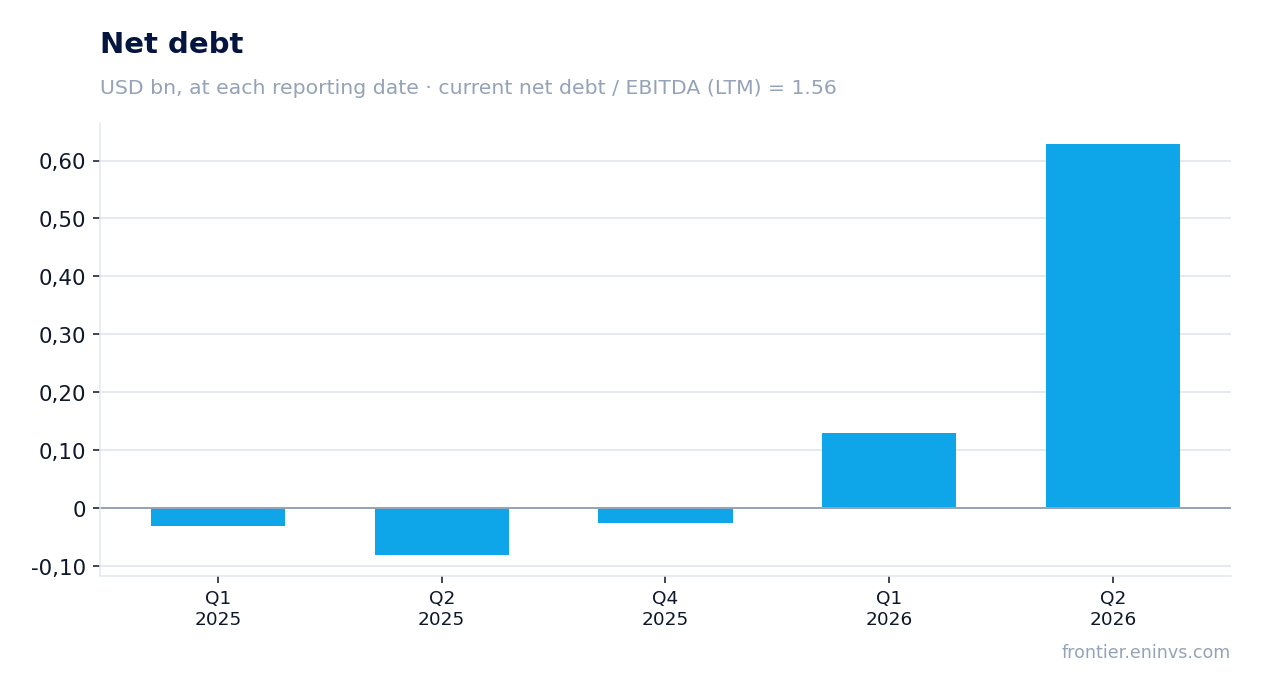
Net debt rose from $0.1 billion to $0.6 billion during the quarter, with net debt/EBITDA LTM at 1.56
As of June 30, 2026, Parex Resources net debt was $629.0 million, up from $130.4 million on March 31, 2026, an increase of $498.6 million. A year earlier, on June 30, 2025, net debt was negative (–$80.8 million), so over 12 months it increased by $709.8 million.
The net debt/EBITDA LTM ratio is 1.56. This is a moderate level, but the quarterly debt increase is significant. The company increased debt, possibly to finance investments or payouts.
Interest expenses are not disclosed in the facts, but rising debt could increase financial burden in the future. It is important to monitor debt dynamics in the next quarter.
A 5.77% dividend yield and P/E LTM of 2.78 make the stock cheap by historical standards, but EV/EBITDA of 4.44 is above the three-year average of 2.06
Dividend yield over the last 12 months is 5.77%, which is above the current key rate if compared to Russian instruments, but for a foreign company this is a moderate level. P/E LTM is 2.78, which is very low and reflects high LTM profit.
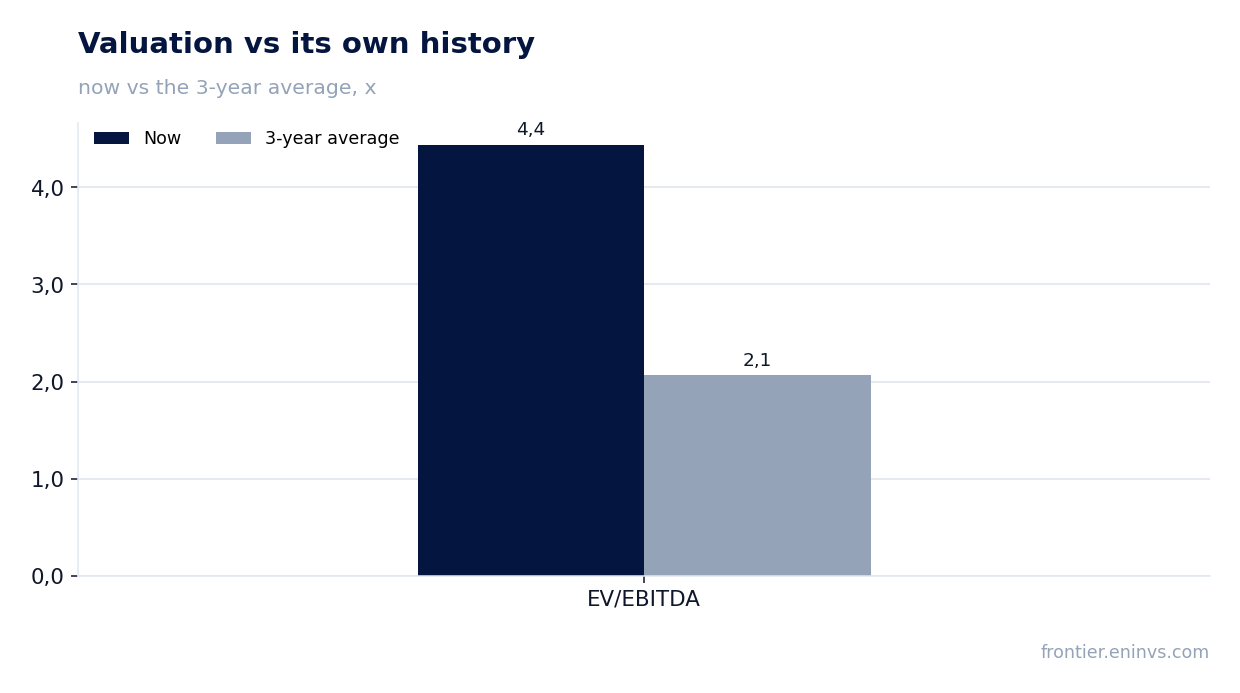
However, EV/EBITDA LTM is 4.44, significantly above the three-year average of 2.06. This indicates that on the EV/EBITDA multiple, the stock is valued more expensively than usual, despite the low P/E.
The difference is explained by capital structure: high net debt increases EV, while LTM EBITDA ($402.0 million) includes one-off income that inflates the base. Thus, the current valuation is not as cheap as it appears from P/E.
The portal's model estimates upside to fair value at +12%
According to our own model, which re-prices EBITDA at current commodity prices at the target EV/EBITDA, the fair value of the share implies +12% upside to the current market price.
This is a moderate upside that does not compensate for the risks associated with earnings instability and rising debt. The model is sensitive to assumptions on EBITDA and the target multiple.
For an investor, +12% is a rather neutral signal, especially given the 5.77% dividend yield, which can provide part of the return.
Valuation on the latest reported figures
| Metric | Value |
|---|---|
| Market cap | 1.81 bn USD |
| P/E (LTM) | 2.8 |
| EV/EBITDA (LTM) | 4.4 |
| P/B | 0.93 |
| Net debt / EBITDA (LTM) | 1.56 |
| Operating cash flow (LTM) | 0.48 bn |
| ROE | 83.0% |
| Dividend yield (12m) | 5.8% |
| EV/EBITDA, 3-year average | 2.1 |
Bottom line
Bottom line: in Q2 2026, Parex Resources showed explosive revenue and profit growth, but it was largely driven by one-off factors rather than sustainable business improvement. Operating cash flow remains moderate, and net debt rose sharply. The stock is neutrally valued: a 5.77% dividend yield and +12% upside on the portal's model are attractive, but the EV/EBITDA multiple is above its own three-year average, and earnings quality is questionable. Confirmation of sustainability requires the next report without one-off items.
Open the company's financial profile PXT →
See also: market overview · valuation map · stock screeners