Riley Exploration Permian: revenue up 88.3% but net profit turned negative on one-offs
On November 4, Riley Exploration Permian reported results for the third quarter of 2026. Revenue came in at $201.2 million, EBITDA at $139.2 million, and net profit at -$2.4 million. The 88.3% year-on-year revenue growth was accompanied by a 114.7% decline in net profit due to one-off items unrelated to operations. At the current price, the stock looks neutral: the EV/EBITDA multiple is below its historical average, but weak net profit and dividend uncertainty limit its appeal.
Key takeaways
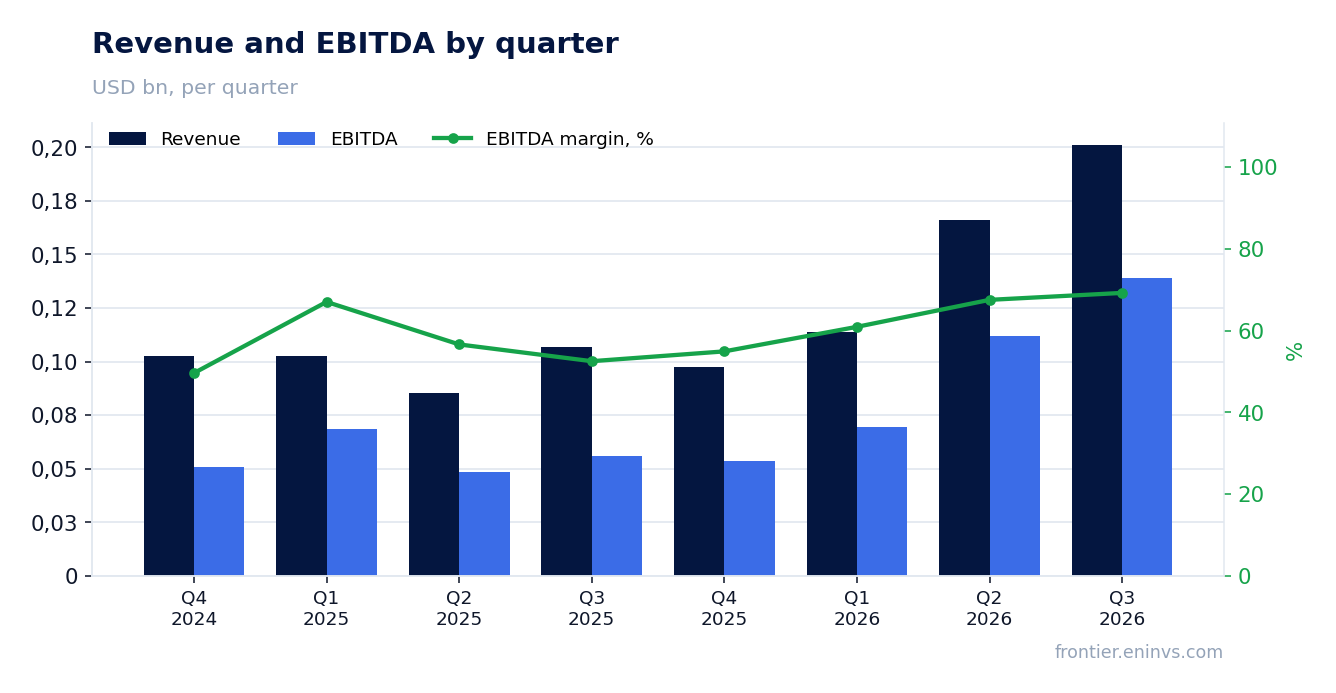
— Revenue grew 88.3% year-on-year to $201.2 million, but growth decelerated from 94.2% in the second quarter
— EBITDA jumped 148.2% to $139.2 million, with the margin reaching 69.2% versus 52.5% a year earlier
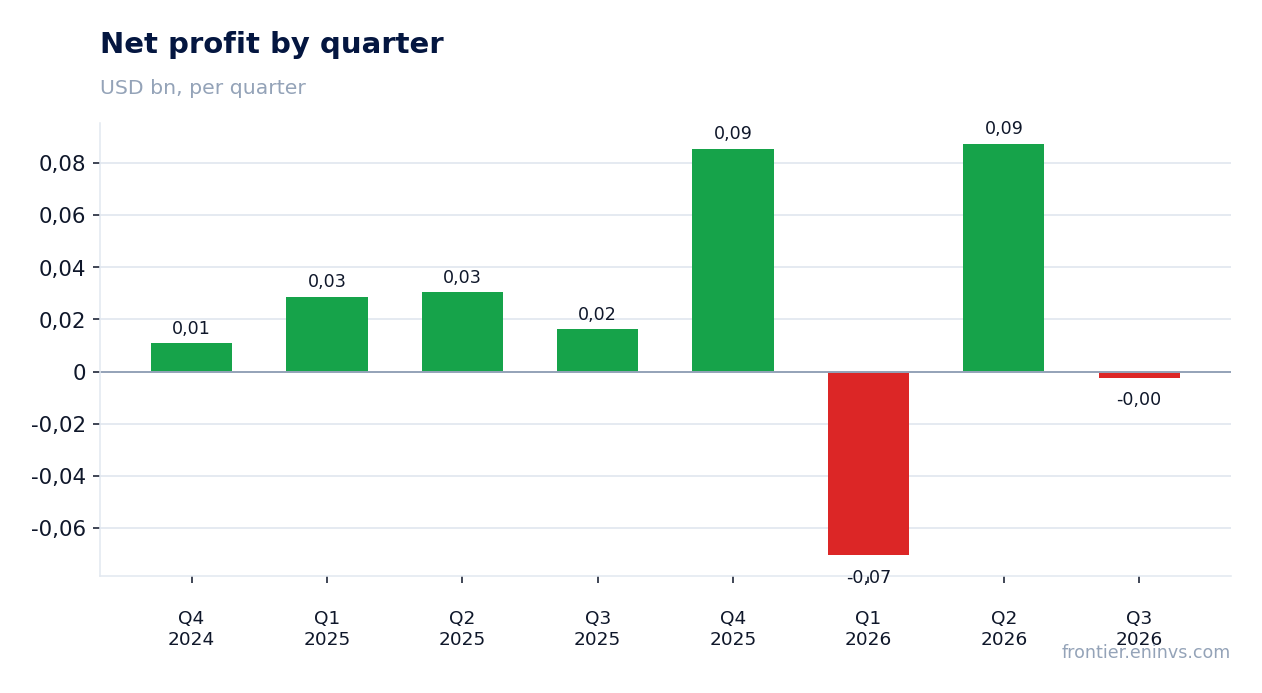
— Net profit turned negative at -$2.4 million due to one-off items unrelated to operations
— Operating cash flow was $111.3 million, well above net profit
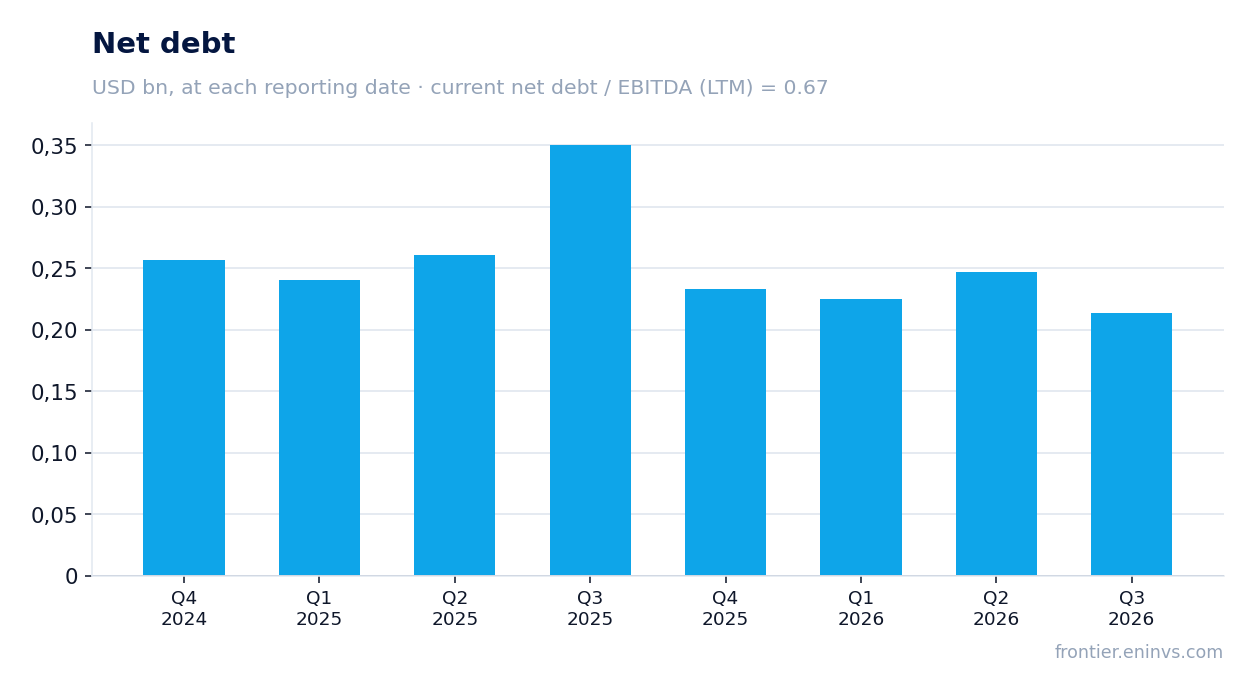
— Leverage remains moderate: net debt of $213.5 million, or 0.67x LTM EBITDA
— Dividend yield over the last 12 months is 3.8%, below the key rate
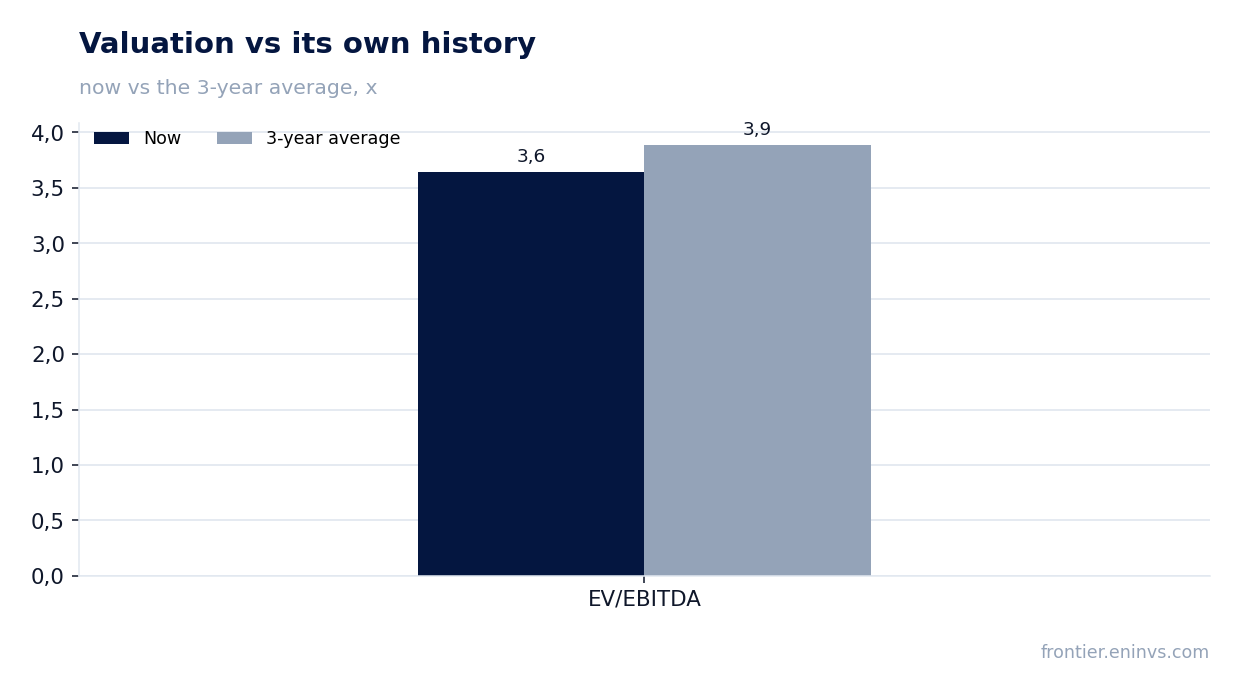
— The stock trades at EV/EBITDA of 3.6, below its historical average of 3.9, but the portal model implies 3% downside
Attractiveness
Key figures, USD bn
| Metric | Q3 2025 | Q3 2026 | Change |
|---|---|---|---|
| Revenue | 0.11 | 0.20 | +88.3% |
| EBITDA | 0.06 | 0.14 | +148.2% |
| Operating profit | 0.03 | 0.11 | +269.8% |
| Net profit | 0.02 | -0.00 | -114.7% |
| Operating cash flow | 0.06 | 0.11 | +74.9% |
| Capex | 0.03 | — | — |
| EBITDA margin | 52.5% | 69.2% | +16.7 pp |
| Net margin | 15.3% | -1.2% | -16.5 pp |
Revenue grew 88.3% year-on-year to $201.2 million, but growth decelerated from 94.2% in the second quarter
Revenue in the third quarter of 2026 was $201.2 million, up 88.3% year-on-year. This is significant growth, but it was slower than in the second quarter, when revenue rose 94.2%. The deceleration may indicate that the main impetus from production increases or prices is beginning to wane.
Such high revenue growth is likely linked to higher production volumes or favorable price conditions. However, without additional data from the report, it is difficult to isolate which factor contributed more. Importantly, the company has maintained high growth rates for two consecutive quarters.
For investors, the deceleration in revenue growth is a signal to watch upcoming reports. If the pace continues to slow, it could limit further growth in profit and cash flow.
EBITDA jumped 148.2% to $139.2 million, with the margin reaching 69.2% versus 52.5% a year earlier
EBITDA in the reported quarter was $139.2 million, up 148.2% year-on-year. EBITDA growth significantly outpaced revenue growth, leading to an expansion in the margin to 69.2% from 52.5% in the third quarter of 2025.
Such a substantial improvement in profitability may be due to operating leverage: as revenue grows, fixed costs are spread over a larger volume. Additionally, lower unit production costs or favorable price conditions could have contributed.
The high EBITDA margin is a strong point of the report, but the sustainability of this level is questionable. If revenue growth slows, pressure on the margin may increase, especially if part of the improvement was driven by one-off factors.
Net profit turned negative at -$2.4 million due to one-off items unrelated to operations
Net profit in the third quarter of 2026 was -$2.4 million versus a profit of $16.3 million a year earlier. The 114.7% decline resulted in a negative net margin of -1.2% compared to 15.3% a year earlier.
Despite record EBITDA and operating profit of $106.7 million, the company posted a net loss. This discrepancy points to significant one-off items below the operating line, such as write-offs, asset revaluations, or financial expenses unrelated to core operations.
For investors, it is important to separate operating results from accounting one-offs. Strong EBITDA and cash flow indicate business health, while the net loss is likely technical in nature. However, if such items recur, it could become a problem.
Operating cash flow was $111.3 million, well above net profit
Operating cash flow in the third quarter of 2026 reached $111.3 million, significantly exceeding net profit. This confirms that the business generates real cash despite the accounting loss.
The gap between cash flow and net profit is explained by non-cash write-offs and one-off items that reduced profit but did not affect cash. This profile is typical for companies with high depreciation and one-off adjustments.
Strong operating cash flow provides financial flexibility for investments and shareholder payouts. However, capital expenditures in the reported quarter are not disclosed, which limits the assessment of free cash flow.
Leverage remains moderate: net debt of $213.5 million, or 0.67x LTM EBITDA
Net debt at the end of the third quarter of 2026 was $213.5 million, down from $246.8 million at the end of the second quarter. Over the last 12 months, net debt decreased from $350.6 million, reflecting an improved cash position.
The ratio of net debt to LTM EBITDA is 0.67, indicating low leverage. This level provides the company with a margin of safety and the ability to raise financing on favorable terms.
The reduction in debt alongside EBITDA growth is a positive signal. However, capital expenditures in the reported quarter are not disclosed, which does not allow a full assessment of how sustainable this reduction is.
Dividend yield over the last 12 months is 3.8%, below the key rate
The dividend yield over the last 12 months is 3.8%. The company pays dividends, but the amount is modest relative to the current share price.
Our estimate for the current year's dividend depends on profit, which was negative in the third quarter. If one-off items recur, this could limit the payout base. The company's dividend policy is not disclosed in the facts, adding uncertainty.
A yield of 3.8% is below the key rate, making the dividend less attractive for income-oriented investors. For comparison, a higher yield could compensate for the risks associated with profit volatility.
The stock trades at EV/EBITDA of 3.6, below its historical average of 3.9, but the portal model implies 3% downside
The LTM EV/EBITDA multiple is 3.6, below the three-year historical average of 3.9. This means the stock trades cheaper than usual relative to its own history.
However, the portal model, which re-prices EBITDA at current commodity prices and the target multiple, implies 3% downside from the current price. This suggests that the market already reflects current conditions, and there is no significant upside potential.
The lower multiple may be due to concerns about the sustainability of profit and dividends. For investors, the current valuation looks fair but does not offer a clear advantage.
Valuation on the latest reported figures
| Metric | Value |
|---|---|
| Market cap | 0.95 bn USD |
| P/E (LTM) | 9.5 |
| EV/EBITDA (LTM) | 3.6 |
| P/B | 1.50 |
| Net debt / EBITDA (LTM) | 0.67 |
| Operating cash flow (LTM) | 0.29 bn |
| ROE | -1.5% |
| Dividend yield (12m) | 3.8% |
| EV/EBITDA, 3-year average | 3.9 |
Bottom line
Riley Exploration Permian's third-quarter 2026 report showed strong operational dynamics: revenue grew 88.3%, EBITDA rose 148.2%, and the margin reached 69.2%. However, net profit turned negative due to one-off items unrelated to core operations. Leverage is low, cash flow is strong, but the dividend yield is modest. The stock trades at EV/EBITDA of 3.6 versus a historical average of 3.9, but the portal model does not imply upside. The verdict is neutral: operational successes are offset by accounting losses and a lack of clear growth potential.
Open the company's financial profile REPX →
See also: market overview · valuation map · stock screeners