SandRidge Energy: revenue rose 36.6%, but profit nearly doubled on one-offs, not on production
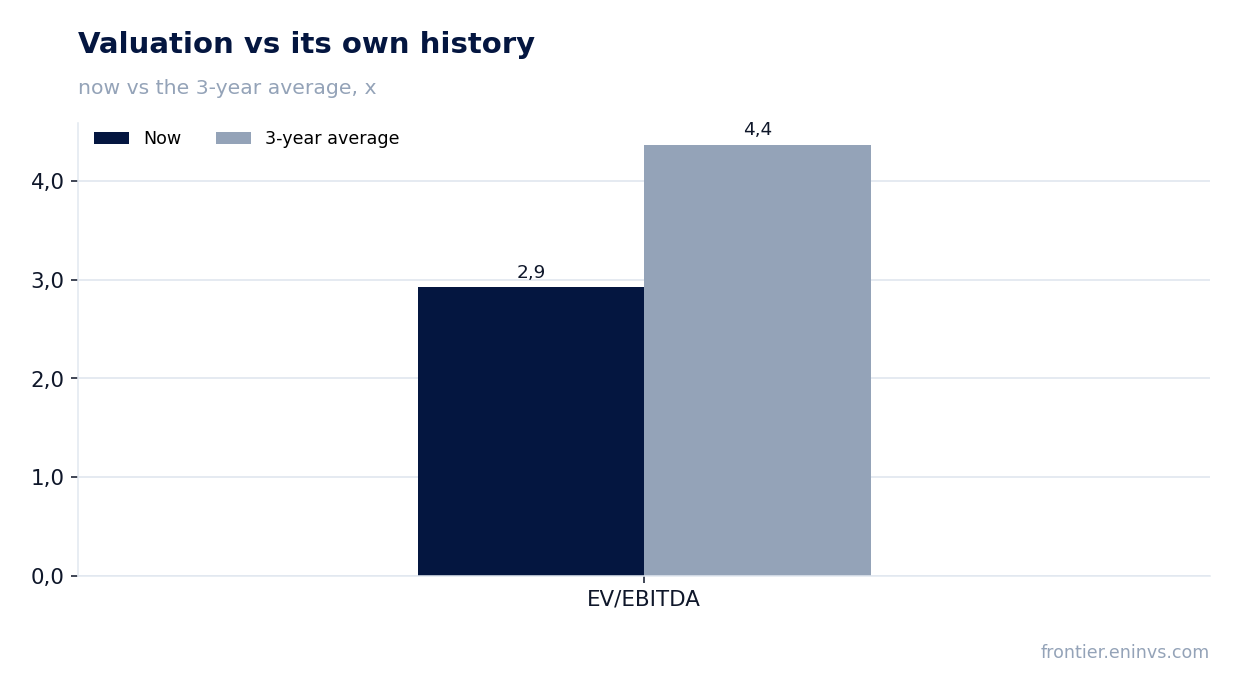
On November 4, SandRidge Energy reported results for the third quarter of 2026. Revenue came in at $54.4 million, up 36.6% year on year, EBITDA at $30.4 million, and net profit at $30.6 million, 91.9% higher than a year earlier. EBITDA margin, however, fell to 55.8% from 65.5%, and profit growth outpaced revenue growth because of one-off items. At the current price the share looks rather attractive: the EV/EBITDA multiple of 2.9 is below its own three-year average of 4.4, the dividend yield is 5.5%, and leverage is negative.
Key takeaways
— Revenue rose 36.6% year on year, but growth decelerated from 48.0% a quarter earlier
— EBITDA margin fell to 55.8% from 65.5%, the report's main contrast
— Net profit rose 91.9% while EBITDA grew 16.4% – the gap came from one-off items
— Operating cash flow was $32.1 million for the quarter and $126.0 million for the trailing twelve months
— Net debt is negative at -$93.8 million, or -0.74x trailing EBITDA
— The 5.5% dividend yield is backed by cash flow the company can fund
— EV/EBITDA of 2.9 is 33% below its own three-year average of 4.4 – the share is cheaper than its history
Attractiveness
Key figures, USD bn
| Metric | Q3 2025 | Q3 2026 | Change |
|---|---|---|---|
| Revenue | 0.04 | 0.05 | +36.6% |
| EBITDA | 0.03 | 0.03 | +16.4% |
| Operating profit | 0.02 | 0.02 | +4.6% |
| Net profit | 0.02 | 0.03 | +91.9% |
| Operating cash flow | 0.03 | 0.03 | +27.2% |
| Capex | 0.02 | — | — |
| EBITDA margin | 65.5% | 55.8% | -9.7 pp |
| Net margin | 40.1% | 56.3% | +16.2 pp |
Revenue rose 36.6% year on year, but growth decelerated from 48.0% a quarter earlier
Revenue for the third quarter of 2026 was $54.4 million, 36.6% above the level of the third quarter of 2025. That is a strong result, but it is more modest than the previous quarter: in the second quarter of 2026 growth was 48.0%, so there is a deceleration. The deceleration does not cancel the fact that the company has grown at double-digit rates for a second consecutive quarter.
Revenue growth rests on commodity prices and production volumes, but the report does not break them out in a way that would separate one from the other. Over the trailing twelve months revenue was $194.7 million – the level the company shows at current hydrocarbon prices. For an investor, what matters is that revenue growth is not accompanied by a fall in cash flow: operating cash flow for the quarter was $32.1 million.
EBITDA margin fell to 55.8% from 65.5%, the report's main contrast
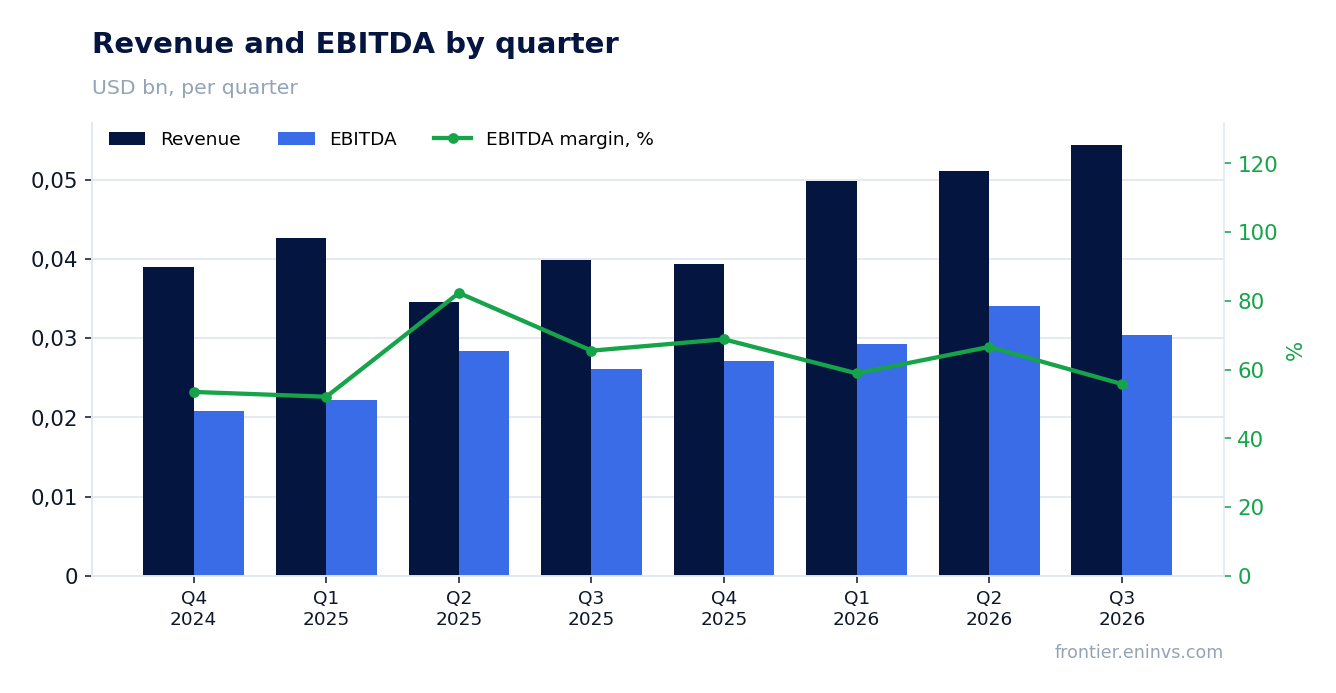
EBITDA for the third quarter of 2026 was $30.4 million, up 16.4% year on year. That is noticeably slower than revenue growth of 36.6%, so EBITDA margin fell to 55.8% from 65.5% a year earlier. The 9.7 percentage point gap is the report's most visible signal: the company sells more, but each unit of revenue brings less operating profit.
Operating profit for the quarter was $15.7 million, and it grew more slowly than EBITDA, pointing to higher depreciation or other operating costs. The report does not break out cost lines, so the specific cause of the margin decline cannot be named. For an investor, what matters is that the margin remains high in absolute terms – 55.8% – and the company retains the ability to generate cash flow.
Net profit rose 91.9% while EBITDA grew 16.4% – the gap came from one-off items
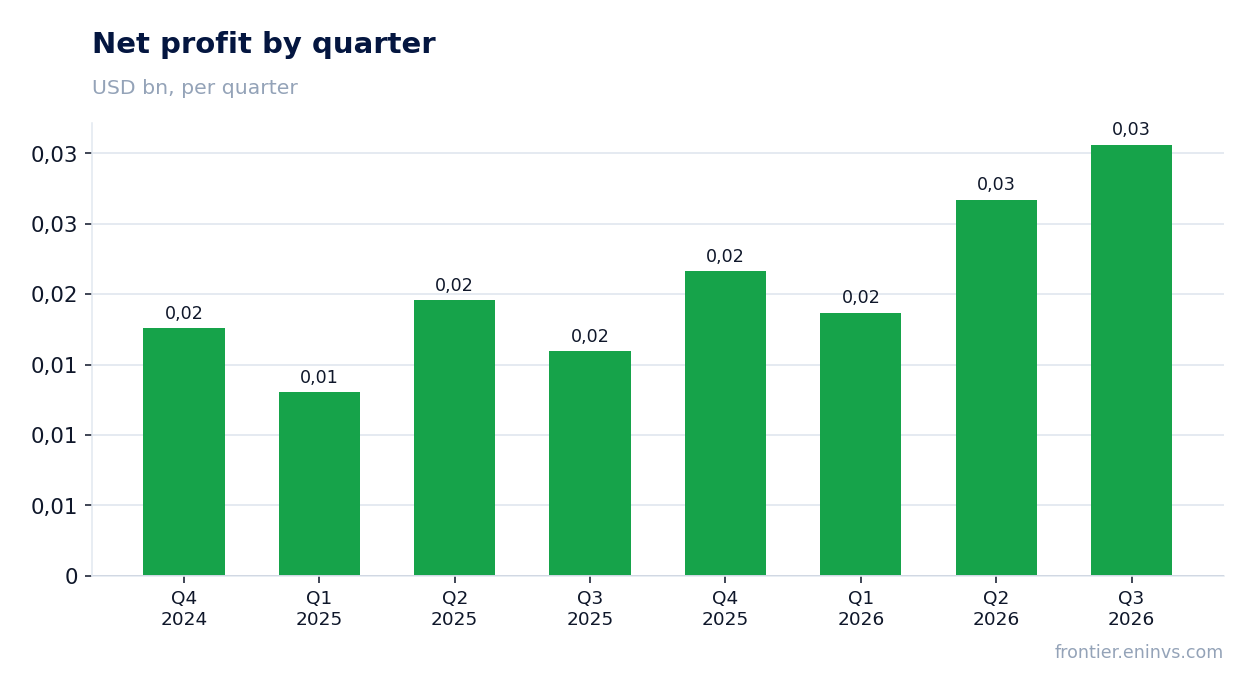
Net profit for the third quarter of 2026 was $30.6 million, 91.9% above the level a year earlier. Profit growth was almost double EBITDA growth of 16.4%, and this gap cannot be explained by operating dynamics. Profit grew faster than revenue and EBITDA, which means it contains items unrelated to production.
Net margin rose to 56.3% from 40.1% a year earlier – profit exceeds half of revenue, which is unusual for an upstream company and points to the one-off nature of part of the result. The report does not disclose which line produced this effect, so the sustainability of profit at $30.6 million per quarter is not confirmed. For valuing the company it is safer to rely on EBITDA and cash flow rather than net profit.
Operating cash flow was $32.1 million for the quarter and $126.0 million for the trailing twelve months
Operating cash flow for the third quarter of 2026 was $32.1 million – it exceeds EBITDA, indicating a positive working capital contribution. Over the trailing twelve months the flow reached $126.0 million against EBITDA of $127.3 million, meaning the company converts operating profit into cash almost fully. This is SandRidge Energy's key advantage over companies that have profit but no cash.
Capital expenditure is not disclosed in the third-quarter report, but previous quarters show the company spends $15–20 million per quarter on investment. With operating cash flow of $32.1 million, that leaves free money for dividends and for maintaining negative net debt. It is cash flow, not net profit, that determines the company's ability to pay dividends.
Net debt is negative at -$93.8 million, or -0.74x trailing EBITDA
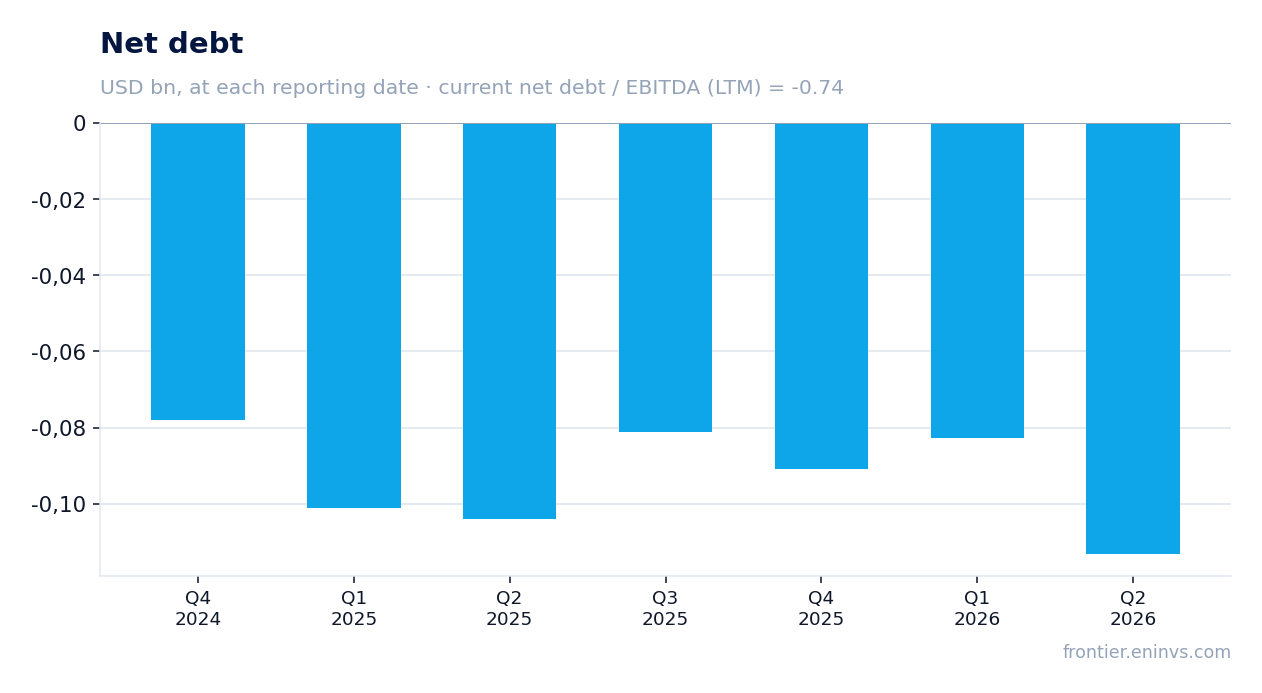
At the latest annual balance sheet, SandRidge Energy's net debt was -$93.8 million, meaning cash exceeds debt obligations. The ratio of net debt to trailing twelve-month EBITDA is -0.74. This is a level at which the company does not depend on borrowed funding and can direct free money to shareholder payouts.
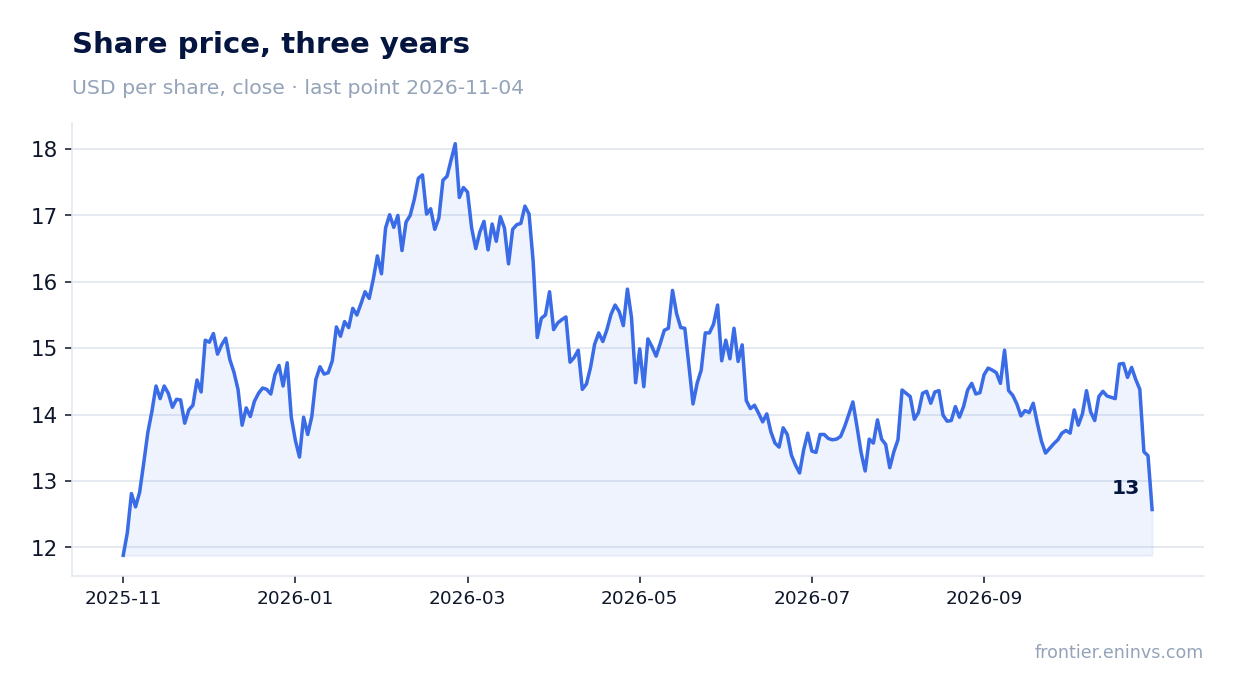
Negative net debt is the result of an accumulated cash cushion, not a one-off event. With a market capitalisation of $466.0 million, net cash is about a fifth of the company's value. For an investor this means the risk of debt pressure on the share is minimal, and dividend policy is not constrained by covenants.
The 5.5% dividend yield is backed by cash flow the company can fund
SandRidge Energy's trailing twelve-month dividend yield is 5.5%. The company pays dividends from free cash flow, which over the trailing twelve months amounted to $126.0 million of operating flow with capital expenditure of about $15–20 million per quarter. Such a flow covers payouts with a margin, and negative net debt confirms that dividends are not financed through borrowing.
Our estimate of the current-year dividend assumes the current yield and stable cash flow are maintained. The payout depends on profit, which in the third quarter was boosted by one-off items; if those items do not recur, profit may be lower, but cash flow will not suffer as a result. A 5.5% yield, with the key rate not given in the facts, looks moderate, but stability of payments matters more than the absolute level.
EV/EBITDA of 2.9 is 33% below its own three-year average of 4.4 – the share is cheaper than its history
The trailing twelve-month EV/EBITDA multiple is 2.9 against its own three-year average of 4.4 – the share trades 33% below its history. The trailing P/E is 4.8, also pointing to a low valuation. A market capitalisation of $466.0 million with negative net debt of $93.8 million means the investor pays less for the business than it is worth including the cash cushion.
On the portal's model, which reprices EBITDA at current commodity prices at the target EV/EBITDA, the share's upside to fair value is -23%. This is our own estimate, not a market consensus. It suggests that at current hydrocarbon prices the share may be overvalued relative to the model, even though historically it trades cheaper than itself.
Valuation on the latest reported figures
| Metric | Value |
|---|---|
| Market cap | 0.47 bn USD |
| P/E (LTM) | 4.8 |
| EV/EBITDA (LTM) | 2.9 |
| P/B | 0.91 |
| Net debt / EBITDA (LTM) | -0.74 |
| Operating cash flow (LTM) | 0.13 bn |
| ROE | 22.0% |
| Dividend yield (12m) | 5.5% |
| EV/EBITDA, 3-year average | 4.4 |
Bottom line
The report's strength remains cash flow: $32.1 million for the quarter and $126.0 million for twelve months with negative net debt. The weak spot is the fall in EBITDA margin to 55.8% from 65.5% and the one-off nature of 91.9% net profit growth. The share trades 33% below its three-year average on EV/EBITDA, but the portal's model shows -23% to fair value. The verdict is rather attractive: the dividend and cash flow outweigh, but confirmation requires the next report without one-off items.
Open the company's financial profile SD →
See also: market overview · valuation map · stock screeners