Spartan Delta: revenue doubled, but profit rose only a quarter as margin normalised
Spartan Delta reported second-quarter 2026 results. Revenue rose 112.1% year on year to $137.8 million, EBITDA grew 43.8% to $80.7 million, and net profit increased 25.9% to $30.5 million. Revenue growth accelerated from 67.4% in the first quarter of 2026, but the EBITDA margin fell to 58.5% from 86.3% a year earlier, and the net margin declined to 22.1% from 37.3%. Leverage remains moderate at 0.8 times trailing twelve-month EBITDA. The stock trades at 10.2 times trailing twelve-month EBITDA versus its three-year average of 5.4, which limits its appeal despite strong revenue. Verdict – neutral: revenue growth is impressive, but profitability has normalised and the multiple is above its own history.
Key takeaways
— Revenue in Q2 2026 grew 112.1% year on year to $137.8 million, accelerating from 67.4% in Q1
— EBITDA rose 43.8% year on year, but its margin fell to 58.5% from 86.3% – revenue growth outpaces profit growth
— Net profit increased 25.9% year on year to $30.5 million, while the net margin dropped to 22.1% from 37.3%
— Operating cash flow was $81.1 million, below EBITDA due to working capital and interest
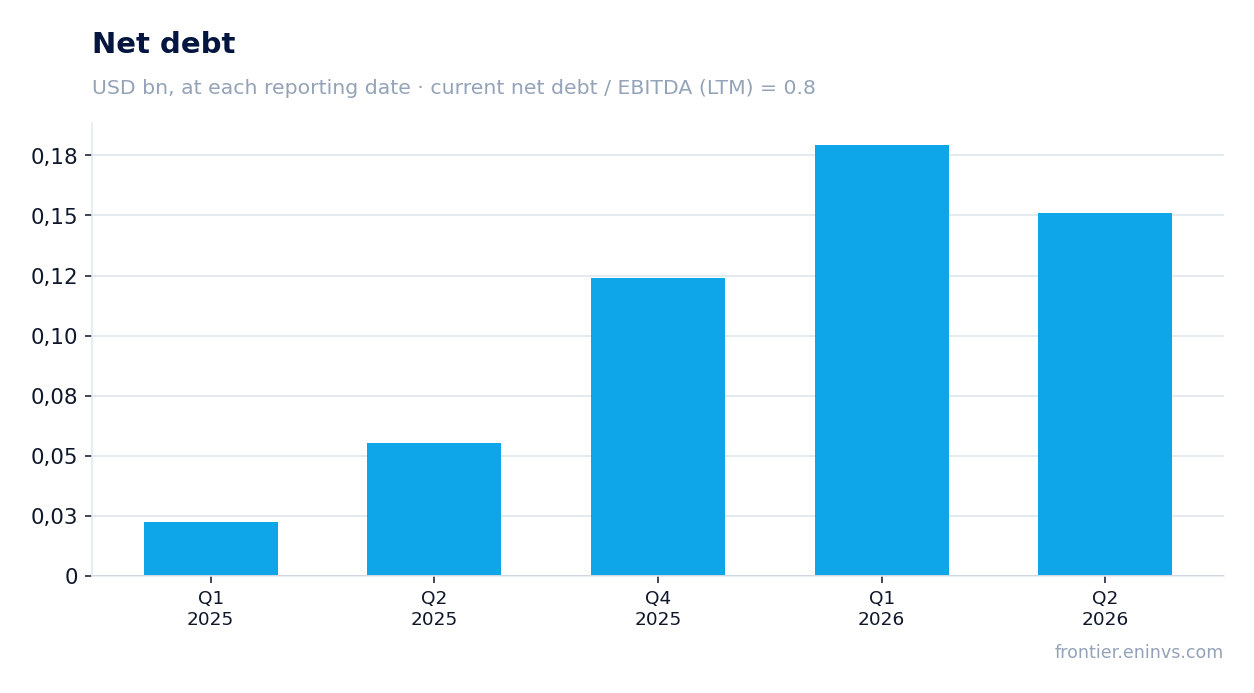
— Net debt at 30 June 2026 was $151.1 million, or 0.8 times trailing twelve-month EBITDA
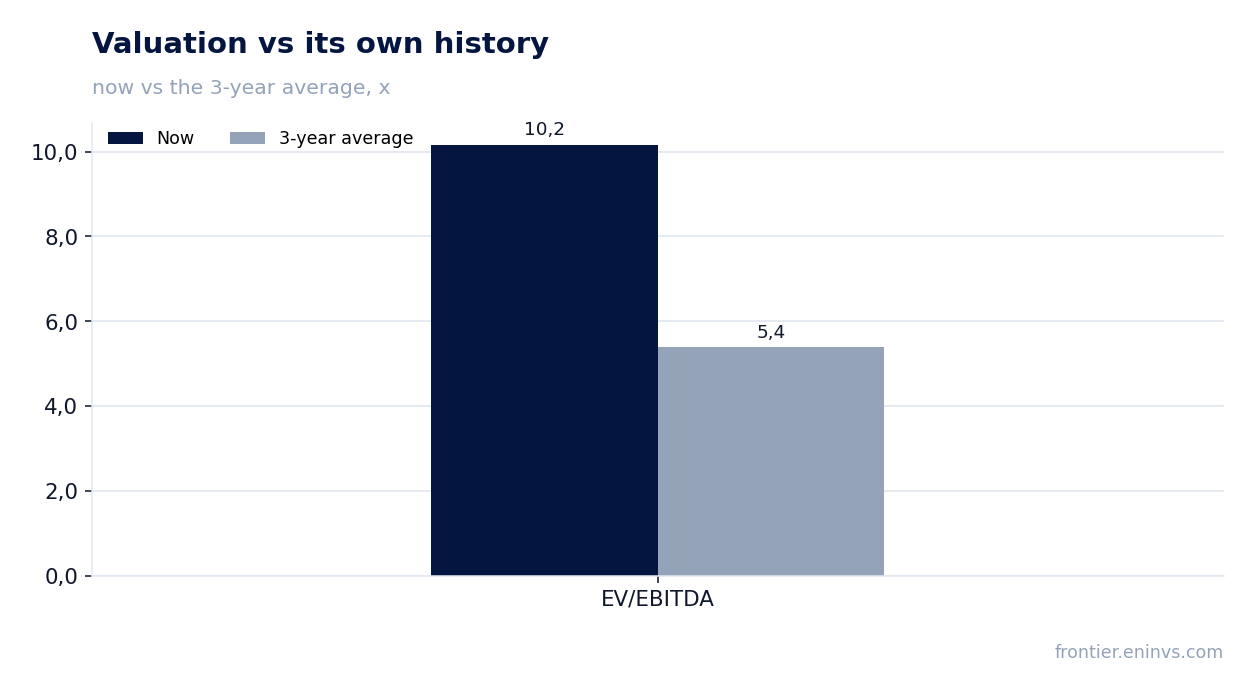
— The stock trades at 10.2 times EV/EBITDA versus its three-year average of 5.4 – valuation above its own history
— The portal's model implies 21% upside to fair value
Attractiveness
Key figures, USD bn
| Metric | Q2 2025 | Q2 2026 | Change |
|---|---|---|---|
| Revenue | 0.06 | 0.14 | +112.1% |
| EBITDA | 0.06 | 0.08 | +43.8% |
| Operating profit | 0.01 | 0.04 | +538.1% |
| Net profit | 0.02 | 0.03 | +25.9% |
| Operating cash flow | 0.03 | 0.08 | +157.1% |
| EBITDA margin | 86.3% | 58.5% | -27.8 pp |
| Net margin | 37.3% | 22.1% | -15.2 pp |
Revenue in Q2 2026 grew 112.1% year on year to $137.8 million, accelerating from 67.4% in Q1
Spartan Delta's revenue in Q2 2026 was $137.8 million, up 112.1% year on year. This is an acceleration from Q1 2026, when growth was 67.4%. The company is growing sales faster than at the start of the year.
The revenue increase is partly explained by a low base in Q2 2025, when revenue was $65.0 million. The sequential increase from Q1 2026 ($110.6 million) also confirms positive momentum. However, without data on volumes and prices, it is difficult to judge how sustainable this growth is.
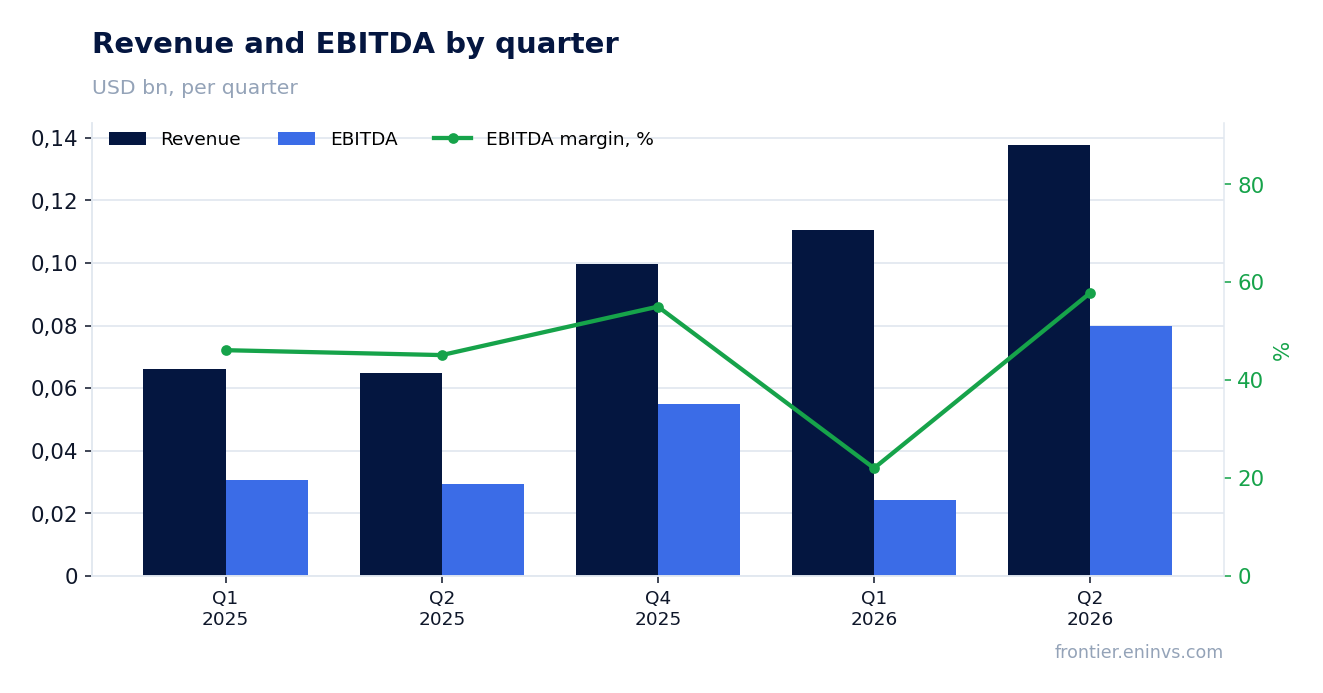
EBITDA rose 43.8% year on year, but its margin fell to 58.5% from 86.3% – revenue growth outpaces profit growth
EBITDA in Q2 2026 was $80.7 million, up 43.8% year on year. However, the EBITDA margin fell to 58.5% from 86.3% in Q2 2025. This means costs are growing faster than revenue, and operating efficiency is declining.
The margin decline may be due to higher production costs or a change in sales mix. Without a cost breakdown in the press release, the exact cause is unclear. Nevertheless, a 58.5% margin remains high, but no longer as exceptional as a year earlier.
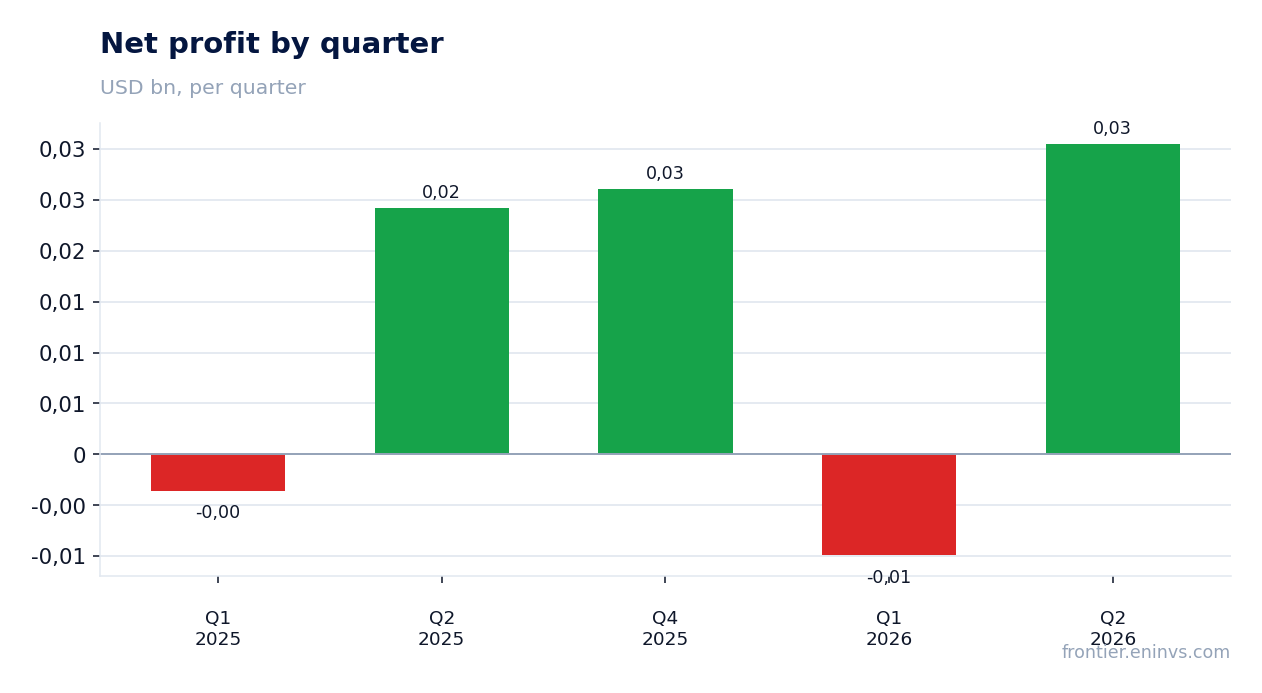
Net profit increased 25.9% year on year to $30.5 million, while the net margin dropped to 22.1% from 37.3%
Net profit in Q2 2026 was $30.5 million, up 25.9% year on year. Profit growth significantly lags revenue growth, which led to a drop in the net margin to 22.1% from 37.3%. This reflects both lower operating margin and possibly higher interest or taxes.
Operating profit for the quarter was $43.0 million, also lower than one might expect given the revenue. The gap between EBITDA and net profit includes depreciation, interest, and taxes. Without a breakdown of these items, it is difficult to pinpoint exactly what eroded profit, but the overall trend is a normalisation of profitability after an abnormally high level a year ago.
Operating cash flow was $81.1 million, below EBITDA due to working capital and interest
Operating cash flow in Q2 2026 was $81.1 million, slightly above EBITDA ($80.7 million). This indicates the company manages working capital efficiently, and cash flow matches operating profit. However, relative to revenue of $137.8 million, cash conversion appears moderate.
There is no data on capital expenditures in the facts, so free cash flow cannot be assessed. If capex is significant, free cash flow may be lower. Nevertheless, positive operating cash flow supports the ability to service debt and fund development.
Net debt at 30 June 2026 was $151.1 million, or 0.8 times trailing twelve-month EBITDA
Net debt at 30 June 2026 was $151.1 million. It decreased from $179.4 million at 31 March 2026, but increased year on year from $55.5 million at 30 June 2025. The net debt to trailing twelve-month EBITDA ratio is 0.8, a comfortable level. The company maintains low leverage.
The year-on-year increase in debt is likely due to investments or acquisitions, but the exact reason is not stated. Given the low 0.8 ratio, leverage is not a concern. Interest expenses are probably moderate, supporting net profit.
The stock trades at 10.2 times EV/EBITDA versus its three-year average of 5.4 – valuation above its own history
The current trailing twelve-month EV/EBITDA is 10.2, significantly above the three-year average of 5.4. This means the market values the company more expensively than usual. The trailing twelve-month P/E is 32.0, which may also indicate an overvaluation if profit does not grow rapidly.
Revenue growth and low leverage could justify a premium, but the company needs to demonstrate sustainable profit growth. So far, net profit is growing slower than revenue, creating a risk of multiple contraction. According to the portal's model, upside to fair value is 21%, suggesting some cushion but not a large one.
The portal's model implies 21% upside to fair value
Our model, which reprices EBITDA at current commodity prices at a target EV/EBITDA, estimates 21% upside to fair value. This is the portal's own estimate, not a market consensus. It suggests the current share price is somewhat undervalued relative to fundamental value.
However, the model is sensitive to assumptions about prices and the multiple. If profit continues to grow slower than revenue, fair value could be lower. The 21% upside looks moderately attractive but is not a guarantee.
Valuation on the latest reported figures
| Metric | Value |
|---|---|
| Market cap | 1.80 bn USD |
| P/E (LTM) | 32.0 |
| EV/EBITDA (LTM) | 10.2 |
| P/B | 3.80 |
| Net debt / EBITDA (LTM) | 0.80 |
| Operating cash flow (LTM) | 0.21 bn |
| ROE | 25.1% |
| EV/EBITDA, 3-year average | 5.4 |
Bottom line
Spartan Delta delivered strong revenue growth of 112.1% year on year, accelerating from 67.4% in Q1. However, profitability normalised: EBITDA margin fell to 58.5%, net margin to 22.1%. Leverage remains low at 0.8 times trailing twelve-month EBITDA, and operating cash flow matches EBITDA. The key question for a holder is valuation: EV/EBITDA of 10.2 versus the three-year average of 5.4. The portal's model implies 21% upside, which does not outweigh the risk of multiple compression if profit growth slows. Verdict – neutral.
Open the company's financial profile SDE →
See also: market overview · valuation map · stock screeners