Spartan Delta: revenue tripled, but at WTI $85.4 EBITDA came in $12.1m below what the price implied
On 6 November Spartan Delta reported results for the third quarter of 2026. The average WTI price in the period was $85.4 versus $64.9 a year earlier (+31.7%), Henry Hub was $2.893 versus $3.083 (-6.2%), and propane was $0.73 versus $0.69 (+5.8%). Revenue reached $144.2m (+140.3% year on year), EBITDA was $48.8m and net profit $2.9m. On our calculation, at year-ago volumes and costs and moving only prices, revenue would have been $70.1m and EBITDA $36.7m, so the company earned $12.1m more than the price-implied figure, yet EBITDA came in $22.8m below what the previous quarter's prices implied. The share looks neutral: EV/EBITDA of 9.2 is above its own three-year average of 5.6, while the portal's spot model puts the upside at +43%.
Key takeaways
— WTI rose 31.7% year on year, but gas fell 6.2%, which capped the price effect
— Revenue added 140.3% year on year while EBITDA added only 83.1%, as the margin compressed from 44.4% to 33.8%
— On our calculation, at the previous quarter's prices EBITDA should have been $71.5m, but reported EBITDA was $48.8m – a gap of $22.8m
— Capex of $125.1m exceeded operating cash flow of $65.8m, and net debt rose to $181.5m
— Net debt at 0.9x LTM EBITDA is a moderate burden, but at current prices it falls to 0.62x
— EV/EBITDA of 9.2 is 65% above its own three-year average of 5.6, and that is the main argument against buying
— On the portal's spot model, EBITDA at today's prices is $291.7m versus $208.6m LTM, and the share's upside is +43%
Attractiveness
Key figures, USD bn
| Metric | Q3 2025 | Q3 2026 | Change |
|---|---|---|---|
| Revenue | 0.06 | 0.14 | +140.3% |
| EBITDA | 0.03 | 0.05 | +83.1% |
| Operating profit | -0.00 | 0.01 | to profit |
| Net profit | 0.00 | 0.00 | -25.6% |
| Operating cash flow | 0.04 | 0.07 | +67.9% |
| EBITDA margin | 44.4% | 33.8% | -10.6 pp |
| Net margin | 6.4% | 2.0% | -4.4 pp |
WTI rose 31.7% year on year, but gas fell 6.2%, which capped the price effect
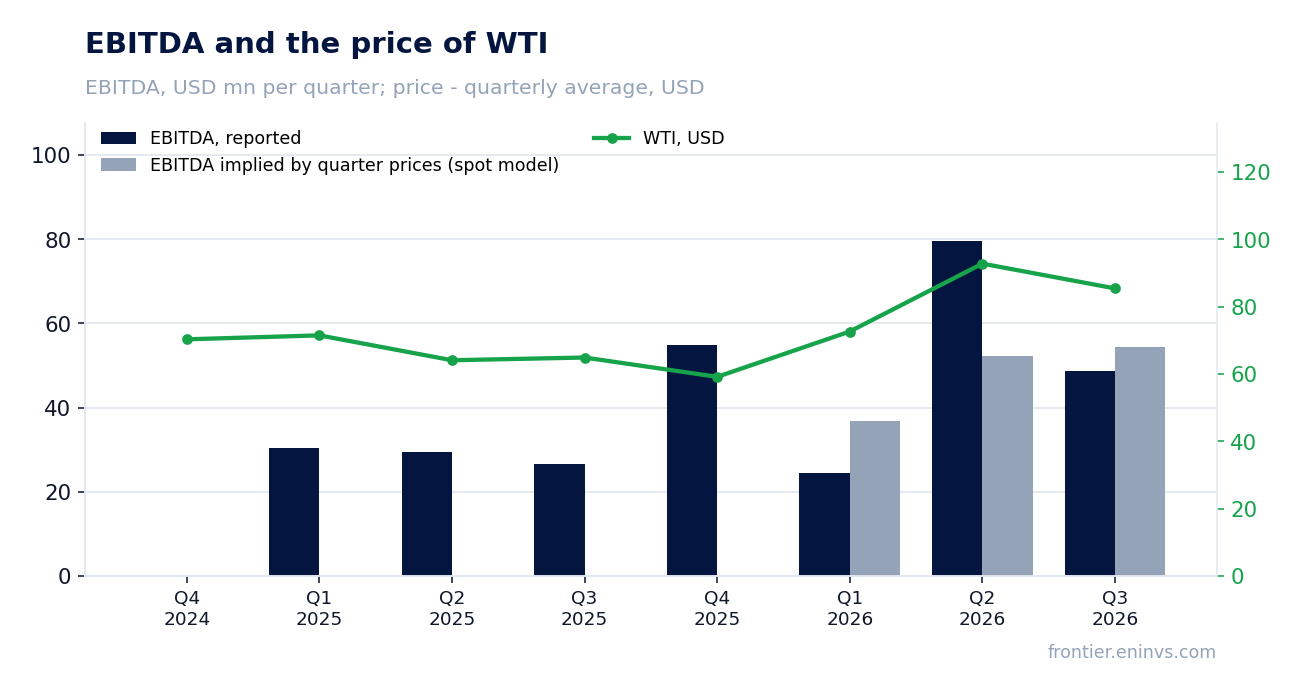
The average WTI price in the third quarter of 2026 was $85.4 versus $64.9 a year earlier, up 31.7%. Against the previous quarter the price fell 7.9%, from $92.8. At the time of the report the WTI spot price is $91.3, 6.9% above the average for the reporting period.
US Henry Hub gas averaged $2.893 versus $3.083 a year earlier, down 6.2%. Against the previous quarter the decline was 1.1%. The spot price is now $3.02, 4.4% above the quarterly average.
Propane rose 5.8% year on year, from $0.69 to $0.73, but fell 8.6% against the previous quarter. The propane spot price is now $1.195, 63.7% above the average for the reporting period. In the portal model WTI accounts for 55% of revenue, gas for 25% and propane for 15%.
Commodity prices: period average and now
| Benchmark | Year ago | Q3 2026 | YoY | Spot 2026-11-06 |
|---|---|---|---|---|
| WTI, USD | 64,9 | 85,4 | +31,7% | 91,3 |
| Henry Hub, USD | 3,08 | 2,89 | -6,2% | 3,02 |
| Propane, USD | 0,69 | 0,73 | +5,8% | 1,20 |
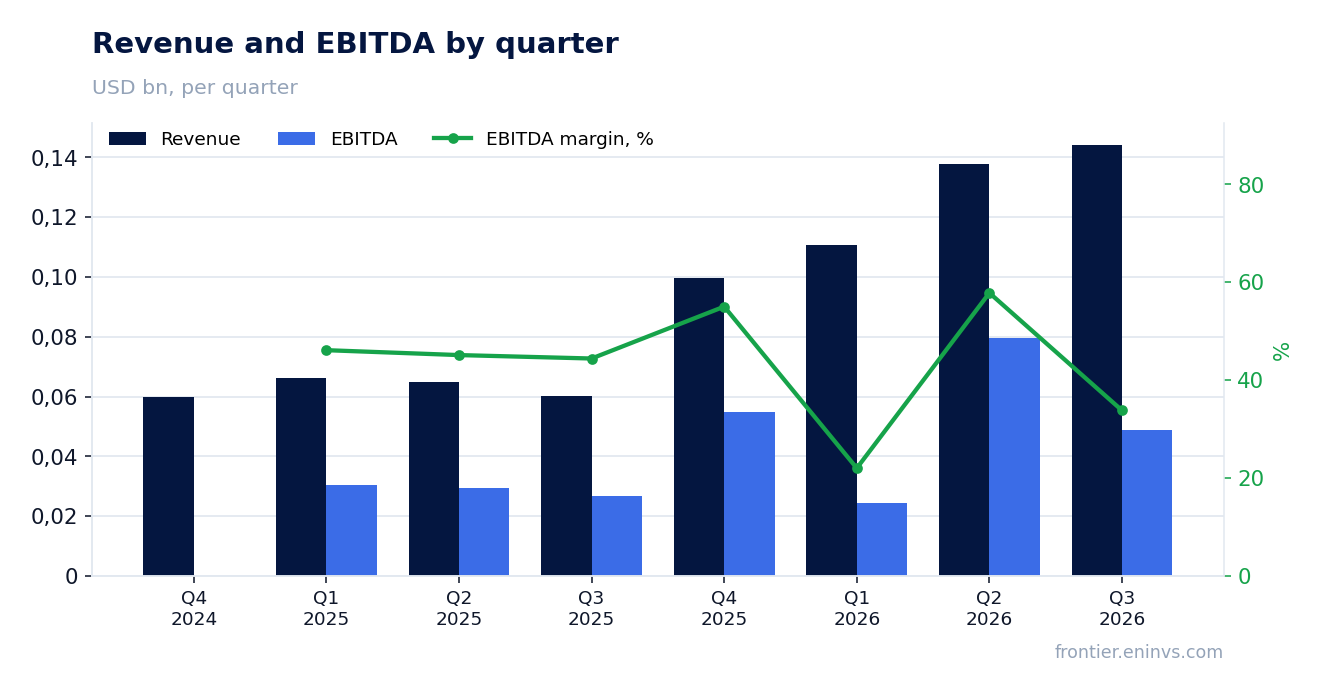
Revenue added 140.3% year on year while EBITDA added only 83.1%, as the margin compressed from 44.4% to 33.8%
Revenue in the third quarter of 2026 was $144.2m versus $60.0m a year earlier, up 140.3%. That is an acceleration from the second quarter, when growth was 112.1%. EBITDA rose 83.1% to $48.8m, while operating profit was $8.0m.
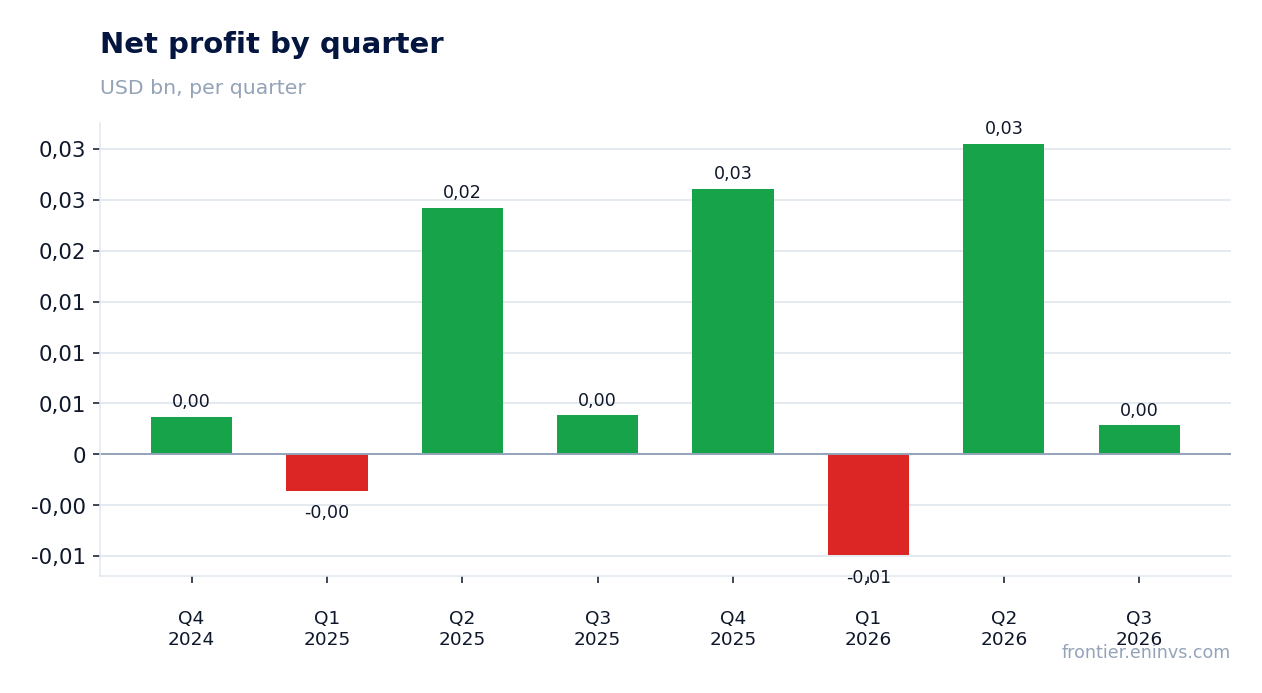
The EBITDA margin fell from 44.4% to 33.8%, and the net margin from 6.4% to 2.0%. Net profit declined 25.6% to $2.9m. Depreciation and amortisation within EBITDA was $40.7m, and that explains the gap between operating profit of $8.0m and EBITDA of $48.8m.
On our calculation, at year-ago volumes and non-commodity costs and moving only prices, revenue would have been $70.1m (price effect +$10.0m, or +16.7%) and EBITDA $36.7m. Reported revenue exceeded that benchmark by $74.2m (+105.8%) and EBITDA by $12.1m (+32.9%). The gap is explained by volumes and the sales mix, but the facts give no precise production data.
What the prices implied and what the company earned
| Base (Q3 2025) | Implied at period prices | Reported | Reported vs implied | |
|---|---|---|---|---|
| Revenue, USD mn | 60,0 | 70,1 | 144,2 | +105,8% |
| EBITDA, USD mn | 26,6 | 36,7 | 48,8 | +32,9% |
| EBITDA, portal spot model, USD mn | — | 54,5 | 48,8 | -10,5% |
On our calculation, at the previous quarter's prices EBITDA should have been $71.5m, but reported EBITDA was $48.8m – a gap of $22.8m
Holding the volumes and non-commodity costs of the second quarter of 2026 and moving only prices, revenue would have been $129.6m (price effect -$8.2m, or -5.9%) and EBITDA $71.5m. Reported revenue was $14.6m higher (+11.3%), but EBITDA was $22.8m lower (-31.8%).
That gap means the sequential revenue growth did not translate into EBITDA growth: costs or the sales mix absorbed the price effect. The facts give no breakdown by unit costs or volumes, so the specific cause cannot be named.
The portal's spot model, re-priced from the average of the previous four quarters, expected EBITDA of $54.5m and revenue of $111.3m. Reported EBITDA was 10.5% below the model's expectation, while revenue was 29.6% above. The deviation of EBITDA from the model in the two prior periods was -33.8% and +54.7%, so the model is sensitive to one-off quarters in its base.
Capex of $125.1m exceeded operating cash flow of $65.8m, and net debt rose to $181.5m
Operating cash flow in the third quarter of 2026 was $65.8m, while capex was $125.1m. Investment was almost twice the operating flow, and the gap was financed with debt. Net debt at 30 September 2026 was $181.5m versus $151.1m at 30 June 2026.
Over the year net debt rose from $151.1m to $181.5m, an increase of $30.4m. The ratio of net debt to LTM EBITDA is 0.9, a moderate level for a producer. At current prices, on the portal's spot model, that ratio falls to 0.62.
Capex on this scale is the reinvestment that sustains production. With a stated reserve life of 21.2 years at the current production rate, the company can maintain output, but free cash flow after capex was negative in this quarter.
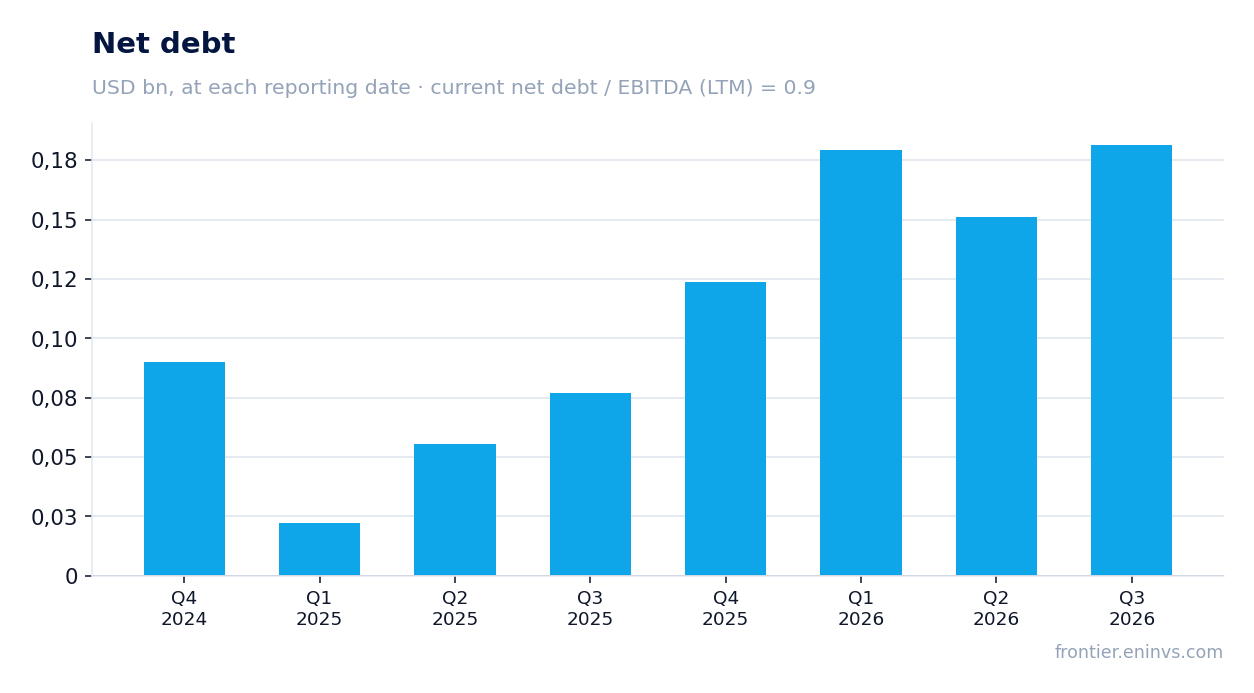
Net debt at 0.9x LTM EBITDA is a moderate burden, but at current prices it falls to 0.62x
Net debt at 30 September 2026 was $181.5m, or 0.9x LTM EBITDA. That is a level that does not pressure the balance sheet, but it also leaves little room for new borrowing if prices fall.
On the portal's spot model, at today's prices LTM EBITDA would be $291.7m versus the actual $208.6m, and the ratio of net debt to EBITDA would fall to 0.62. That shows how much the current debt burden depends on commodity prices.
Interest expense and other items below operating profit are not included in EBITDA, so their effect is visible only in net profit. Net profit for the quarter was $2.9m, and its 25.6% decline alongside 83.1% EBITDA growth is explained by those items.
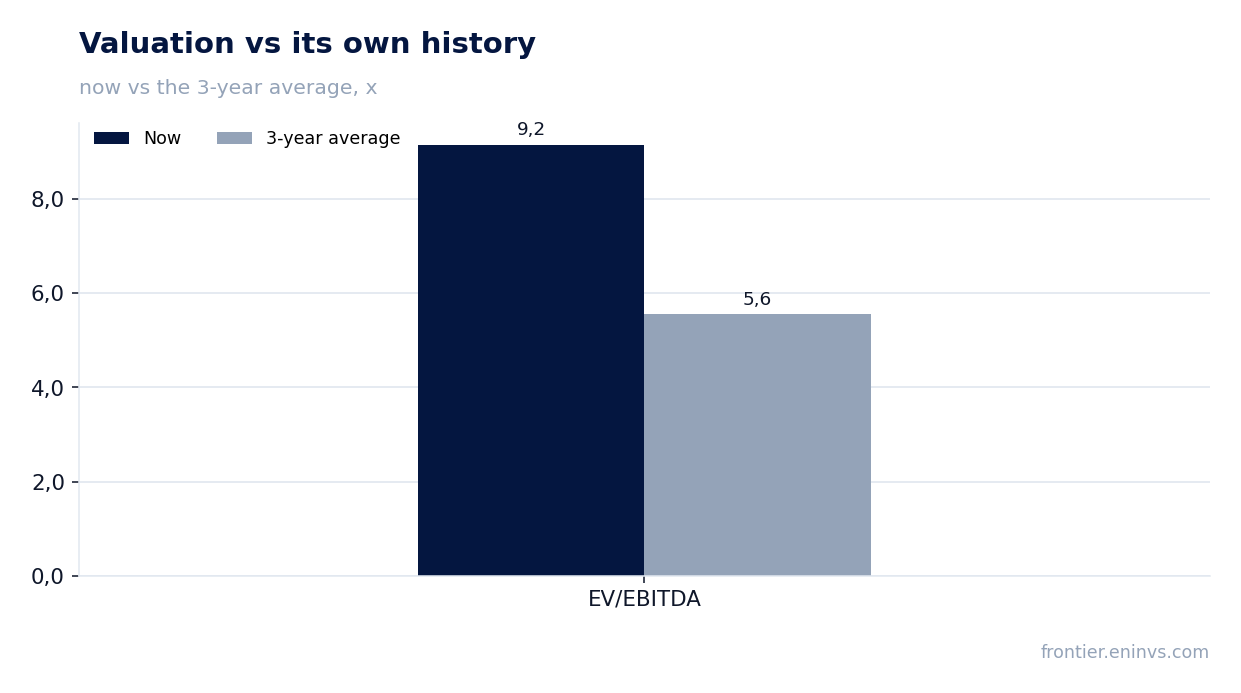
EV/EBITDA of 9.2 is 65% above its own three-year average of 5.6, and that is the main argument against buying
The LTM EV/EBITDA multiple is 9.2 against its own three-year average of 5.6, so the share trades 65% above its history. LTM P/E is 34.7 and the market capitalisation is $1,718.8m. That valuation assumes either sustained high prices or significant EBITDA growth.
At current prices, on the portal's spot model, EV/EBITDA falls to 6.5, which is closer to the historical average. That is a key argument that the current share price reflects not only past but also future prices.
On the portal's model, the fair value of the share implies +43% upside to the current price. That is our own estimate, not a market consensus. It rests on re-pricing EBITDA to current prices at a target multiple.
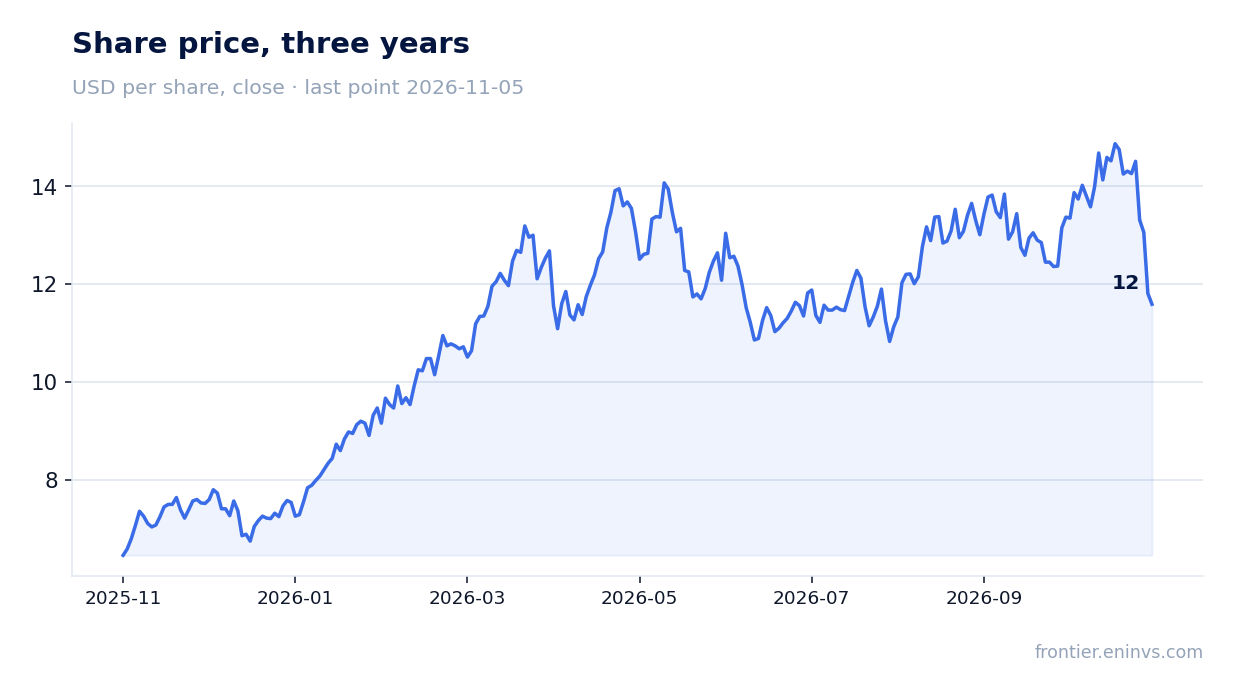
On the portal's spot model, EBITDA at today's prices is $291.7m versus $208.6m LTM, and the share's upside is +43%
The WTI spot price is now $91.3, 6.9% above the average for the reporting period, and propane is $1.195, 63.7% higher. At such prices, on the portal's spot model, annual EBITDA is $291.7m versus $208.6m LTM, or 39.8% higher. EV/EBITDA on that basis is 6.5 and net debt to EBITDA is 0.62.
That valuation should be the starting point for an investor, since LTM reflects past prices. However, the model is sensitive to assumptions: the deviation of reported EBITDA from the model in prior periods ranged from -33.8% to +54.7%.
A reserve life of 21.2 years at the current production rate gives the company a long horizon, but does not remove its dependence on prices. The +43% upside on the portal's model is our estimate, and it materialises only if current prices hold.
Valuation on the latest reported figures
| Metric | Value |
|---|---|
| Market cap | 1.72 bn USD |
| P/E (LTM) | 34.7 |
| EV/EBITDA (LTM) | 9.2 |
| P/B | 3.63 |
| Net debt / EBITDA (LTM) | 0.90 |
| Operating cash flow (LTM) | 0.26 bn |
| ROE | 2.2% |
| EV/EBITDA, 3-year average | 5.6 |
Bottom line
The quarter's strength was revenue growth of 140.3% and EBITDA growth of 83.1% – the company earned $12.1m more than year-ago prices implied. However, relative to the previous quarter's prices EBITDA was $22.8m lower, and capex of $125.1m exceeded operating cash flow of $65.8m, lifting net debt to $181.5m. The main question for a holder is valuation: EV/EBITDA of 9.2 against its own three-year average of 5.6, and only at current prices does the multiple fall to 6.5. The +43% upside on the portal's model looks attractive, but it depends entirely on WTI holding near $91. The verdict is neutral.
Open the company's financial profile SDE →
See also: market overview · valuation map · stock screeners