Surge Energy: profit tripled, but almost all of it came from EBITDA recovering off a low base
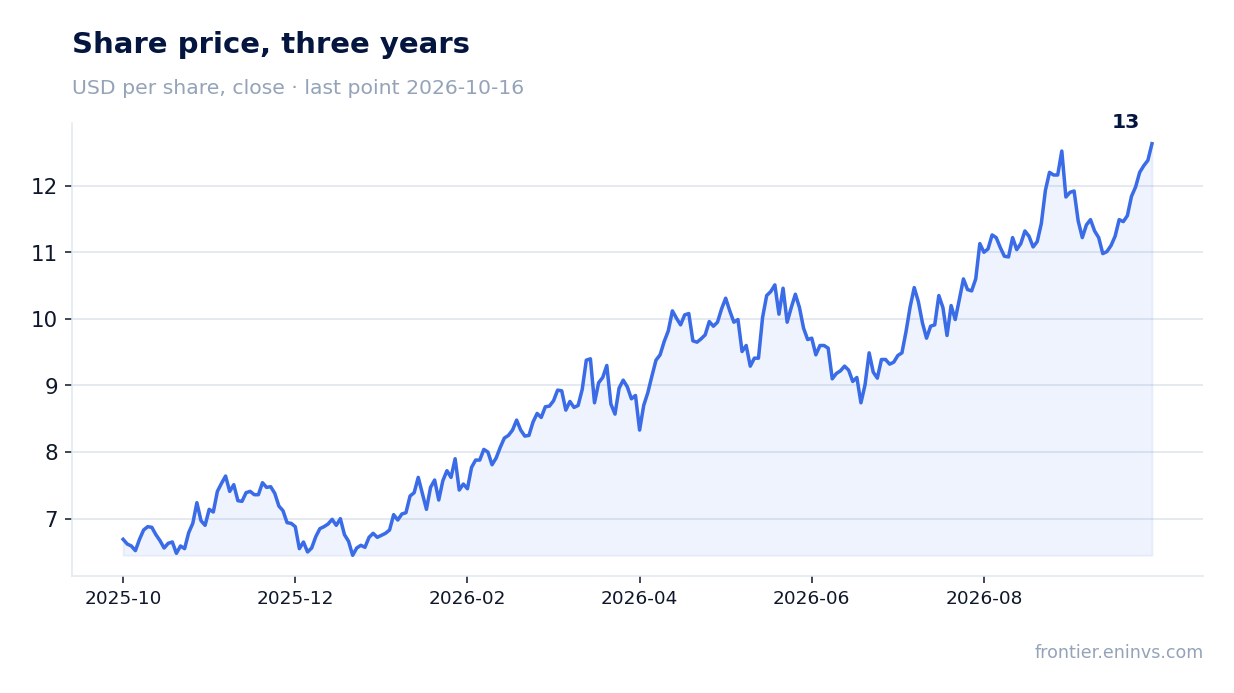
Surge Energy reported second-quarter 2026 revenue of $151.7m, up 46.6% year on year, and net profit of $49.9m versus $23.1m a year earlier. EBITDA jumped to $90.0m (+79.1%), with the margin reaching 59.4% against 48.6% a year earlier. Leverage is moderate at 0.62x trailing-twelve-month EBITDA, while a 4.1% dividend yield looks modest against the valuation: EV/EBITDA of 5.3x is 74% above its own three-year average. The share looks neutral: the strong report is already in the price, and the portal's model implies 26% downside to fair value.
Key takeaways
— Revenue rose 46.6% year on year to $151.7m, but almost the entire gain came from a single quarter after a weak start to the year
— EBITDA jumped 79.1% to $90.0m, and the 59.4% margin rests on last year's low base
— Net profit of $49.9m more than doubled, but there were no one-off sales in it — the entire effect came from operating leverage
— Debt of $121.1m is just 0.62x trailing-twelve-month EBITDA, and it barely changed over the year
— Free cash flow of $68.5m for the quarter covers the dividend with room to spare, but capital expenditure is not disclosed in the report
— A 4.1% dividend yield is modest for a commodity company and does not offset a 5.3x EBITDA valuation
— The EV/EBITDA multiple of 5.3x is 74% above its own three-year average of 3.0 — the market already believes in a durable recovery
Attractiveness
Key figures, USD bn
| Metric | Q2 2025 | Q2 2026 | Change |
|---|---|---|---|
| Revenue | 0.10 | 0.15 | +46.6% |
| EBITDA | 0.05 | 0.09 | +79.1% |
| Operating profit | 0.02 | 0.06 | +187.2% |
| Net profit | 0.02 | 0.05 | +116.2% |
| Operating cash flow | 0.04 | 0.07 | +68.2% |
| EBITDA margin | 48.6% | 59.4% | +10.8 pp |
| Net margin | 22.3% | 32.9% | +10.6 pp |
Revenue rose 46.6% year on year to $151.7m, but almost the entire gain came from a single quarter after a weak start to the year
In the second quarter of 2026 revenue was $151.7m, 46.6% more than $103.5m a year earlier. This is the best quarter in the last five: revenue was $116.3m in the first quarter, $92.2m in the fourth quarter of 2025 and $105.4m in the third.
The year-on-year growth looks impressive, but it rests on a weak base in the second quarter of 2025, when revenue was the lowest in four quarters. Sequential growth over the first quarter of 2026 was 30.4%, which points to a recovery in demand rather than just a base effect.
Over the last twelve months revenue was $465.6m, and the second quarter accounted for almost a third of that. For a commodity company such concentration in one quarter means the annual result depends heavily on price conditions in that particular period.
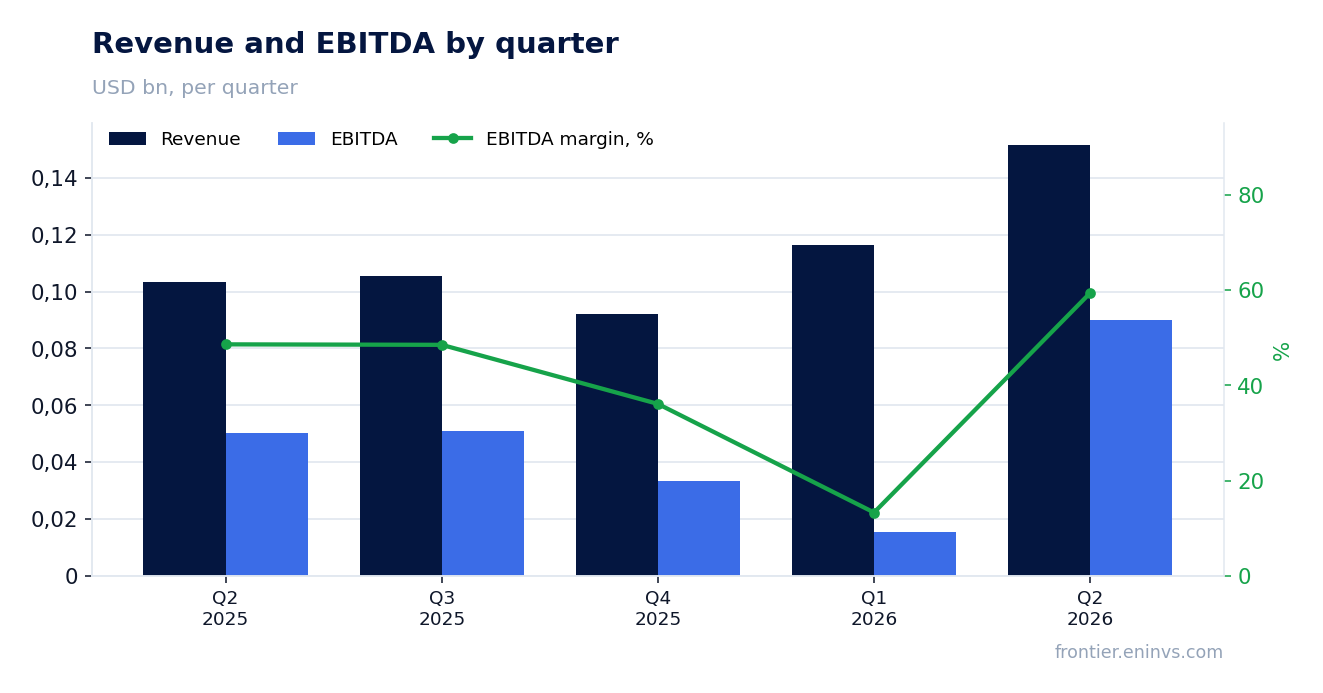
EBITDA jumped 79.1% to $90.0m, and the 59.4% margin rests on last year's low base
EBITDA in the second quarter of 2026 reached $90.0m against $50.3m a year earlier, up 79.1%. The margin rose to 59.4% from 48.6% a year earlier — the highest level in five quarters.
Operating profit was $57.9m against $20.2m a year earlier, almost tripling. The gap between EBITDA and operating profit growth is explained by depreciation and other operating costs rising more slowly than revenue.
In the first quarter of 2026 EBITDA was only $15.5m on revenue of $116.3m, a margin of about 13%. Such a spread shows the company operates in an industry with high operating dependence on prices, and quarterly margins can swing several-fold.
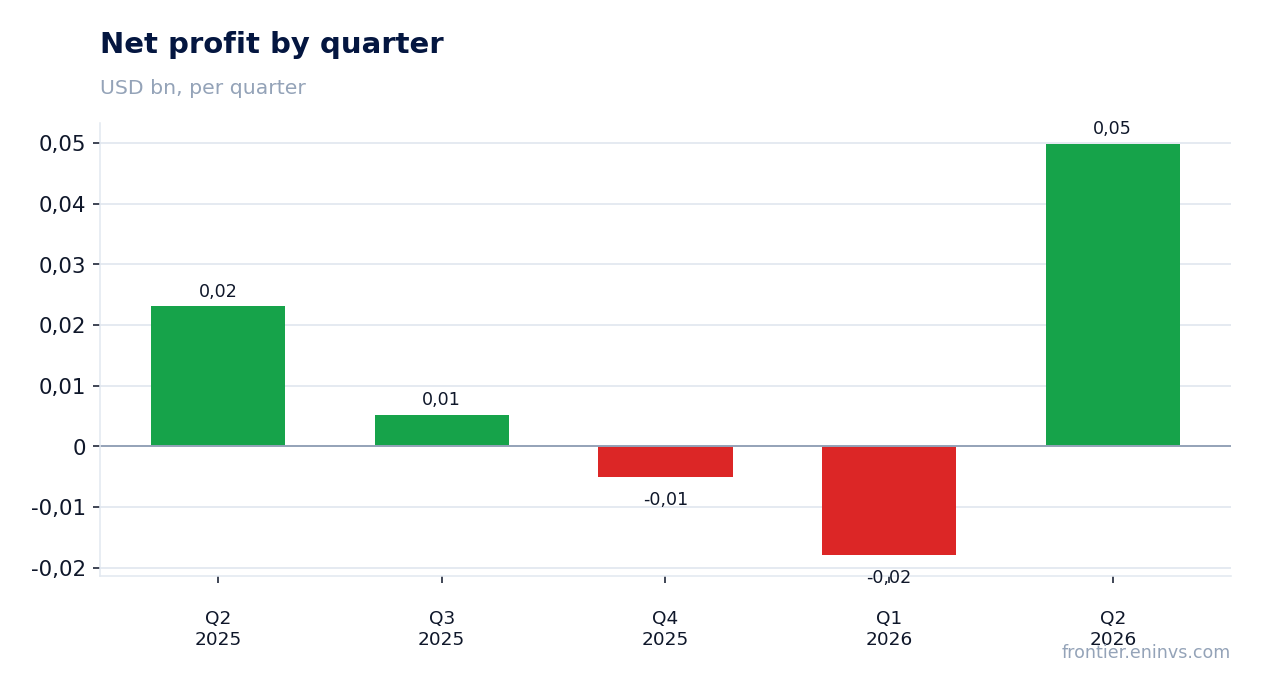
Net profit of $49.9m more than doubled, but there were no one-off sales in it — the entire effect came from operating leverage
Net profit in the second quarter of 2026 was $49.9m against $23.1m a year earlier, up 116.2%. The net margin rose to 32.9% from 22.3% a year earlier.
The entire profit increase came from operating leverage: revenue rose 46.6%, while operating profit almost tripled. No one-off items such as asset sales or revaluations are disclosed in the report, and the profit looks clean.
Over the last twelve months net profit was $32.1m, well below the quarterly result. This means the previous three quarters were weak: there was a loss of $5.1m in the fourth quarter of 2025 and a loss of $17.9m in the first quarter of 2026.
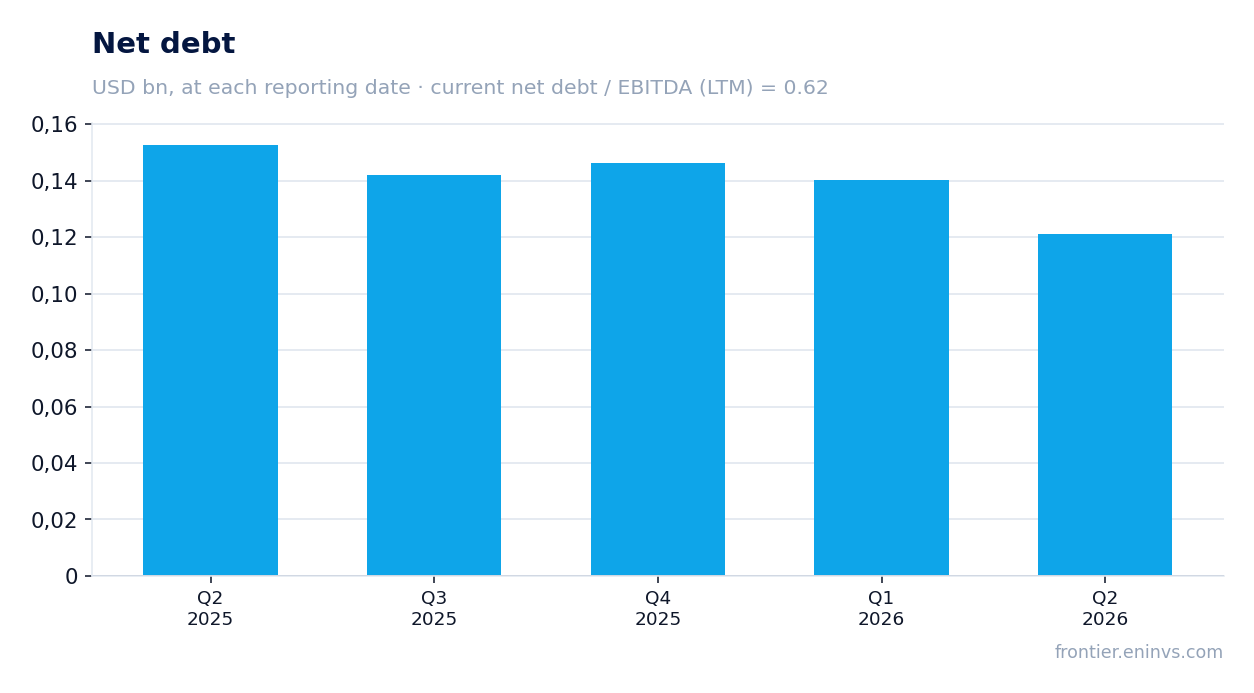
Debt of $121.1m is just 0.62x trailing-twelve-month EBITDA, and it barely changed over the year
Net debt at 30 June 2026 was $121.1m, equivalent to 0.62x trailing-twelve-month EBITDA. This is a low leverage level that leaves the company room to manoeuvre.
Over the quarter net debt fell from $140.1m at 31 March 2026 to $121.1m at 30 June 2026, a decrease of $19.0m. Over twelve months debt fell from $152.7m at 30 June 2025 to $121.1m at 30 June 2026.
Operating cash flow for the quarter was $68.5m, comfortably covering both debt service and dividends. With such leverage, interest expense is not a material risk to profit.
Free cash flow of $68.5m for the quarter covers the dividend with room to spare, but capital expenditure is not disclosed in the report
Operating cash flow in the second quarter of 2026 was $68.5m against $40.7m a year earlier. Over the last twelve months it reached $203.2m, exceeding EBITDA for the same period ($194.7m).
Capital expenditure is not disclosed in the report, so free cash flow in the strict sense is not visible. However, even without deducting capex, operating cash flow covers the dividend: with a 4.1% yield and a market capitalisation of $884.6m, annual payments are about $36.2m.
The company pays dividends, and a 4.1% yield over the last twelve months is a moderate level. With such cash flow the payments are sustainable, but for a commodity company the predictability of capital expenditure matters, and it is absent from the report.
A 4.1% dividend yield is modest for a commodity company and does not offset a 5.3x EBITDA valuation
The dividend yield over the last twelve months is 4.1%. With a market capitalisation of $884.6m this is about $36.2m of payments a year, covered by a single quarter's operating cash flow.
For a company with net profit of $32.1m over the last twelve months, payments of $36.2m imply a payout ratio above 100%. This is possible thanks to a strong quarter, but the sustainability of such a level depends on high prices repeating.
A 4.1% yield does not look attractive against a 5.3x EBITDA valuation and does not create a margin of safety for the investor. If profit returns to the levels of the first quarter of 2026, the dividend may be cut.
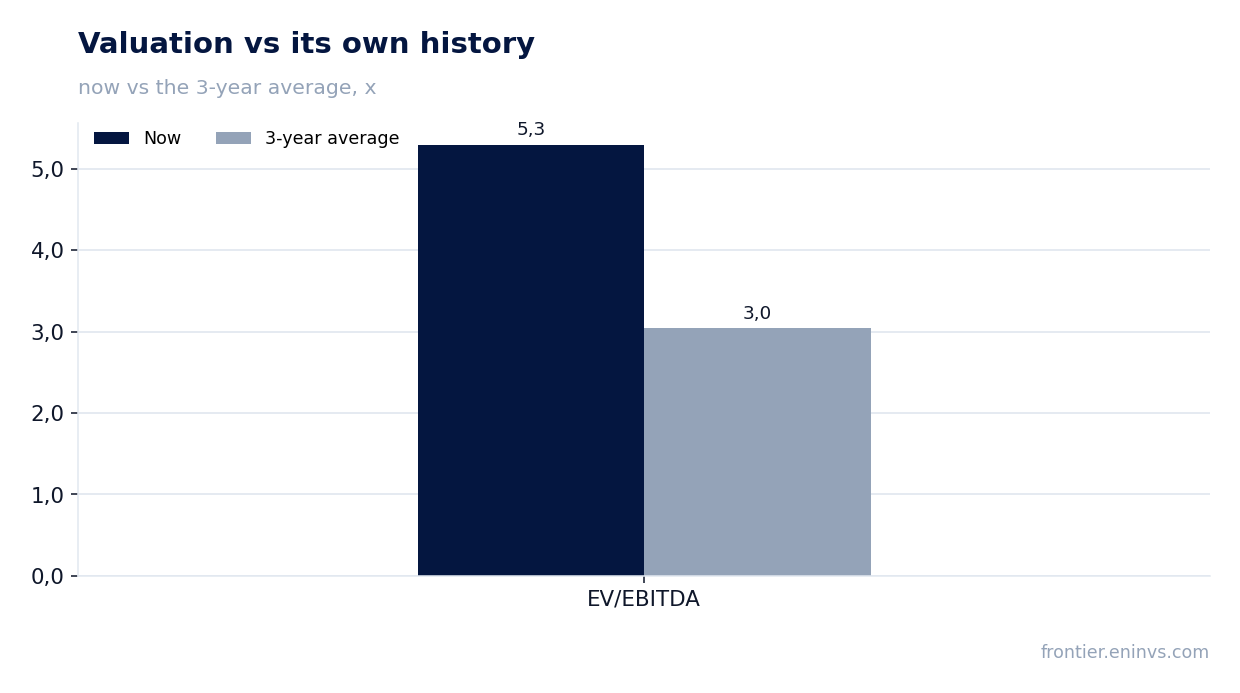
The EV/EBITDA multiple of 5.3x is 74% above its own three-year average of 3.0 — the market already believes in a durable recovery
EV/EBITDA over the last twelve months is 5.3x, 74% above its own three-year average of 3.0. The share trades well above its history, and this is the main argument against buying after the report.
The trailing-twelve-month P/E is 27.6, which also reflects the low profit base for the period. If second-quarter profit proves sustainable, the multiple will normalise quickly, but the market has already priced this in.
On the portal's model, which reprices EBITDA at current commodity prices at the target EV/EBITDA, the share's fair value is 26% below the current price. This is our own estimate, not a market consensus, and it points to overvaluation.
Valuation on the latest reported figures
| Metric | Value |
|---|---|
| Market cap | 0.88 bn USD |
| P/E (LTM) | 27.6 |
| EV/EBITDA (LTM) | 5.3 |
| P/B | 1.67 |
| Net debt / EBITDA (LTM) | 0.62 |
| Operating cash flow (LTM) | 0.20 bn |
| ROE | 39.3% |
| Dividend yield (12m) | 4.1% |
| EV/EBITDA, 3-year average | 3.0 |
Bottom line
Surge Energy's strong quarter is primarily an EBITDA recovery off a low base: revenue rose 46.6% while EBITDA rose 79.1%, and the 59.4% margin looks exceptional only against a weak first quarter. Leverage is low (0.62x EBITDA) and cash flow covers the dividend, but a payout ratio above 100% over the last twelve months raises questions. A 5.3x EBITDA valuation is 74% above its own history, and the portal's model implies 26% downside to fair value. The verdict is neutral: the report is good, but it is already in the price, and further gains require sustainable profit rather than a one-off spike.
Open the company's financial profile SGY →
See also: market overview · valuation map · stock screeners