Surge Energy: revenue up 31.1% but profit nearly halved as EBITDA margin compressed from 44.4% to 27.9%
Surge Energy reported third-quarter 2026 results. Revenue rose 31.1% year on year to $138.1 million, EBITDA came in at $38.6 million and net profit at $2.9 million. Yet EBITDA fell 17.6% and net profit 44.8%, while the EBITDA margin dropped from 44.4% to 27.9%. With EV/EBITDA at 10.0 against its own three-year average of 3.1 and a negative portal-model valuation, the share looks unattractive at the current level.
Key takeaways
— Revenue grew 31.1% year on year, but the pace decelerated from 46.6% a quarter earlier
— EBITDA fell 17.6% and its margin compressed from 44.4% to 27.9% – revenue growth did not reach profit
— Net profit dropped 44.8% to $2.9 million, with the margin down from 5.0% to 2.1%
— Operating cash flow of $52.3 million covered capex of $43.2 million, but the free remainder is thin
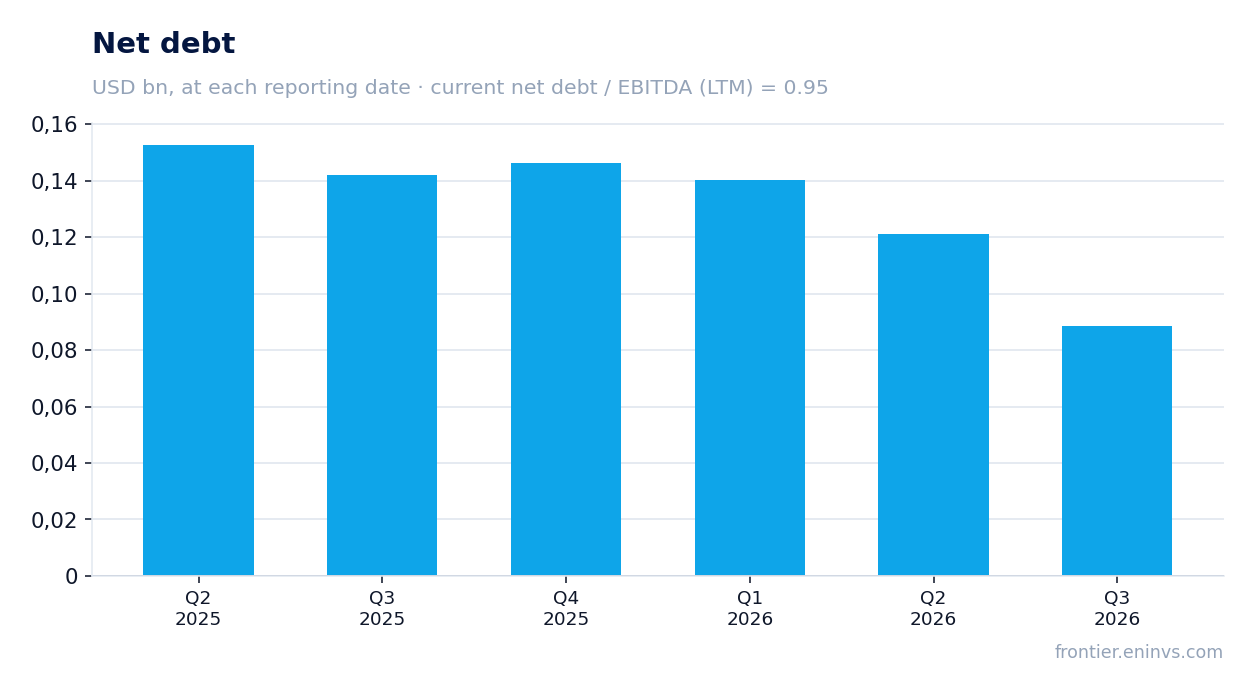
— Net debt of $88.6 million at 0.95x LTM EBITDA – leverage is moderate
— Dividend yield of 4.7% rests on LTM profit of $32.1 million
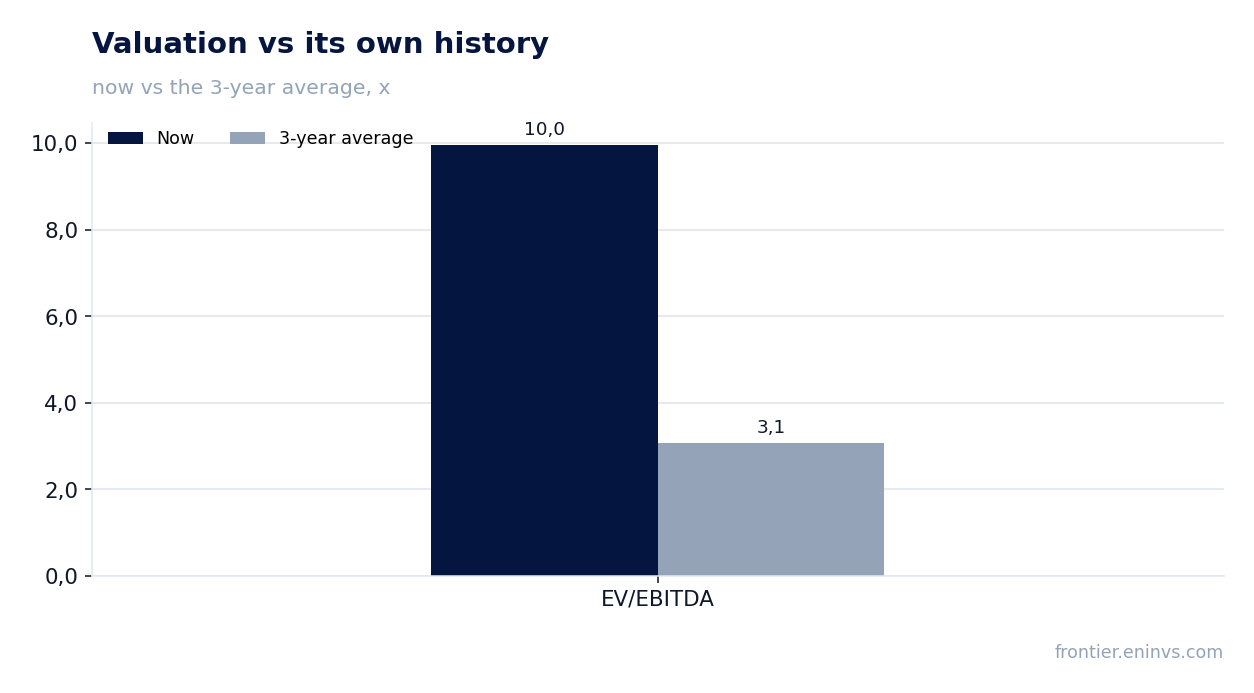
— EV/EBITDA at 10.0 versus its own three-year average of 3.1 – the share is 224% above its history
Attractiveness
Key figures, USD bn
| Metric | Q3 2025 | Q3 2026 | Change |
|---|---|---|---|
| Revenue | 0.11 | 0.14 | +31.1% |
| EBITDA | 0.05 | 0.04 | -17.6% |
| Operating profit | 0.02 | 0.01 | -42.0% |
| Net profit | 0.01 | 0.00 | -44.8% |
| Operating cash flow | 0.05 | 0.05 | +8.7% |
| EBITDA margin | 44.4% | 27.9% | -16.5 pp |
| Net margin | 5.0% | 2.1% | -2.9 pp |
Revenue grew 31.1% year on year, but the pace decelerated from 46.6% a quarter earlier
In the third quarter of 2026, Surge Energy's revenue reached $138.1 million, up 31.1% year on year. Growth remains double-digit but is markedly slower than in the second quarter, when revenue added 46.6%. The deceleration signals that quarterly momentum is weakening.
The quarterly sequence shows uneven dynamics: after $151.7 million in the second quarter, revenue fell to $138.1 million in the third. Year-on-year growth persists, but reliance on the prior-year base is becoming less reliable. The next quarter will be important for judging the trend's durability.
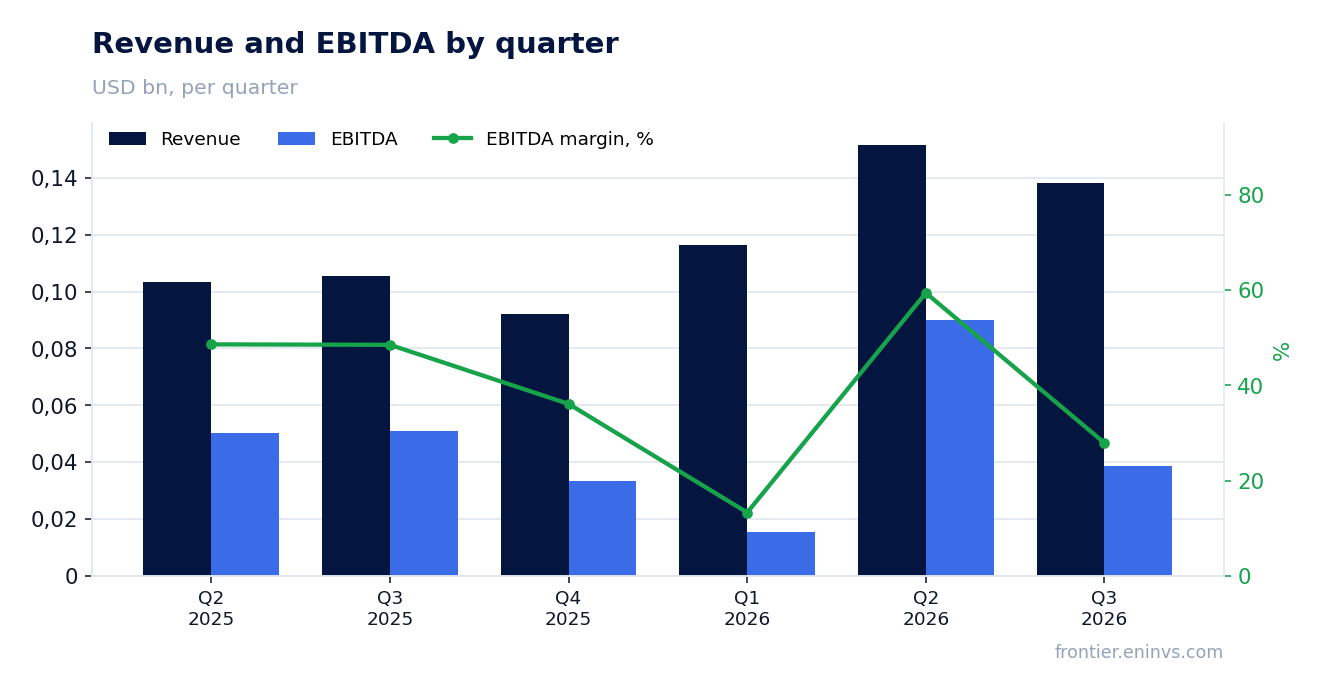
EBITDA fell 17.6% and its margin compressed from 44.4% to 27.9% – revenue growth did not reach profit
EBITDA for the third quarter of 2026 was $38.6 million, down 17.6% year on year. With revenue up 31.1%, this means costs grew faster than income. The EBITDA margin fell from 44.4% to 27.9% – a compression of 16.5 percentage points.
Operating profit was $10.3 million versus $17.8 million a year earlier. The gap between revenue and EBITDA points to pressure from operating costs rather than financial items. The facts do not disclose the cause, but the scale of margin compression makes it the key question of the report.
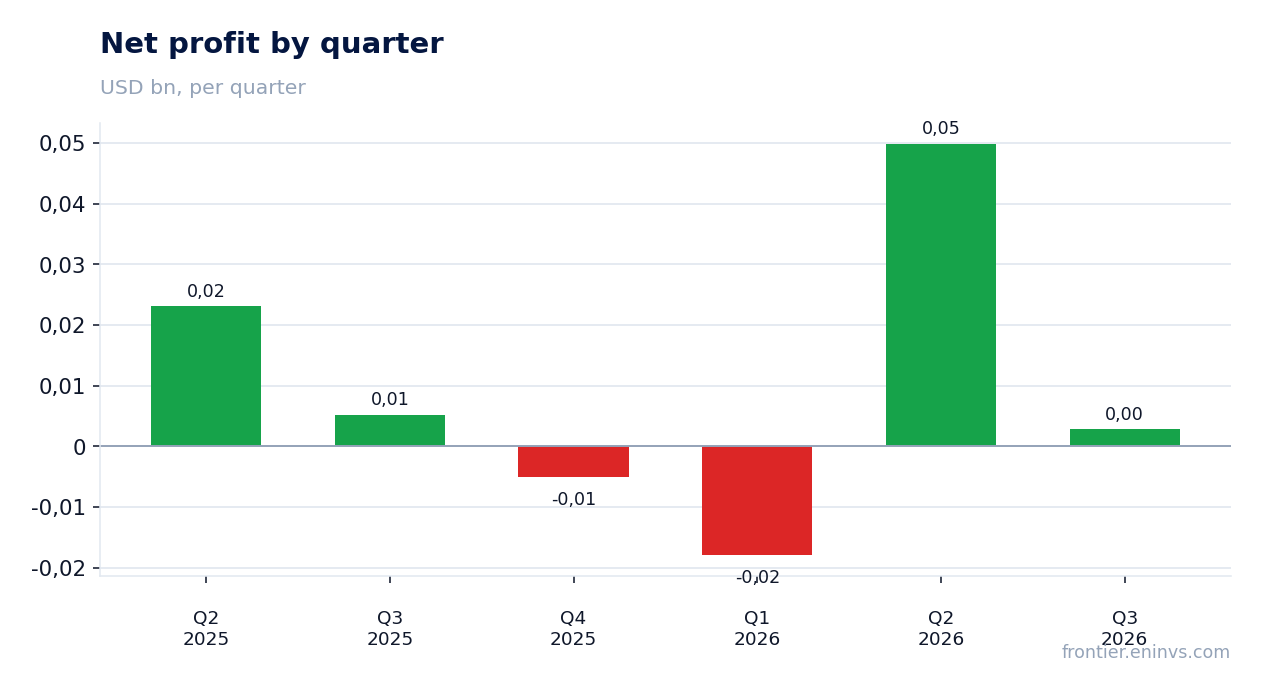
Net profit dropped 44.8% to $2.9 million, with the margin down from 5.0% to 2.1%
Net profit for the third quarter of 2026 was $2.9 million versus $5.2 million a year earlier – a 44.8% decline. The net margin fell from 5.0% to 2.1%. Margin compression at the EBITDA level translated into profit almost without cushion.
Over the trailing twelve months, net profit was $32.1 million – well above the quarterly level, reflecting a strong second quarter of 2026 with $49.9 million in profit. The current quarter is the weak link in that trajectory. Profit sustainability in the fourth quarter matters for the annual result.
Operating cash flow of $52.3 million covered capex of $43.2 million, but the free remainder is thin
Operating cash flow for the third quarter of 2026 was $52.3 million, while capital expenditure was $43.2 million. The $9.2 million difference remains after investment, but it is small relative to the scale of the business. For comparison, in the second quarter capex was $23.6 million against cash flow of $68.5 million.
Capex rising from $23.6 million to $43.2 million quarter on quarter means the investment programme accelerated. At the same time, operating cash flow fell from $68.5 million to $52.3 million. The combination of these two movements compresses the free cash flow available for dividends and debt reduction.
Net debt of $88.6 million at 0.95x LTM EBITDA – leverage is moderate
Net debt as of 30 September 2026 was $88.6 million. The ratio of net debt to LTM EBITDA is 0.95, below one. This level of leverage leaves room for manoeuvre, but the ratio is given only as a level, without comparison to prior periods.
By balance-sheet dates, net debt fell from $121.1 million on 30 June 2026 to $88.6 million on 30 September – a decrease of $32.5 million. Over the year, from 30 September 2025, the reduction was $53.3 million. The debt reduction was supported by operating cash flow, which in the third quarter exceeded capital expenditure.
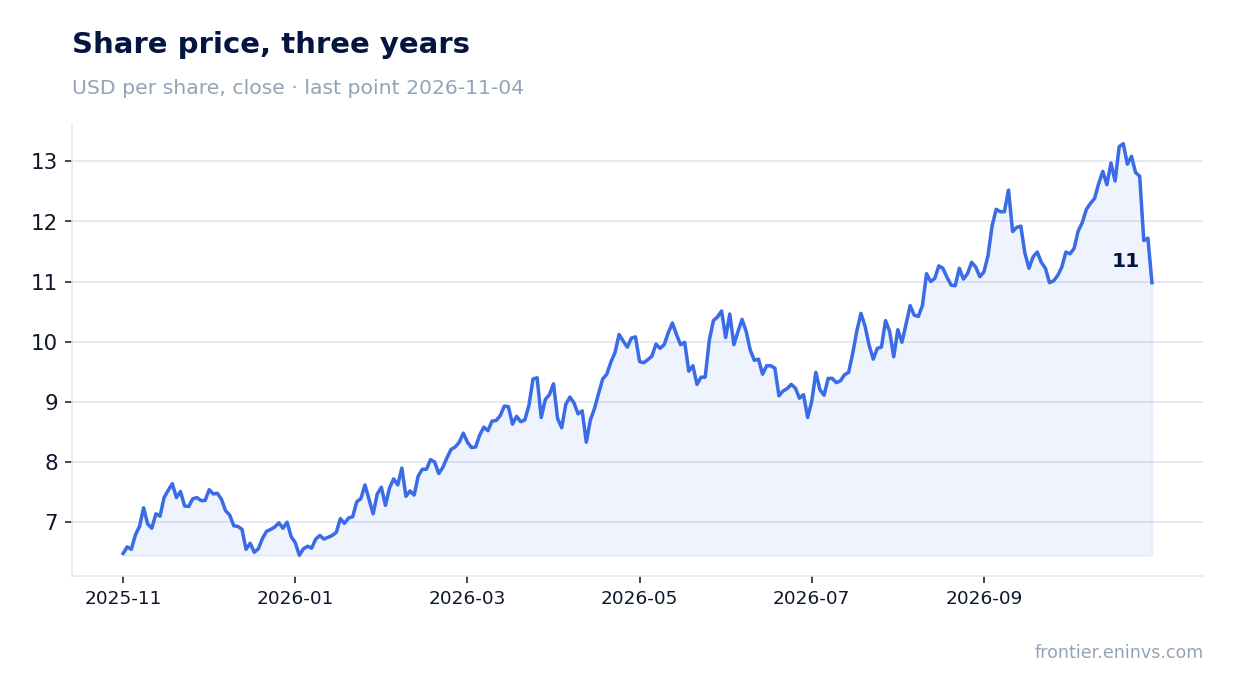
Dividend yield of 4.7% rests on LTM profit of $32.1 million
The trailing twelve-month dividend yield is 4.7% on the current price. Payouts rest on LTM profit of $32.1 million, which includes a strong second quarter of 2026 with $49.9 million in profit. If quarterly profit stays at $2.9 million, the annual base for dividends will come under pressure.
Our estimate for the current year's dividend is based on LTM profit and a payout ratio not disclosed in the facts. Restoration of profit in the fourth quarter will be key to maintaining payouts. A decline in profit or higher capex could lead to a dividend cut.
EV/EBITDA at 10.0 versus its own three-year average of 3.1 – the share is 224% above its history
The trailing twelve-month EV/EBITDA multiple is 10.0. That is 224% above its own three-year average of 3.1. The share trades materially above its history on this multiple, which limits upside potential.
On the portal's model, which re-prices EBITDA at current commodity prices at the target EV/EBITDA, the upside of the share to its fair value is minus 45%. This is our own estimate, not a market consensus. P/E LTM is 24.4, also pointing to a rich valuation relative to earnings.
Valuation on the latest reported figures
| Metric | Value |
|---|---|
| Market cap | 0.78 bn USD |
| P/E (LTM) | 24.4 |
| EV/EBITDA (LTM) | 10.0 |
| P/B | 1.48 |
| Net debt / EBITDA (LTM) | 0.95 |
| Operating cash flow (LTM) | 0.14 bn |
| ROE | 2.2% |
| Dividend yield (12m) | 4.7% |
| EV/EBITDA, 3-year average | 3.1 |
Bottom line
The report's strengths remain revenue growth of 31.1% and moderate leverage – net debt of $88.6 million at 0.95x LTM EBITDA. However, profit and margin compressed: EBITDA fell 17.6% and net profit 44.8%. Free cash flow is thin due to rising capex, and the 4.7% dividend yield rests on LTM profit that may decline. The key question for a holder is whether the company can restore margin and justify an EV/EBITDA of 10.0 against its own history of 3.1.
Open the company's financial profile SGY →
See also: market overview · valuation map · stock screeners