Shell: revenue up 36.2%, but profit more than doubled – and the price already reflects it
Shell reported results for the third quarter of 2026. Revenue came in at USD 92.8 bn, up 36.2% year on year, EBITDA reached USD 25.6 bn (+78.3%), and net profit was USD 12.1 bn (+126.6%). Profit growth outpaces revenue on margin expansion, yet the EV/EBITDA multiple of 5.0 is above its own three-year average of 4.3, and the portal model points to −2% upside – the share looks fairly valued, with no margin of safety.
Key takeaways
— Revenue grew 36.2% year on year in Q3, but the pace decelerated from 44.7% in Q2
— EBITDA rose 78.3%, with the margin expanding to 27.5% from 21.0% a year earlier
— Net profit jumped 126.6%, with the margin at 13.0% versus 7.8% a year earlier
— Leverage is moderate: net debt of USD 39.6 bn, or 0.56x LTM EBITDA
— Operating cash flow was USD 21.0 bn for the quarter, with capex not disclosed
— The dividend yield of 2.8% is below risk-free rates, and payouts depend on profit
— Valuation is above its own history: EV/EBITDA 5.0 versus the 4.3 average, with −2% upside on the portal model
Attractiveness
Key figures, USD bn
| Metric | Q3 2025 | Q3 2026 | Change |
|---|---|---|---|
| Revenue | 68.2 | 92.8 | +36.2% |
| EBITDA | 14.3 | 25.6 | +78.3% |
| Operating profit | 7.73 | 19.2 | +147.6% |
| Net profit | 5.32 | 12.1 | +126.6% |
| Operating cash flow | 12.2 | 21.0 | +72.4% |
| Capex | 4.56 | — | — |
| EBITDA margin | 21.0% | 27.5% | +6.5 pp |
| Net margin | 7.8% | 13.0% | +5.2 pp |
Revenue grew 36.2% year on year in Q3, but the pace decelerated from 44.7% in Q2
Revenue for the third quarter of 2026 was USD 92.8 bn, up 36.2% from a year earlier. That is a strong result, but it is slower than the 44.7% growth in the second quarter. The deceleration is largely a base effect: a year ago, third-quarter revenue was already USD 68.2 bn versus USD 65.4 bn in the second quarter of 2025.
Revenue was supported by energy prices and sales volumes, but the report does not break down the contribution of each factor. Importantly, the absolute level remains high – USD 92.8 bn for the quarter – and this is the second consecutive quarter with revenue above USD 90 bn. For comparison, first-quarter 2026 revenue was USD 69.7 bn.
The slowdown in growth is not a warning sign in itself, but it raises the question of whether the company can sustain revenue at this level if the price environment becomes less favourable. The next report will show whether the third quarter was the peak.
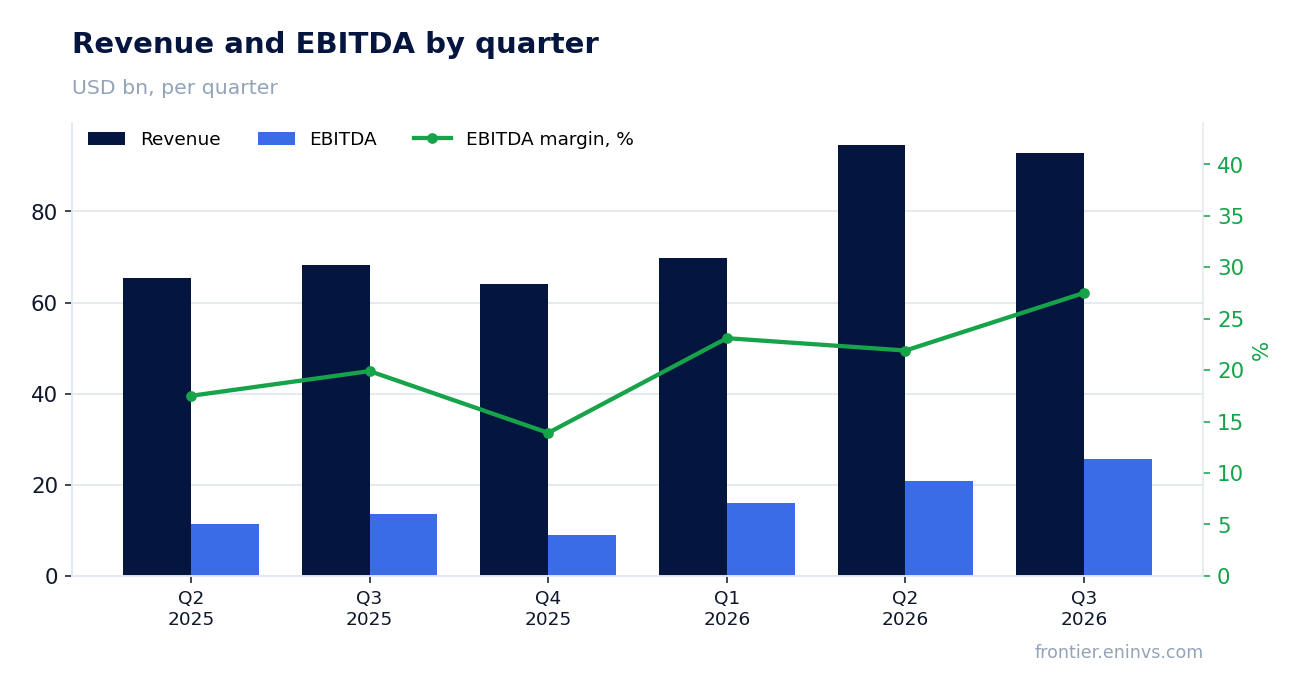
EBITDA rose 78.3%, with the margin expanding to 27.5% from 21.0% a year earlier
EBITDA for the third quarter of 2026 reached USD 25.6 bn, up 78.3% year on year. That growth significantly outpaces revenue (+36.2%), indicating margin expansion. The EBITDA margin was 27.5% versus 21.0% a year earlier – an improvement of 6.5 percentage points.
Margin growth means the company either cut unit costs or benefited from higher prices for its products with relatively stable costs. The report does not detail which cost line moved, so we state only that operating efficiency improved. Operating profit was USD 19.2 bn for the quarter.
Margin sustainability is the key question. If EBITDA growth was driven by one-off factors, such as a favourable price environment that could reverse, profit could adjust downward. If it reflects structural improvements, the current margin level may hold.
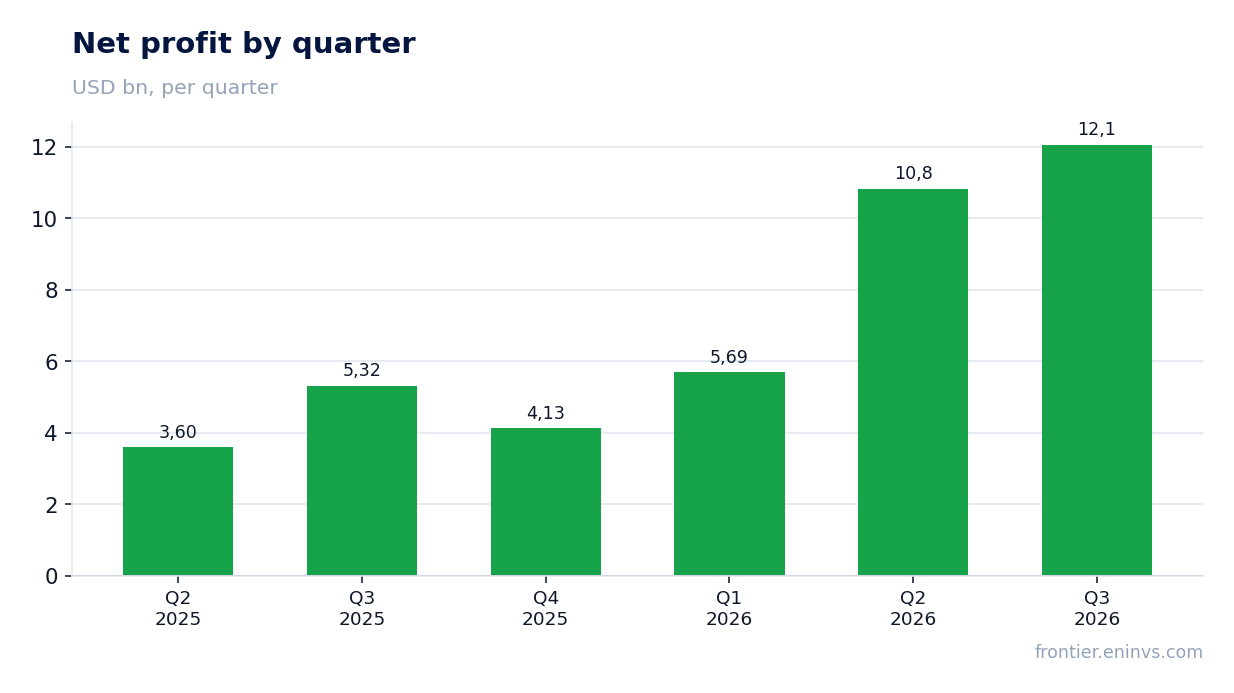
Net profit jumped 126.6%, with the margin at 13.0% versus 7.8% a year earlier
Net profit for the third quarter of 2026 was USD 12.1 bn, up 126.6% from a year earlier. Profit growth is more than double revenue growth, and the net margin rose to 13.0% from 7.8% a year earlier. This reflects both improved operating profitability and possibly lower financial expenses or one-off items.
Note that the base a year earlier was low: net profit in the third quarter of 2025 was USD 5.3 bn at a 7.8% margin. The current profit level – USD 12.1 bn – is almost double that of the second quarter of 2026 (USD 10.8 bn).
For the investor, the key question is how sustainable this profit level is. If it is supported by high energy prices, profit could return to more modest levels when they fall. If the company has improved its cost structure, profit may remain high.
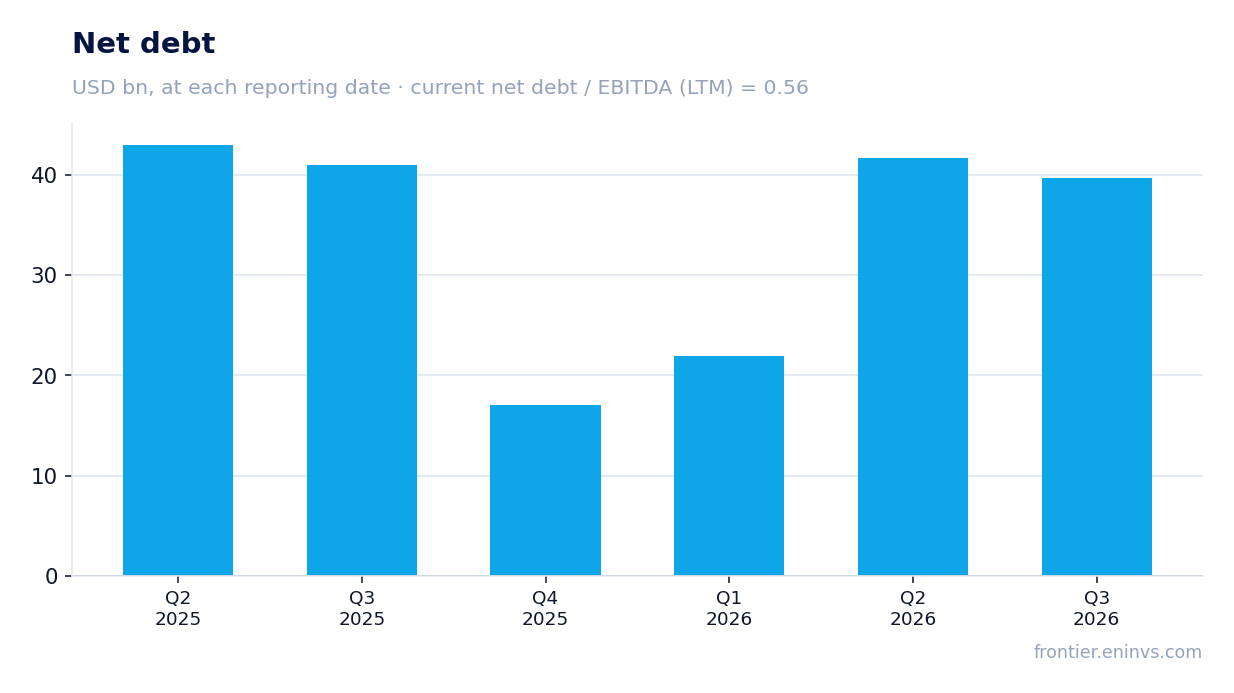
Leverage is moderate: net debt of USD 39.6 bn, or 0.56x LTM EBITDA
Net debt as of 30 September 2026 was USD 39.6 bn, down from USD 41.7 bn on 30 June 2026 (a change of −USD 2.1 bn). Over the year, from 30 September 2025, net debt declined from USD 40.9 bn to USD 39.6 bn (−USD 1.3 bn). The ratio of net debt to LTM EBITDA – 0.56 – is at a comfortable level.
The debt reduction came on the back of strong operating cash flow, which was USD 21.0 bn for the quarter. This allowed the company to allocate part of the funds to repay obligations. Interest expenses are not disclosed in the report, but at this debt level and cash flow they do not look burdensome.
Moderate leverage gives the company flexibility: it can increase capex, return capital to shareholders, or ride out a period of low prices without risking financial stability.
Operating cash flow was USD 21.0 bn for the quarter, with capex not disclosed
Operating cash flow for the third quarter of 2026 was USD 21.0 bn, slightly below the second quarter (USD 21.4 bn) but well above the first quarter (USD 6.1 bn). This flow funds capital expenditure and dividends without increasing debt.
Capital expenditure for the third quarter is not disclosed in the provided data. In the second quarter it was USD 4.0 bn, and in the first quarter USD 3.8 bn. If capex remained at a comparable level in the third quarter, free cash flow (operating cash flow minus capex) could have been around USD 17 bn. However, without exact data we cannot state this with certainty.
Strong cash flow is a key factor for sustaining dividend payments and reducing debt. It also creates a buffer for the company if market conditions deteriorate.
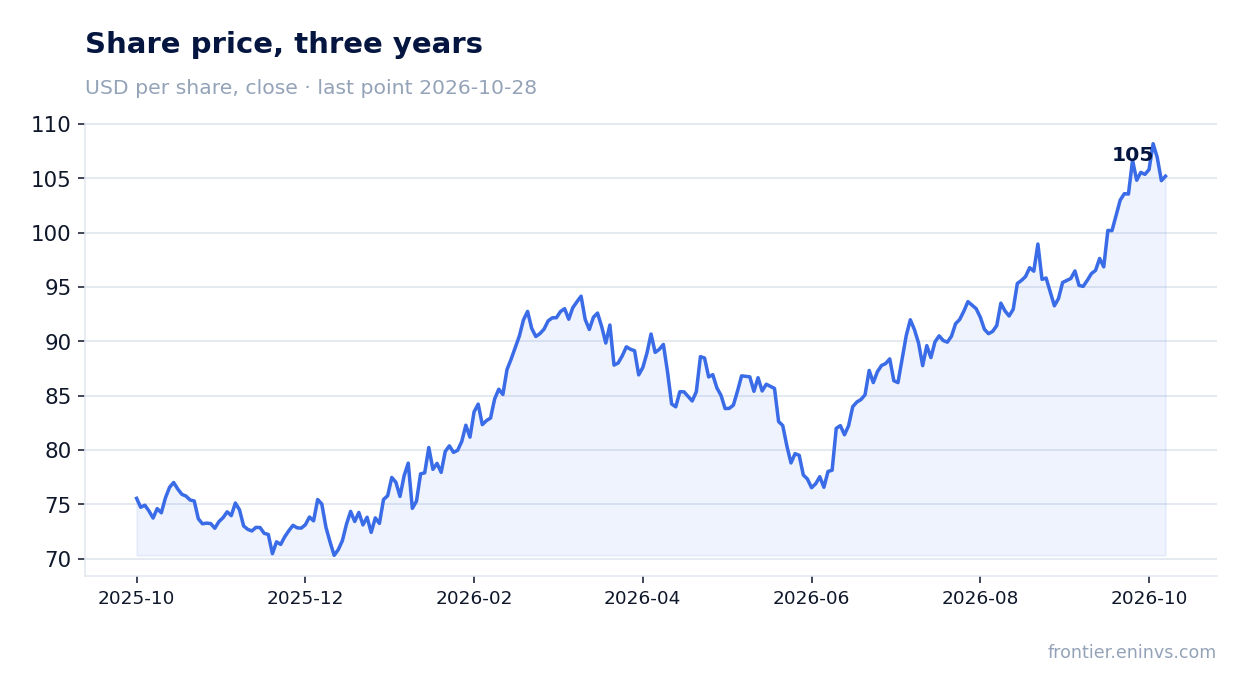
The dividend yield of 2.8% is below risk-free rates, and payouts depend on profit
Shell's dividend yield over the last 12 months is 2.8%. This is a modest level, especially against a high key rate. For comparison, yields on risk-free dollar instruments may be higher, although exact data are not in the facts. Dividend payments depend on profit, which was high in the third quarter but could decline if energy prices fall.
The company did not disclose the size of the last paid dividend or the year for which it was paid. Our estimate for the current year is based on LTM profit (USD 32.7 bn) and a payout ratio that is not disclosed. If the company allocates about 40% of profit to dividends, the dividend could be around USD 1.2 per share, which at the current price gives a yield of about 2.8%. This matches the actual yield, but the exact payout ratio is unknown.
The risk of a dividend cut is linked to falling profit. If energy prices drop, profit could shrink and the company might reduce payouts. However, strong cash flow and moderate debt allow the dividend to be maintained even with a temporary profit decline.
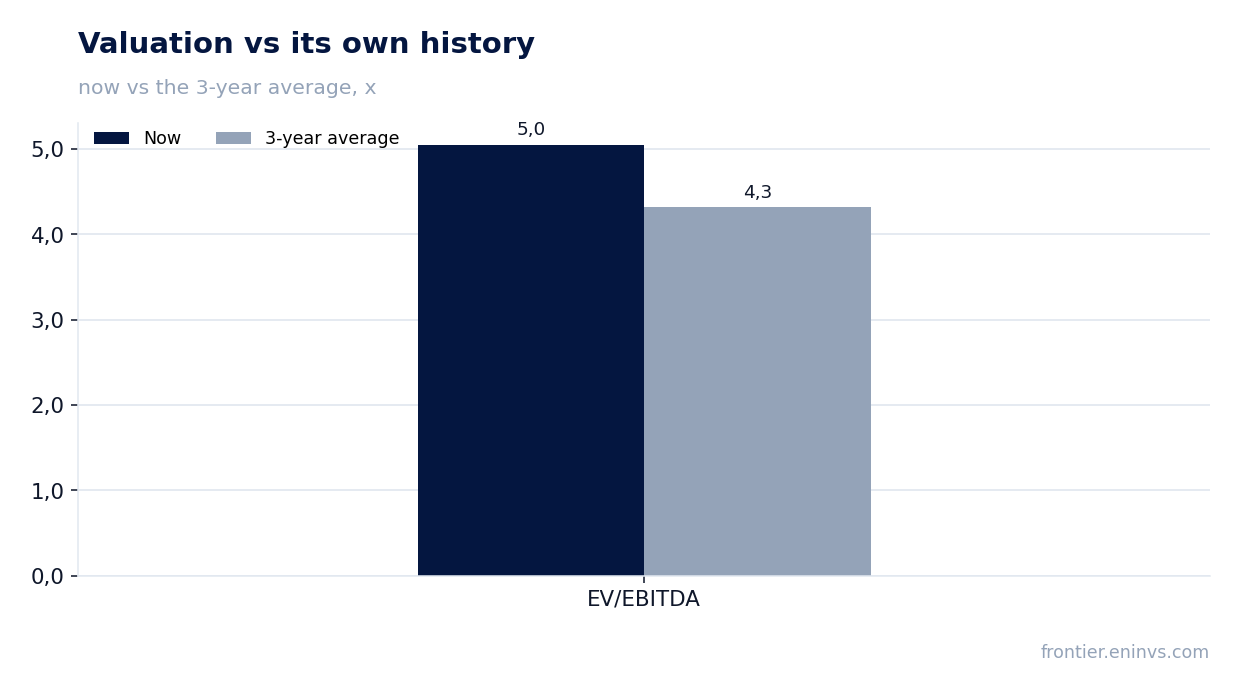
Valuation is above its own history: EV/EBITDA 5.0 versus the 4.3 average, with −2% upside on the portal model
The LTM EV/EBITDA multiple is 5.0, which is 17% above its own three-year average of 4.3. This means the share is trading more expensively than usual relative to its history. The LTM P/E is 9.8, which also points to a low absolute valuation, but above average relative to history.
The portal model, which reprices EBITDA at current commodity prices and the target EV/EBITDA, shows upside to fair value of −2%. In other words, the current price is close to the model's estimate, with no margin of growth.
For the investor, this means further share growth is possible only with improved fundamentals – for example, sustained profit growth or debt reduction. If profit stabilises at the current level, the share is unlikely to show significant growth.
Valuation on the latest reported figures
| Metric | Value |
|---|---|
| Market cap | 320 bn USD |
| P/E (LTM) | 9.8 |
| EV/EBITDA (LTM) | 5.0 |
| P/B | 1.84 |
| Net debt / EBITDA (LTM) | 0.56 |
| Operating cash flow (LTM) | 58.0 bn |
| ROE | 25.4% |
| Dividend yield (12m) | 2.8% |
| EV/EBITDA, 3-year average | 4.3 |
Bottom line
Shell delivered strong results for the third quarter: revenue grew 36.2%, EBITDA rose 78.3%, and net profit jumped 126.6%. The EBITDA margin expanded to 27.5%, and the net margin to 13.0%. Leverage is moderate (0.56x LTM EBITDA), and cash flow is strong. However, valuation is above its own history (EV/EBITDA 5.0 versus 4.3), and the portal model implies no upside. The dividend yield of 2.8% is modest. Verdict – neutral: the share is fairly valued, with no clear upside potential.
Open the company's financial profile SHEL →
See also: market overview · valuation map · stock screeners