Saturn Oil & Gas: revenue up 44.3%, but debt and valuation sit above the company's own history
Saturn Oil & Gas reported third-quarter 2026 results. Revenue reached USD 251.5 mn, up 44.3% year on year, operating cash flow was USD 111.0 mn, and net debt at end-September stood at USD 649.2 mn, or 2.43 trailing-twelve-month EBITDA. At an EV/EBITDA of 5.8 the stock trades well above its own three-year average of 2.3, and the portal model implies a 7% downside to fair value, so the share looks rather unattractive at the current price.
Key takeaways
— Revenue grew 44.3% year on year, but the pace decelerated from 50.2% a quarter earlier
— Operating cash flow of USD 111.0 mn covered capex of USD 91.1 mn only with a thin margin
— Net debt rose from USD 0.5 bn on 30 June to USD 0.6 bn on 30 September
— Leverage at 2.43x trailing-twelve-month EBITDA is a moderate level, with no history of change
— EV/EBITDA of 5.8 versus its own three-year average of 2.3 makes the stock 154% more expensive than its history
— The portal model implies a 7% downside to fair value
Attractiveness
Key figures, USD bn
| Metric | Q3 2025 | Q3 2026 | Change |
|---|---|---|---|
| Revenue | 0.17 | 0.25 | +44.3% |
| EBITDA | 0.07 | — | — |
| Operating profit | 0.03 | — | — |
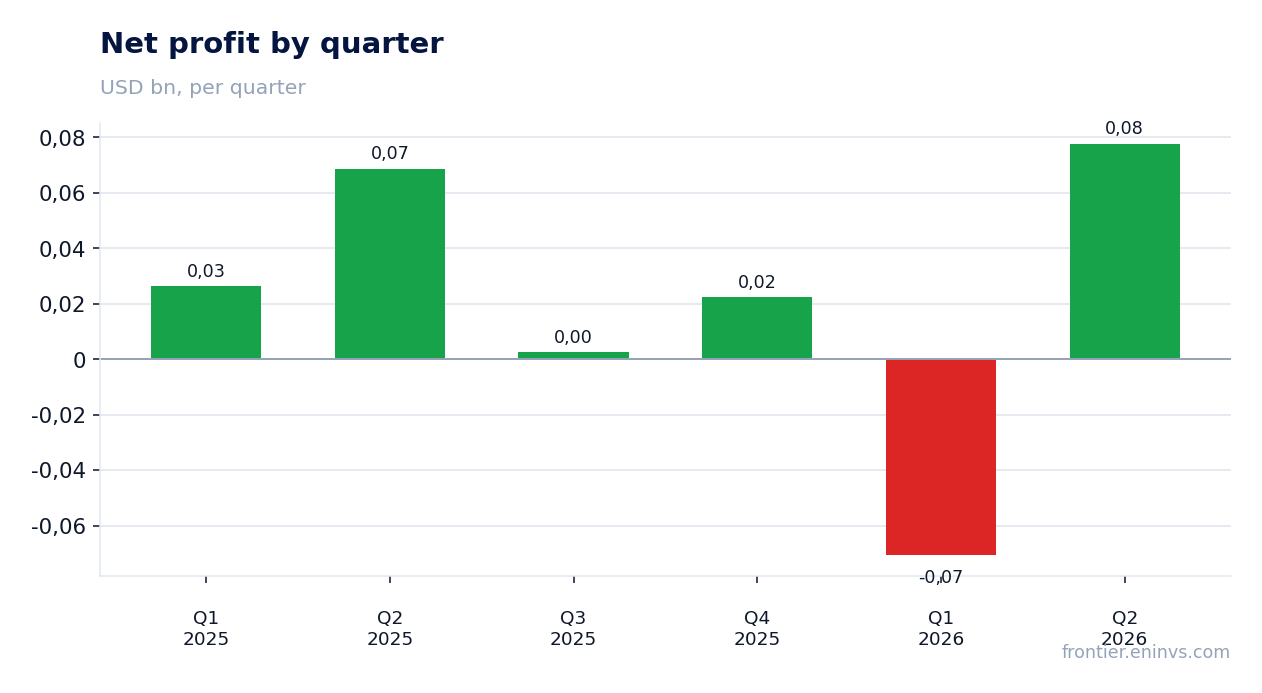
| Net profit | 0.00 | — | — |
| Operating cash flow | 0.09 | 0.11 | +21.4% |
| EBITDA margin | 41.7% | — | — |
| Net margin | 1.4% | — | — |
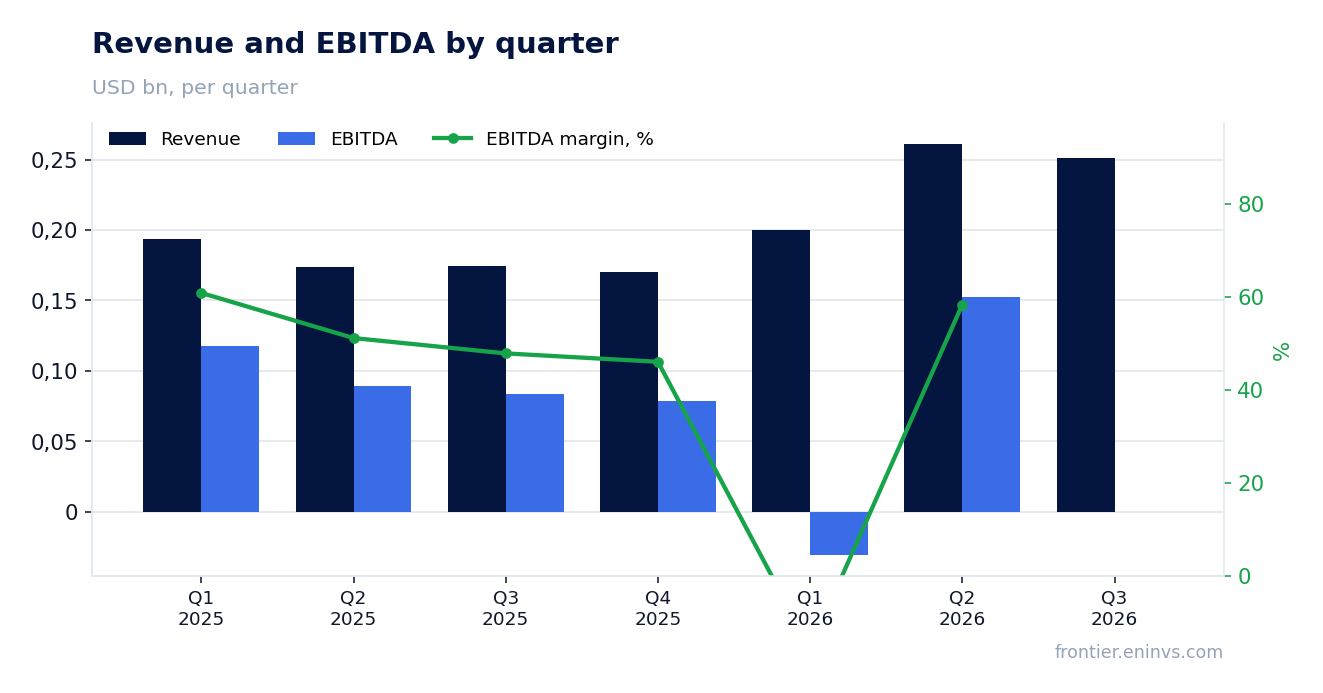
Revenue grew 44.3% year on year, but the pace decelerated from 50.2% a quarter earlier
In the third quarter of 2026 Saturn Oil & Gas generated revenue of USD 251.5 mn, up 44.3% from the same quarter a year earlier. Growth remains strong, but it is slower than in the second quarter, when revenue rose 50.2% year on year. The deceleration of 5.9 percentage points is the first sign that the comparison base and pricing environment are becoming less supportive.
The quarterly sequence shows that after a spike to USD 261.3 mn in the second quarter, revenue fell to USD 251.5 mn in the third. That is a sequential decline, not a year-on-year one, and it matters for judging the durability of the growth rate. The company still delivers double-digit growth, but it is no longer accelerating.
Operating cash flow of USD 111.0 mn covered capex of USD 91.1 mn only with a thin margin
Operating cash flow in the third quarter of 2026 was USD 111.0 mn, while capital expenditure reached USD 91.1 mn. The difference of USD 19.9 mn is the free cash flow before interest and other payments. The cushion is thin: capex absorbs about 82% of operating cash flow.
By comparison, in the second quarter operating cash flow was USD 91.3 mn with capex of USD 28.8 mn, so free cash flow was considerably larger. The more than threefold increase in capex in the third quarter versus the previous one is the key factor that constrained free cash. The ability to keep capex in check will determine whether the company can direct funds toward debt reduction.
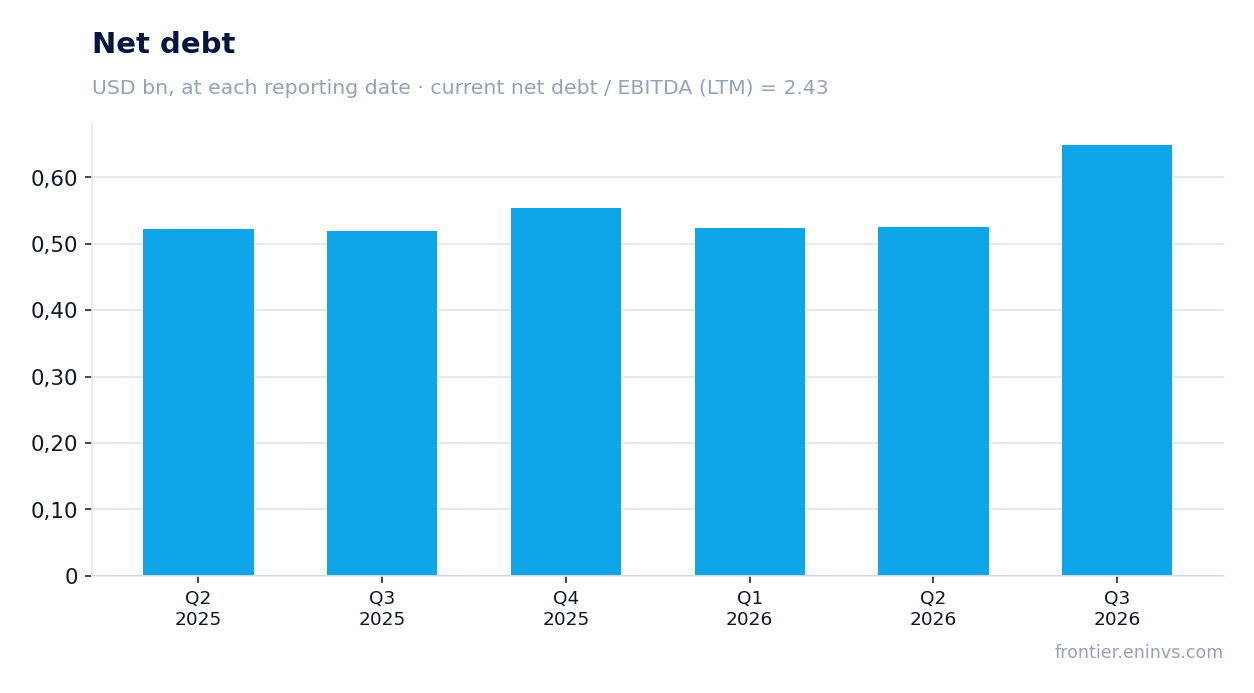
Net debt rose from USD 0.5 bn on 30 June to USD 0.6 bn on 30 September
Net debt at 30 September 2026 was USD 649.2 mn, up from USD 0.5 bn on 30 June to USD 0.6 bn. The quarterly increase was about USD 0.1 bn. Over twelve months, from 30 September 2025, net debt also rose from USD 0.5 bn to USD 0.6 bn.
The increase coincided with a quarter in which capex exceeded USD 91 mn and free cash flow was small. This means part of the investment was financed with debt. Leverage at 2.43x trailing-twelve-month EBITDA remains moderate, but the direction of change is upward, not downward.
Leverage at 2.43x trailing-twelve-month EBITDA is a moderate level, with no history of change
The ratio of net debt to trailing-twelve-month EBITDA is 2.43. That is not a high level for an oil and gas company, but the facts contain no prior value for this ratio, so its direction cannot be judged. All that can be said is that absolute debt has risen.
Trailing-twelve-month EBITDA was USD 266.7 mn, and that is the denominator. With revenue of USD 883.1 mn over the same period, the EBITDA margin exceeds 30%. Such a cushion supports debt service, but rising capex and debt at the same time narrows room for manoeuvre.
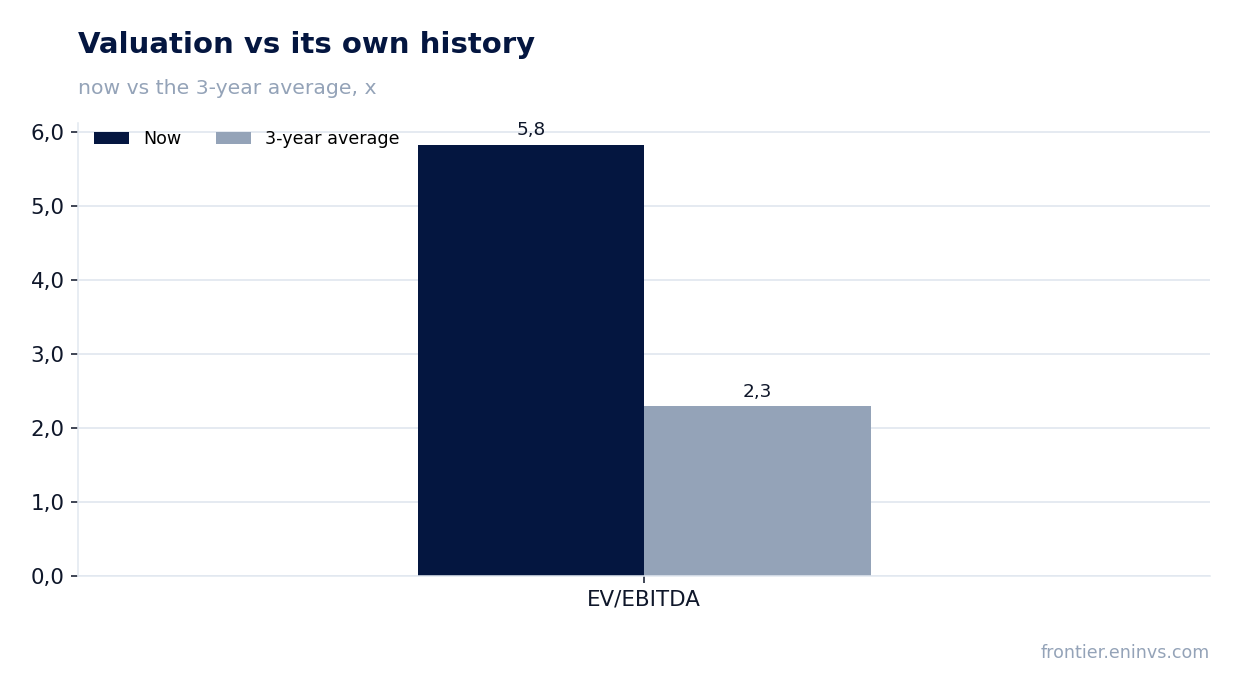
EV/EBITDA of 5.8 versus its own three-year average of 2.3 makes the stock 154% more expensive than its history
The trailing-twelve-month EV/EBITDA multiple is 5.8, while its own three-year average is 2.3. The stock trades 154% above its history on this multiple. That is the strongest argument against the share's attractiveness at the current level.
Market capitalisation is USD 1.0 bn, trailing-twelve-month P/E is 31.3, and ROE is 49.9%. The high return on equity partly explains the premium to history, but the durability of such profitability amid rising debt and capex is not assured. The portal model, which reprices EBITDA at current commodity prices at the target EV/EBITDA, implies a 7% downside to fair value.
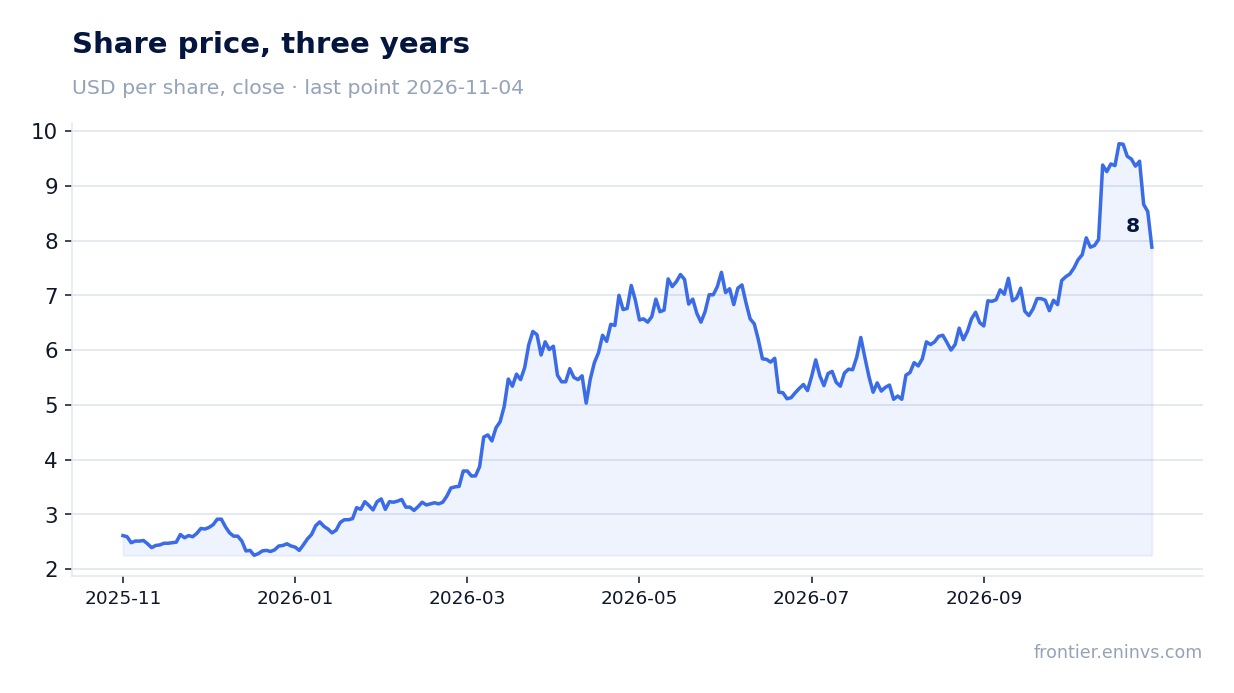
The portal model implies a 7% downside to fair value
According to the portal model, which reprices EBITDA at current commodity prices and applies a target EV/EBITDA, the fair value of the share is 7% below the current market price. This is the portal's own estimate, not a market consensus and not a target price.
The estimate relies on current conditions and does not account for possible changes in oil or gas prices. Nevertheless, even under favourable assumptions there is no upside. Combined with a multiple above its own history, this reinforces a cautious view of the stock.
Valuation on the latest reported figures
| Metric | Value |
|---|---|
| Market cap | 1.00 bn USD |
| P/E (LTM) | 31.3 |
| EV/EBITDA (LTM) | 5.8 |
| P/B | 1.45 |
| Net debt / EBITDA (LTM) | 2.43 |
| Operating cash flow (LTM) | 0.34 bn |
| ROE | 49.9% |
| EV/EBITDA, 3-year average | 2.3 |
Bottom line
The strong side of the report is revenue of USD 251.5 mn, up 44.3% year on year, and operating cash flow of USD 111.0 mn. The weak side is the rise in capex to USD 91.1 mn, which left free cash flow small, and the increase in net debt from USD 0.5 bn to USD 0.6 bn in the quarter. Valuation at an EV/EBITDA of 5.8 versus its own three-year average of 2.3, and a 7% downside on the portal model, outweigh the operating successes. The verdict is rather unattractive.
Open the company's financial profile SOIL →
See also: market overview · valuation map · stock screeners