Steel Dynamics: record shipments and wider spreads drove profit, but the stock is already above its own history
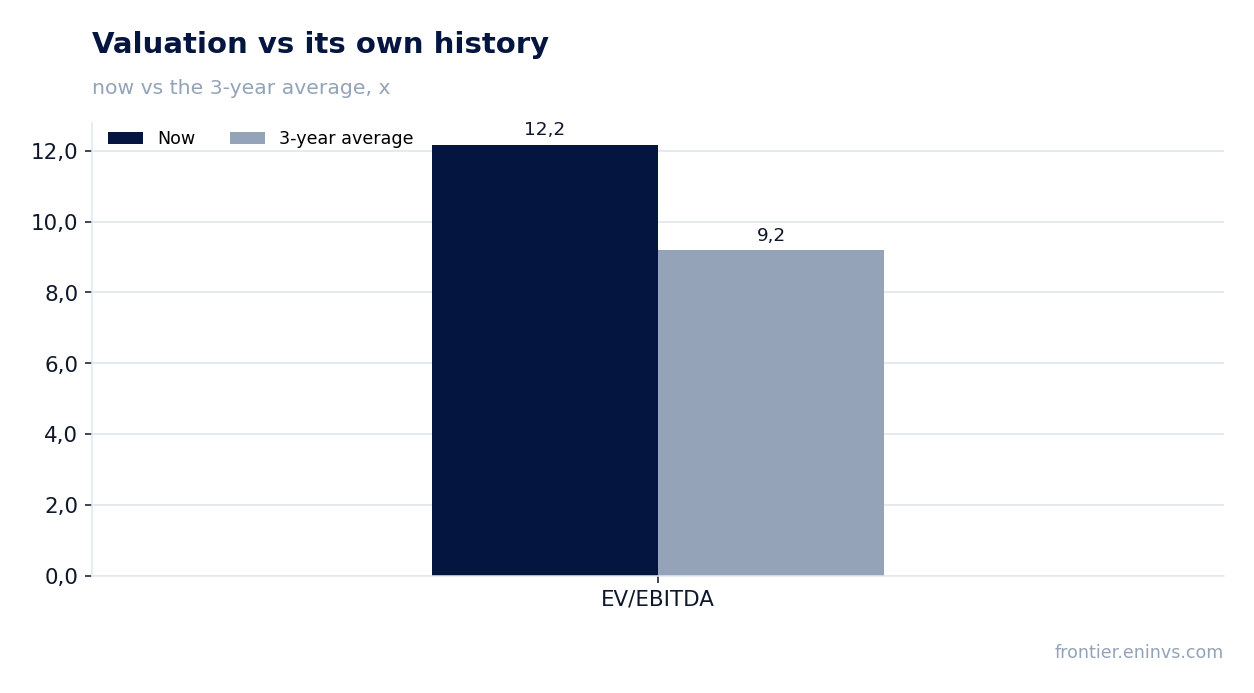
On October 20 Steel Dynamics reported third-quarter 2026 results: revenue of $6,509.4 million (+34.8% year on year), adjusted EBITDA of $1,190.3 million (+84.2%), net income of $756.0 million (+87.3%). Growth accelerated from the second quarter (+33.4%), and the EBITDA margin rose to 18.3% from 13.4% a year earlier. Yet the stock trades at EV/EBITDA LTM of 12.2 against its own three-year average of 9.2, and the portal's model puts the upside to fair value at minus 44% – with strong operating momentum but a stretched valuation, the verdict on the share at the current price is neutral.
Key takeaways
— Revenue rose 34.8% year on year, and growth accelerated from 33.4% in the second quarter
— EBITDA gained 84.2% on wider spreads: steel price rose $102 per ton while scrap fell $8
— Record steel shipments of 3.8 million tons and a 50% year-on-year rise in fabrication orders support demand
— The aluminum segment's loss narrowed to $26 million, and the platform reached EBITDA breakeven
— Free cash flow after $150 million of capex and $76 million of dividends remains solid, but $276 million went to buybacks
— Leverage at 1.11x EBITDA LTM is moderate, but the facts do not allow a direction of change to be determined
— EV/EBITDA LTM of 12.2 is 32% above its own three-year average of 9.2, and the portal's model implies minus 44% to fair value
Attractiveness
Key figures, USD bn
| Metric | Q3 2025 | Q3 2026 | Change |
|---|---|---|---|
| Revenue | 4.83 | 6.51 | +34.8% |
| EBITDA | 0.65 | 1.19 | +84.2% |
| Operating profit | 0.51 | 1.01 | +98.2% |
| Net profit | 0.40 | 0.76 | +87.3% |
| Operating cash flow | 0.72 | 0.85 | +17.0% |
| Capex | 0.17 | — | — |
| EBITDA margin | 13.4% | 18.3% | +4.9 pp |
| Net margin | 8.4% | 11.6% | +3.2 pp |
Revenue rose 34.8% year on year, and growth accelerated from 33.4% in the second quarter
Third-quarter 2026 revenue was $6,509.4 million, 34.8% above the year-earlier level. Growth in the second quarter was 33.4%, so the dynamic accelerated. A quarter earlier revenue was $6,091.6 million, so the sequential gain is also visible.
The steel segment was the main contributor: its external sales reached $4,350.4 million against $3,538.0 million a year earlier. The average external selling price rose $102 per ton sequentially, to $1,400. Steel shipments set a record at 3.8 million tons.
The aluminum segment added $475.7 million of revenue against $71.1 million a year earlier, reflecting the ramp-up of the new rolling mill. Fabrication contributed $466.3 million and metals recycling $614.8 million. The revenue growth is broad rather than concentrated in one line.
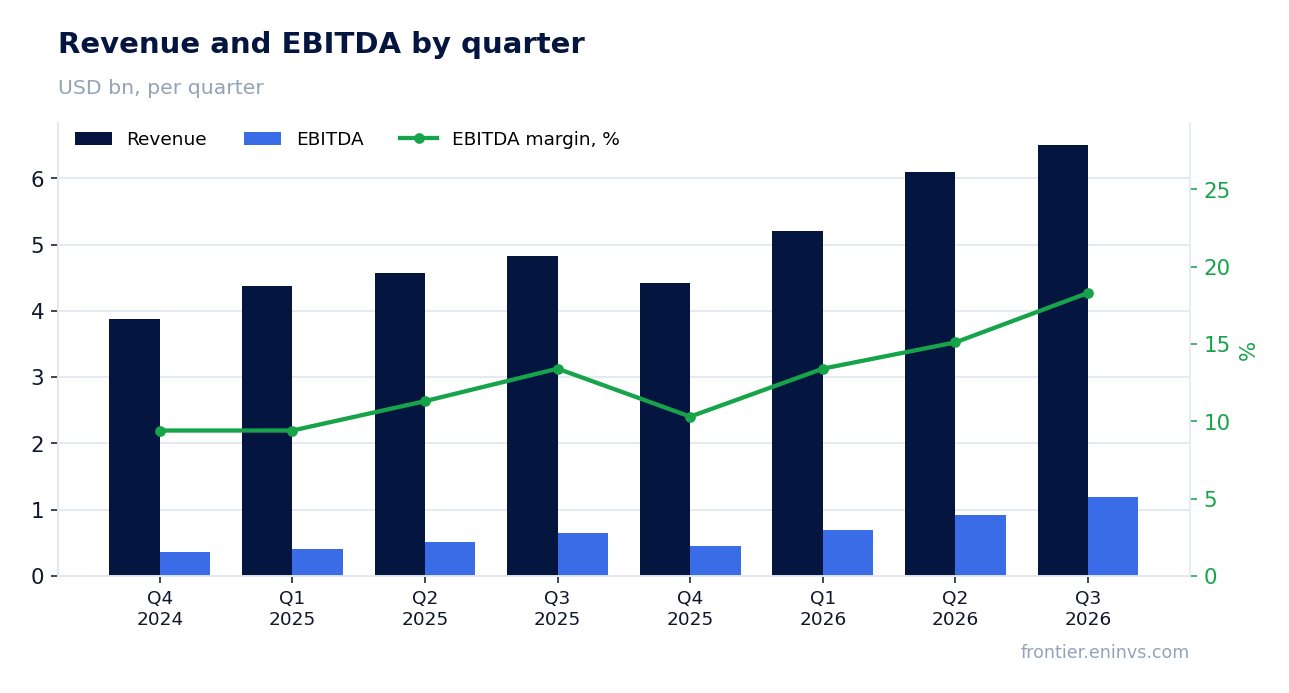
EBITDA gained 84.2% on wider spreads: steel price rose $102 per ton while scrap fell $8
Third-quarter adjusted EBITDA was $1,190.3 million, 84.2% above the year-earlier level. The EBITDA margin rose to 18.3% from 13.4%. Operating income reached $1,006.4 million against $507.8 million a year earlier.
The driver was wider steel spreads. The average realised steel price rose $102 per ton sequentially, to $1,400, while the average scrap cost fell $8, to $404 per ton. The gap between price and raw material widened, and that fed straight into the margin.
Operating income from the steel segment was $1,032.6 million against $497.9 million a year earlier. Fabrication contributed $90.6 million and metals recycling $33.0 million. The aluminum segment remained in loss at $26.2 million, but that narrowed 21% sequentially, and the platform reached EBITDA breakeven.
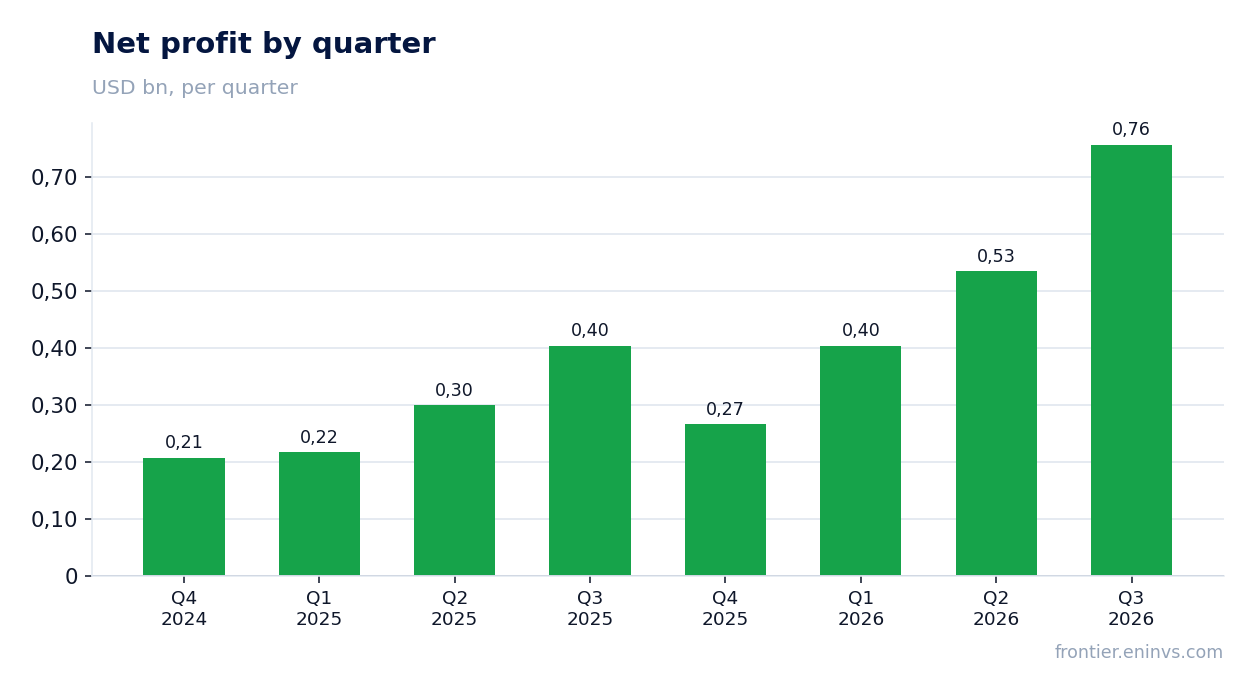
Record steel shipments of 3.8 million tons and a 50% year-on-year rise in fabrication orders support demand
Total steel shipments were 3,784.5 thousand tons against 3,613.3 thousand a year earlier – a company record. External shipments slipped slightly to 3,107.3 thousand tons, but the overall volume rose on processing.
The steel fabrication order backlog is 50% higher than a year ago and extends into the second quarter of 2027. Demand comes from commercial construction, manufacturing, warehouses, data centres and healthcare. Fabrication shipments rose 18% sequentially, to 190.2 thousand tons.
Management notes that US steel imports remain well below historical and prior-year levels, while spot prices and lead times have tightened. That supports both prices and utilisation. Part of this demand, however, rests on the federal infrastructure programme and reshoring, factors that could slow.
The aluminum segment's loss narrowed to $26 million, and the platform reached EBITDA breakeven
The aluminum segment's operating loss in the third quarter was $26.2 million against $56.5 million a year earlier and $33.4 million in the second quarter. The platform reached EBITDA breakeven. All three cold mills are operational, and the first continuous annealing and solution heat line is running and is expected to ship finished automotive product before year-end.
Aluminum sheet shipments were 55 thousand metric tons, and hot-band production was 91 thousand tons. Volumes fell short of expectations because of yield losses at higher operating speeds, caused by the coolant composition at the hot strip mill. The issue was fixed, and no additional costs are expected.
Management expects aluminum volumes and profitability to improve in the fourth quarter of 2026 and through 2027 as start-up costs subside and utilisation rises. That is a meaningful diversification argument, but for now the segment remains a cost source rather than a profit source.
Free cash flow after $150 million of capex and $76 million of dividends remains solid, but $276 million went to buybacks
Third-quarter operating cash flow was $845.8 million against $722.6 million a year earlier. Capital investment was $149.6 million, dividends $76.1 million, and share repurchases $275.6 million. Liquidity at the end of September was $2.4 billion.
Free cash flow after capex and dividends remains positive and covers shareholder returns. The company repurchased about 1% of its shares in the quarter and 2% over nine months. That supports earnings per share but reduces the share count.
For the first nine months of 2026 operating cash flow was $1,422.0 million and capex $411.4 million. For a capital-intensive producer that is a healthy ratio. The question is whether it holds if steel prices turn.
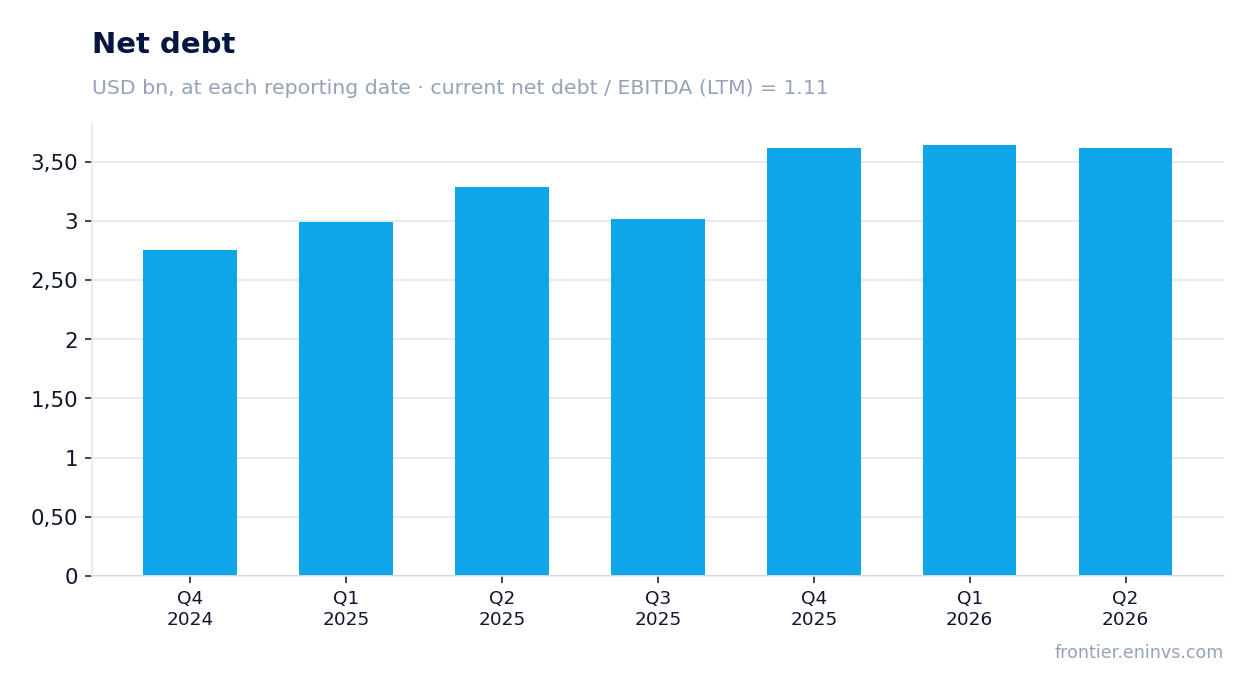
Leverage at 1.11x EBITDA LTM is moderate, but the facts do not allow a direction of change to be determined
Net debt at the latest annual balance-sheet date was $3,612.9 million, equal to 1.11x EBITDA over the last twelve months. That is a moderate level for a capital-intensive producer. Quarterly interest expense was $39.3 million against $13.6 million a year earlier, reflecting higher debt.
A comparison with the prior level is not possible: the facts contain no earlier value of the ratio. So I will not judge the direction of leverage. Absolute net debt rose from $3,614.4 million in the second quarter to $3,612.9 million at the end of the third – a minimal change.
With LTM EBITDA of $3,264.5 million and interest expense rising with debt, leverage remains manageable. But if EBITDA falls as prices turn, the ratio would rise quickly.
EV/EBITDA LTM of 12.2 is 32% above its own three-year average of 9.2, and the portal's model implies minus 44% to fair value
The EV/EBITDA LTM multiple is 12.2 against its own three-year average of 9.2, i.e. 32% above. On this multiple the stock is more expensive than its own history. P/E LTM is 18.4. Market capitalisation is $36.1 billion.
The portal's model, which reprices EBITDA at current commodity prices at the target EV/EBITDA, implies an upside to fair value of minus 44%. That is our own estimate, not a market consensus. It suggests the current price already discounts a strong cycle.
The trailing twelve-month dividend yield is 0.86%, which is modest. At this valuation and low yield the buyer's margin of safety is thin. A re-rating upward would require either further EBITDA growth or a de-rating of the multiple toward its historical average.
Valuation on the latest reported figures
| Metric | Value |
|---|---|
| Market cap | 36.1 bn USD |
| P/E (LTM) | 18.4 |
| EV/EBITDA (LTM) | 12.2 |
| P/B | 4.03 |
| Net debt / EBITDA (LTM) | 1.11 |
| Operating cash flow (LTM) | 1.69 bn |
| ROE | 10.5% |
| Dividend yield (12m) | 0.9% |
| EV/EBITDA, 3-year average | 9.2 |
Bottom line
The quarter was strong in substance: record shipments, wider spreads and an EBITDA margin up to 18.3% are operating results, not one-offs. The aluminum loss is narrowing, and fabrication orders are 50% above a year earlier. But the stock already trades at EV/EBITDA of 12.2 against its own three-year average of 9.2, and the portal's model implies minus 44% to fair value. With a dividend yield of 0.86% the margin of safety is thin, so the verdict is neutral: the business is strong, but the price already reflects it.
Open the company's financial profile STLD →
See also: market overview · valuation map · stock screeners