Suncor Energy: revenue up 50.6%, but the entire gain rests on the oil price, not on volumes
Suncor Energy reported third-quarter 2026 results: revenue reached USD 14,818.7 mn, up 50.6% year on year, EBITDA rose 93.5% to USD 5,815.9 mn and net profit 131.1% to USD 2,715.0 mn. The EBITDA margin climbed to 39.2% from 30.5% a year earlier, and net debt fell to USD 1.2 bn at the end of September. The stock trades at 5.1x LTM EV/EBITDA and 10.6x LTM P/E, with a 1.9% dividend yield; the portal's model puts upside to fair value at +33%, so the share looks rather attractive, but only as long as oil holds at the current level.
Key takeaways
— Revenue rose 50.6% year on year, and the acceleration from 48.3% in the second quarter is entirely explained by the oil price
— EBITDA rose 93.5% and the margin climbed to 39.2% from 30.5% – operating leverage worked harder than revenue
— Net profit rose 131.1% to USD 2,715.0 mn, and part of that gain is not a cash result
— Free cash flow after USD 1,074.2 mn of capex remains solid, and it is what funds the dividend
— Net debt fell to USD 1.2 bn from USD 5.1 bn a year earlier, and net debt to LTM EBITDA stands at 0.07
— A 1.9% dividend yield is modest for an oil producer, and the payout rests on profit rather than on policy
— An EV/EBITDA of 5.1x and the portal's +33% upside to fair value leave room, but it shrinks with the oil price
Attractiveness
Key figures, USD bn
| Metric | Q3 2025 | Q3 2026 | Change |
|---|---|---|---|
| Revenue | 9.84 | 14.8 | +50.6% |
| EBITDA | 3.01 | 5.82 | +93.5% |
| Operating profit | 1.75 | 3.76 | +114.3% |
| Net profit | 1.17 | 2.72 | +131.1% |
| Operating cash flow | 2.75 | 4.41 | +60.6% |
| EBITDA margin | 30.5% | 39.2% | +8.7 pp |
| Net margin | 11.9% | 18.3% | +6.4 pp |
Revenue rose 50.6% year on year, and the acceleration from 48.3% in the second quarter is entirely explained by the oil price
Third-quarter 2026 revenue came to USD 14,818.7 mn, 50.6% more than a year earlier. In the second quarter growth was 48.3%, so the pace accelerated. The gap between the two quarters is small, but it shows the company is not slowing as the base grows.
The acceleration coincided with higher oil prices, and the report gives no data to separate the price effect from the volume effect. For an oil producer this is normal: revenue follows the price of a barrel, not management decisions. So the durability of the 50.6% pace depends entirely on whether the price holds at the current level.
For an investor this means quarter-on-quarter revenue comparisons are of limited use – it is more important to watch realised prices and refinery utilisation. If the oil price retreats, revenue will fall faster than it is rising now, because the base is already high.
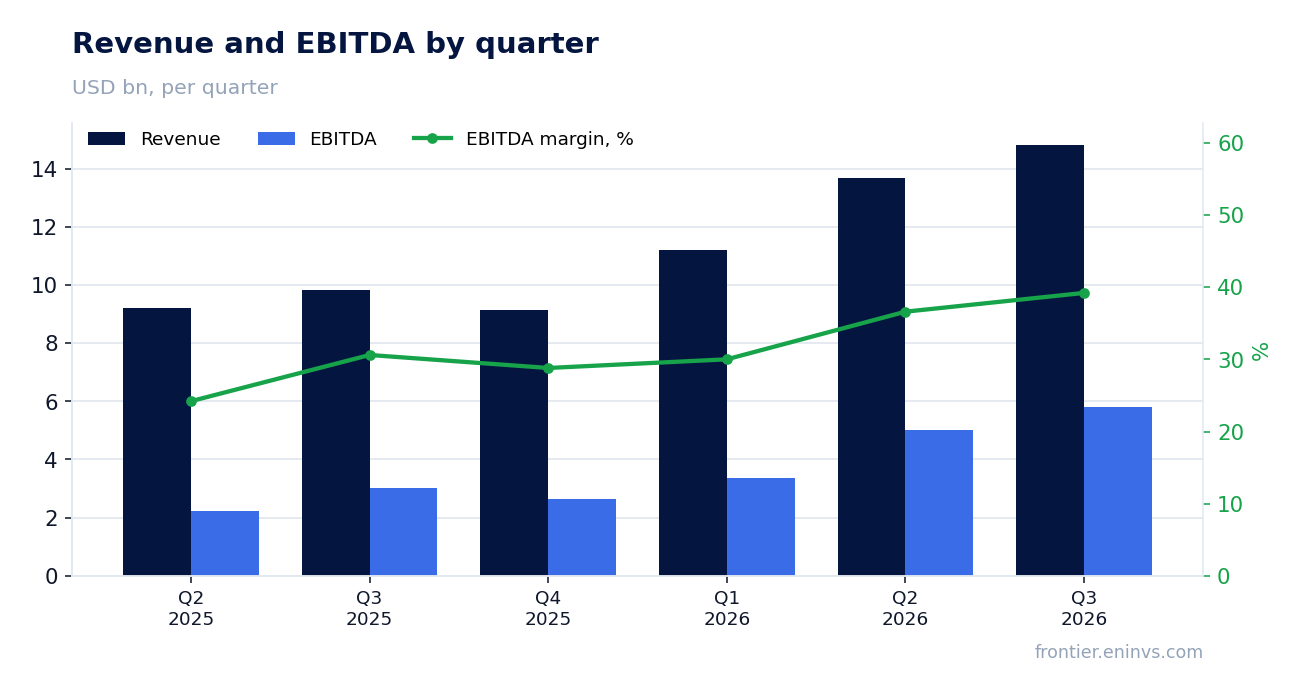
EBITDA rose 93.5% and the margin climbed to 39.2% from 30.5% – operating leverage worked harder than revenue
Third-quarter 2026 EBITDA came to USD 5,815.9 mn, 93.5% more than a year earlier. With revenue up 50.6%, that means costs grew more slowly than income. The EBITDA margin rose to 39.2% from 30.5% a year earlier – a gain of almost nine percentage points.
Such a gap between revenue and EBITDA dynamics is typical for upstream: part of the cost base is fixed, and when the oil price rises each extra unit of revenue brings disproportionately more profit. Operating profit for the quarter was USD 3,755.8 mn, confirming the improvement was not eaten by depreciation or one-off write-downs.
The durability of the 39.2% margin is the main question for the report. If the oil price stays high, the margin holds; if it retreats, the margin compresses faster than revenue, because the leverage works both ways.
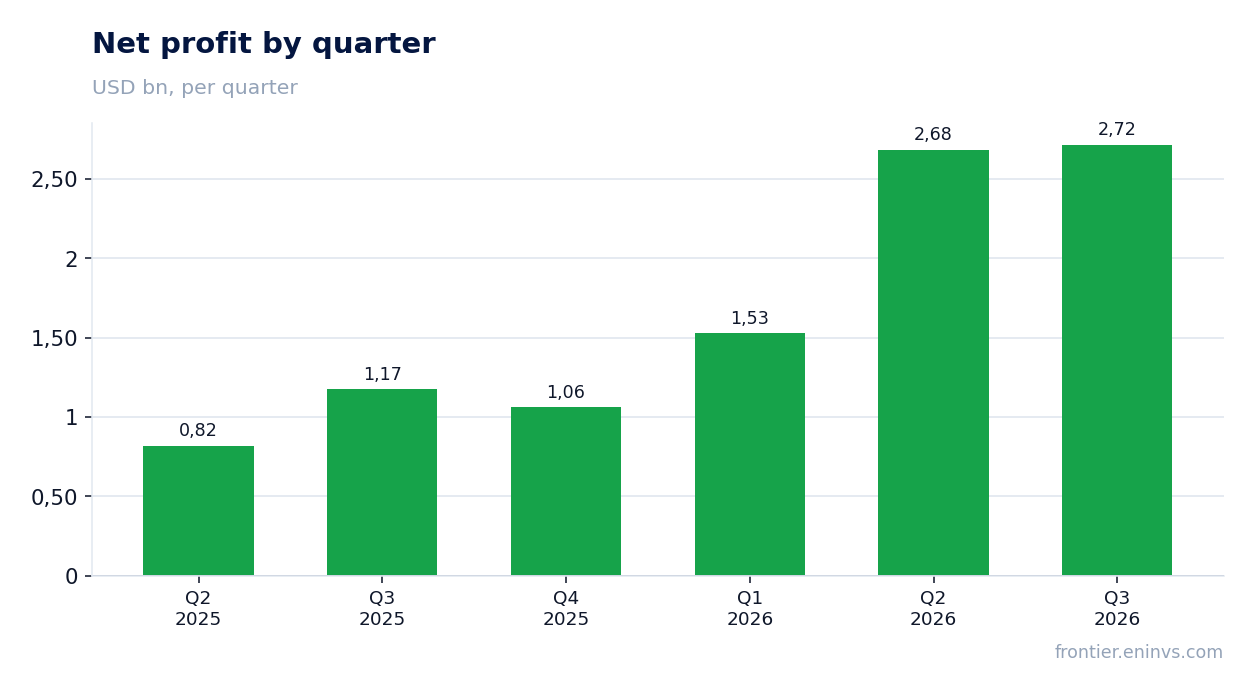
Net profit rose 131.1% to USD 2,715.0 mn, and part of that gain is not a cash result
Third-quarter 2026 net profit came to USD 2,715.0 mn, 131.1% more than a year earlier. Profit growth outpaced EBITDA growth by almost half as much again, and the net margin rose to 18.3% from 11.9%. Such outperformance usually means a one-off or non-cash item appeared below the operating line.
The report gives no breakdown that would let us name that factor precisely. Operating profit rose to USD 3,755.8 mn, and the gap between it and net profit is interest, taxes and other items. If profit grows faster than operating profit, those items, not the core business, made the difference.
For earnings quality this matters: operating cash flow was USD 4,410.7 mn and exceeds net profit, so the core business does generate cash. But the 131.1% profit growth rate should not be carried into coming quarters – it reflects both last year's base and one-off items.
Free cash flow after USD 1,074.2 mn of capex remains solid, and it is what funds the dividend
Third-quarter 2026 operating cash flow was USD 4,410.7 mn and capex USD 1,074.2 mn. The difference between them, free cash flow before dividends, exceeds USD 3.3 bn – more than enough to cover shareholder payouts and reduce debt.
Capex of USD 1,074.2 mn looks moderate against revenue of USD 14,818.7 mn: the company is not raising investment as fast as income grows. That explains why cash flow grows faster than profit and why debt is falling.
For a shareholder this is the main argument for the dividend: the payout is backed by cash, not accounting profit. If the oil price falls, free cash flow will be the first to compress, and the company will then choose between capex and the dividend.
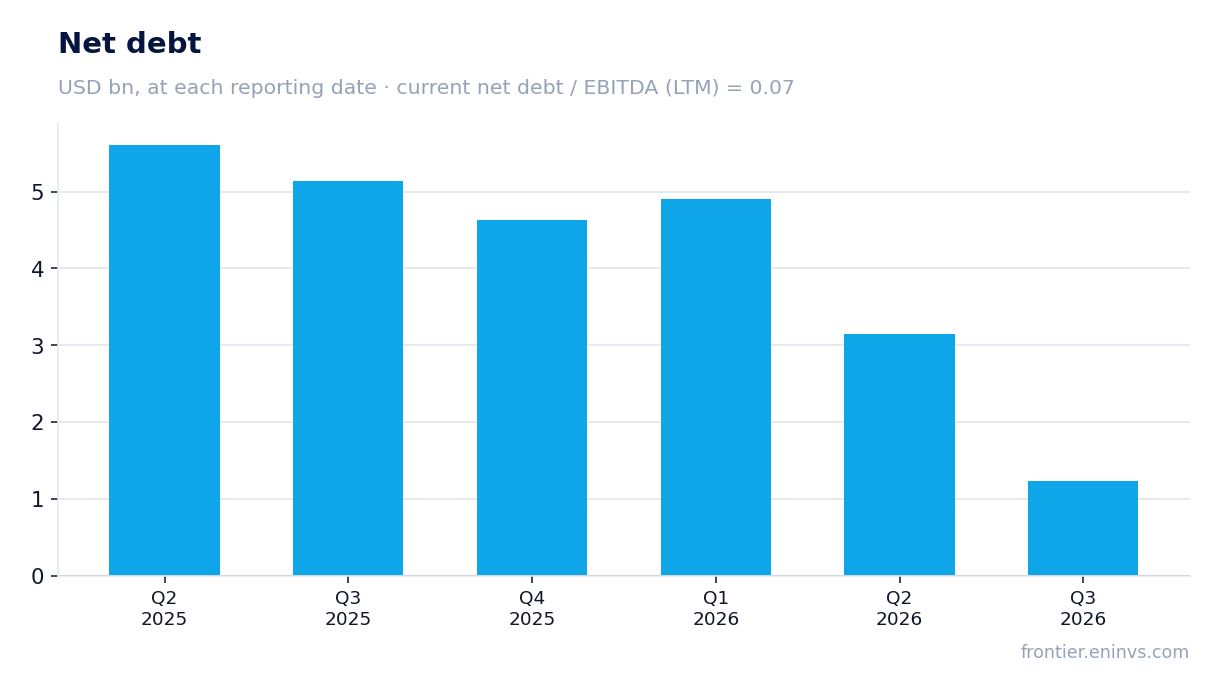
Net debt fell to USD 1.2 bn from USD 5.1 bn a year earlier, and net debt to LTM EBITDA stands at 0.07
Net debt at 30 September 2026 was USD 1.2 bn against USD 5.1 bn at 30 September 2025 – a reduction of USD 3.9 bn over the year. Over the quarter debt fell from USD 3.1 bn at 30 June to USD 1.2 bn at 30 September, a drop of USD 1.9 bn.
Net debt to LTM EBITDA is 0.07. That is a very low level: the company carries almost no debt burden, and all cash flow after capex goes to dividends and further repayment. This level cannot be compared with earlier periods – the facts contain no earlier value for the ratio.
Low debt is a cushion against a price fall. But it also means the company is not using leverage to speed up growth, and in that sense the safety margin is already realised in the balance sheet rather than in profit.
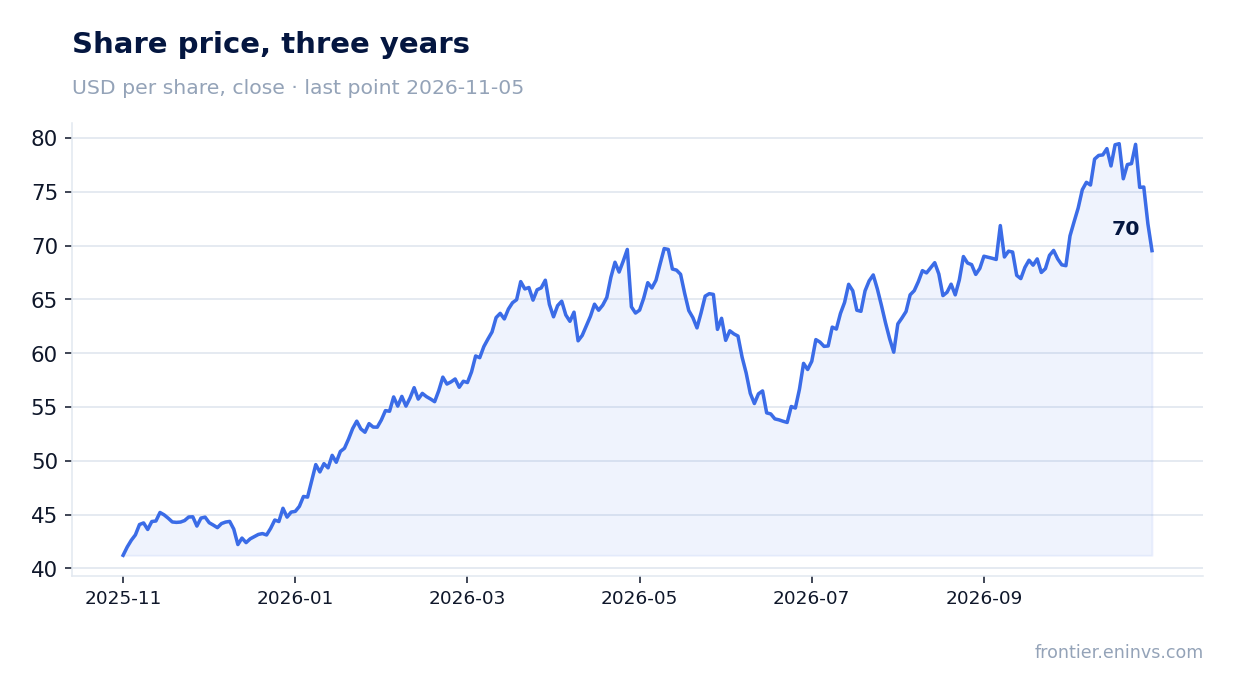
A 1.9% dividend yield is modest for an oil producer, and the payout rests on profit rather than on policy
The trailing twelve-month dividend yield is 1.9% on the current price. For an oil producer that is modest: with LTM net profit of USD 7,986.3 mn and a market cap of USD 84,838.8 mn, the company pays shareholders a small share of earnings. The facts give no data on the size of the last payment or the payout ratio, so policy can only be judged by the yield.
Our estimate: with profit and the payout ratio at current levels, the 2026 dividend will stay within a 2% yield. That is below the key rate, and for an investor buying the stock for income the level is unlikely to be sufficient. Everything depends on what share of profit the company chooses to distribute: with quarterly profit of USD 2,715.0 mn, even doubling the payout ratio would give a yield of about 4%.
A fall in the oil price could cut the payout: profit and free cash flow would compress, and the company would prefer to put money into capex. While debt is USD 1.2 bn and post-capex cash flow exceeds USD 3.3 bn a quarter, the risk of a dividend cut is small, but it is entirely tied to the price of a barrel.
An EV/EBITDA of 5.1x and the portal's +33% upside to fair value leave room, but it shrinks with the oil price
On multiples the stock looks inexpensive: LTM EV/EBITDA is 5.1x, P/E 10.6x and return on equity 31.5%. For a company generating this much cash flow with almost no debt, that is a low valuation. The facts contain no three-year multiple history, so a comparison with its own past is not possible, but the absolute level speaks for itself.
The portal's model, which re-prices EBITDA at current commodity prices at the target EV/EBITDA, puts upside to fair value at +33%. This is our own estimate, not a market consensus. It rests on the current oil price: if the price falls, re-priced EBITDA falls and the upside shrinks.
The main valuation risk is that the market already embeds a high commodity price in earnings but not in the multiple. At 5.1x EV/EBITDA an investor pays little for the current level of income, but that income may prove to be a peak. That is why the +33% cushion is a bet that the oil price holds, not a bet on business growth.
Valuation on the latest reported figures
| Metric | Value |
|---|---|
| Market cap | 84.8 bn USD |
| P/E (LTM) | 10.6 |
| EV/EBITDA (LTM) | 5.1 |
| P/B | 2.63 |
| Net debt / EBITDA (LTM) | 0.07 |
| Operating cash flow (LTM) | 13.1 bn |
| ROE | 31.5% |
| Dividend yield (12m) | 1.9% |
Bottom line
What was genuinely strong in the report was everything tied to cash: EBITDA rose 93.5%, the margin climbed to 39.2%, post-capex free cash flow exceeded USD 3.3 bn and net debt fell to USD 1.2 bn. But the 50.6% revenue growth and 131.1% profit growth are the result of a high oil price and a low base a year earlier, not of volume growth. For a shareholder the real question now is not how good the quarter was but whether the commodity price holds: profit, the 1.9% dividend and the portal's +33% upside all depend on it. While the price holds, the stock looks rather attractive at 5.1x EV/EBITDA with almost no debt.
Open the company's financial profile SU →
See also: market overview · valuation map · stock screeners