Suzano: pulp fell 2.2% but revenue rose 34.5% – EBITDA added only 8.8% and the margin slid from 40.0% to 32.3%
Contents
On 1 October Suzano released its third-quarter 2026 results. The average NBSK pulp price in the period was USD 1,310 versus USD 1,339 a year earlier (–2.2%), but it rose 7.2% quarter on quarter and spot is now USD 1,330. Revenue reached USD 3,037.5m (+34.5% year on year), EBITDA USD 981.9m (+8.8%) and net profit USD 383.3m (+5.2%). At the year-ago volumes and costs, our calculation shows the price decline would have produced revenue of USD 2,216.4m and EBITDA of USD 861.2m, so reported EBITDA beat the price-implied figure by USD 120.8m (+14.0%) and revenue by USD 821.1m (+37.0%). Our conclusion: the share is fairly valued – the portal model puts upside to fair value at +5%, and EV/EBITDA of 6.1 is essentially in line with the three-year average of 6.2. Our view: the share is fairly valued; upside on the portal model +5%.
Our view: is there upside
Our view in numbers
| Metric | Our read |
|---|---|
| Verdict | Neutral |
| Upside on the portal model | +5% |
| How the model works | spot model: EBITDA re-priced to current commodity prices at the target EV/EBITDA, against market cap |
| EV/EBITDA now and 3-year average | 6.1 vs 6.2 – in line with its history |
| Dividend yield, 12m | 0.0% |
| Net debt / EBITDA | 3.48 – high leverage |
| Strongest case for | By our calculation, reported EBITDA beat the level implied by the year-ago price by USD 120.8m (+14.0%), and at current prices EBITDA is estimated at USD 4,611.5m – 8.0% above LTM. |
| Strongest case against | The EBITDA margin fell from 40.0% to 32.3% and net profit rose only 5.2% on revenue growth of 34.5% – sales growth is not converting into profit. |
| What would change the view | If the average NBSK price holds sustainably above USD 1,330 and the EBITDA margin starts to recover, the verdict could move up one step; a reversal below USD 1,222 would move it down. |
Key takeaways
— The NBSK pulp price fell 2.2% over the year to USD 1,310, but rose 7.2% quarter on quarter and spot is already USD 1,330.
— At the year-ago volumes and costs, our calculation puts EBITDA at USD 861.2m, and the reported figure is USD 120.8m (+14.0%) higher – the gap is explained by volumes and the realised price against the benchmark.
— Revenue rose 34.5% year on year after a 4.3% decline a quarter earlier – an acceleration, yet EBITDA added only 8.8%.
— The EBITDA margin fell from 40.0% to 32.3% and the net margin from 16.1% to 12.6%: revenue growth did not translate into profit growth.
— Net debt of USD 14,098.2m is 3.48x LTM EBITDA – a level, not a trend; at current prices the ratio falls to 3.06.
— EV/EBITDA LTM of 6.1 is essentially in line with the three-year average of 6.2 (–1%), so the share is valued close to its own history.
— Trailing twelve-month dividend yield is 1.0% – the payout is small relative to the price and offers no income cushion.
Key figures, USD bn
| Metric | Q3 2025 | Q3 2026 | Change |
|---|---|---|---|
| Revenue | 2.26 | 3.04 | +34.5% |
| EBITDA | 0.90 | 0.98 | +8.8% |
| Operating profit | 0.37 | 0.29 | -19.4% |
| Net profit | 0.36 | 0.38 | +5.2% |
| Operating cash flow | 0.75 | 0.76 | +1.2% |
| Capex | 0.65 | 0.50 | -23.4% |
| EBITDA margin | 40.0% | 32.3% | -7.7 pp |
| Net margin | 16.1% | 12.6% | -3.5 pp |
The NBSK pulp price fell 2.2% over the year to USD 1,310, but rose 7.2% quarter on quarter and spot is already USD 1,330.
The average price of northern bleached softwood kraft (NBSK) pulp in the third quarter of 2026 was USD 1,310 versus USD 1,339 a year earlier – a decline of 2.2%. Quarter on quarter the price rose 7.2%, from USD 1,222, and on 1 October spot reached USD 1,330, 1.5% above the reported-period average.
For Suzano this is the main external factor: pulp accounts for 85% of revenue in the portal model. The annual decline was modest, but the quarterly trend turned upward and spot keeps rising. That trajectory determines how much the company earns next quarter.
Commodity prices: period average and now
| Benchmark | Year ago | Q3 2026 | YoY | Spot 2026-10-01 |
|---|---|---|---|---|
| Northern bleached softwood kraft, USD | 1 339 | 1 310 | -2,2% | 1 330 |
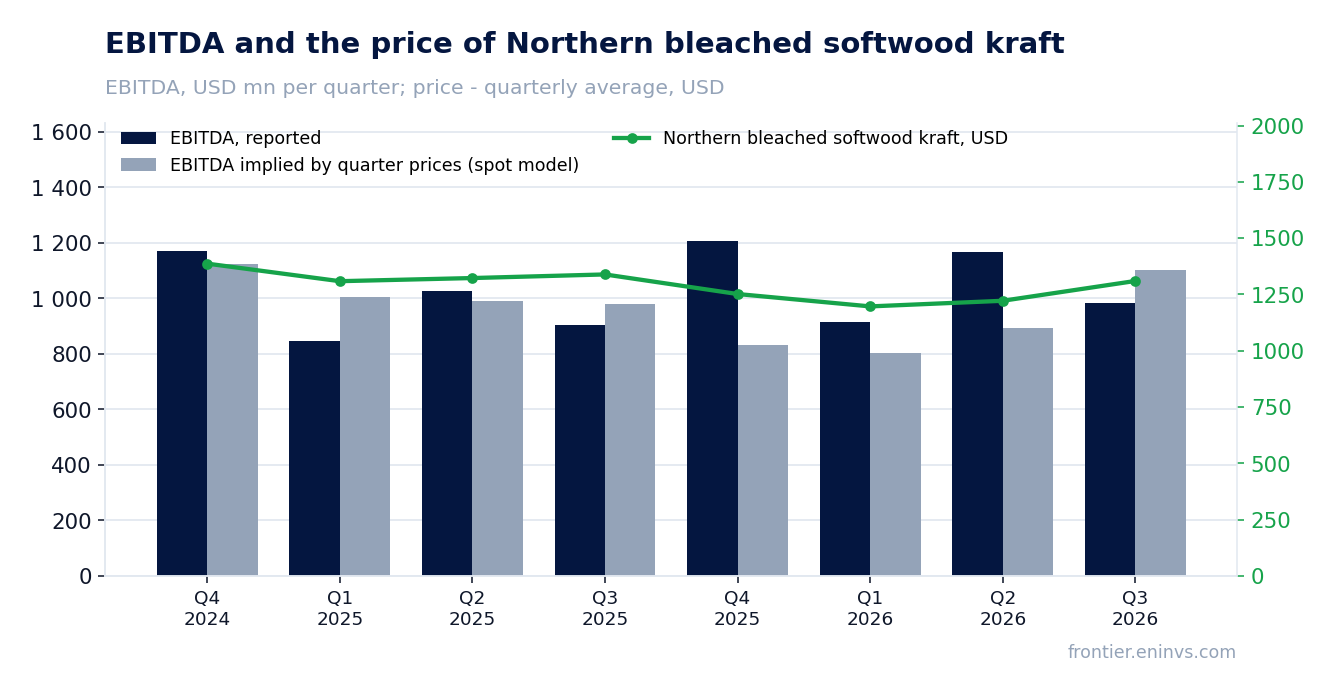
At the year-ago volumes and costs, our calculation puts EBITDA at USD 861.2m, and the reported figure is USD 120.8m (+14.0%) higher – the gap is explained by volumes and the realised price against the benchmark.
Holding third-quarter 2025 volumes and non-commodity costs and moving only the pulp price, revenue would have been USD 2,216.4m and EBITDA USD 861.2m. Reported revenue is USD 821.1m (+37.0%) higher and EBITDA USD 120.8m (+14.0%) higher.
A gap of that size is not explained by price: the benchmark actually fell over the year. So the company sold more product or realised a better price relative to the benchmark. The facts and the source name no other causes, so we state what moved: volumes and the realised price against the benchmark delivered a gain that outweighed the negative price effect of USD 41.7m on revenue.
The portal spot model, built from the average of the previous four quarters, expected EBITDA of USD 1,102.7m and revenue of USD 2,366.4m; reported EBITDA came in 11.0% below the model and revenue 28.4% above it. The model and the year-ago calculation disagree in direction, and for valuation we rely on the year-ago calculation: it holds volumes and costs fixed and isolates the price contribution.
What the prices implied and what the company earned
| Base (Q3 2025) | Implied at period prices | Reported | Reported vs implied | |
|---|---|---|---|---|
| Revenue, USD mn | 2 258 | 2 216 | 3 038 | +37,0% |
| EBITDA, USD mn | 902,8 | 861,2 | 981,9 | +14,0% |
| EBITDA, portal spot model, USD mn | — | 1 103 | 981,9 | -11,0% |
Revenue and EBITDA by quarter
| Period | Measure | bn USD |
|---|---|---|
| Q4 2024 | Revenue | 1.6461 |
| Q1 2025 | Revenue | 2.0556799999999997 |
| Q2 2025 | Revenue | 2.384743 |
| Q3 2025 | Revenue | 2.258109 |
| Q4 2025 | Revenue | 2.3946750000000003 |
| Q1 2026 | Revenue | 2.186032 |
| Q2 2026 | Revenue | 2.282376 |
| Q3 2026 | Revenue | 3.037509 |
| Q4 2024 | EBITDA | 1.169616 |
| Q1 2025 | EBITDA | 0.846345 |
| Q2 2025 | EBITDA | 1.024932 |
| Q3 2025 | EBITDA | 0.902837 |
| Q4 2025 | EBITDA | 1.208199 |
| Q1 2026 | EBITDA | 0.913162 |
| Q2 2026 | EBITDA | 1.1660329999999999 |
| Q3 2026 | EBITDA | 0.981938 |
EBITDA margin
| Period | Measure | % |
|---|---|---|
| Q4 2024 | EBITDA margin | 71.1 |
| Q1 2025 | EBITDA margin | 41.2 |
| Q2 2025 | EBITDA margin | 43.0 |
| Q3 2025 | EBITDA margin | 40.0 |
| Q4 2025 | EBITDA margin | 50.5 |
| Q1 2026 | EBITDA margin | 41.8 |
| Q2 2026 | EBITDA margin | 51.1 |
| Q3 2026 | EBITDA margin | 32.3 |
Revenue rose 34.5% year on year after a 4.3% decline a quarter earlier – an acceleration, yet EBITDA added only 8.8%.
In the third quarter of 2026 revenue was USD 3,037.5m, 34.5% more than a year earlier. In the second quarter the trend was negative – minus 4.3% – so growth accelerated. EBITDA, however, rose only 8.8%, to USD 981.9m, while operating profit was USD 294.9m.
The gap between revenue and EBITDA means sales growth came with disproportionate cost growth. Operating profit of USD 294.9m plus depreciation of USD 687m gives EBITDA of USD 981.9m; depreciation absorbs most of the operating result but does not affect EBITDA itself. The weak spot is the operating margin, which compressed more than the price trend alone would imply.
The EBITDA margin fell from 40.0% to 32.3% and the net margin from 16.1% to 12.6%: revenue growth did not translate into profit growth.
The EBITDA margin in the reported quarter was 32.3% versus 40.0% a year earlier. The net margin fell from 16.1% to 12.6%, and net profit rose only 5.2%, to USD 383.3m. With revenue up 34.5%, that means each additional unit of sales brought less profit than a year ago.
The cause is costs: the pulp price fell over the year, while revenue rose on volumes and the realised price, but cost of sales grew faster. The facts give no cost breakdown, so we state only what is visible: operating profit of USD 294.9m on revenue of USD 3,037.5m is about 9.7% of revenue, whereas a year earlier operating profit was USD 365.9m on revenue of USD 2,258.1m, or 16.2%.
Net debt of USD 14,098.2m is 3.48x LTM EBITDA – a level, not a trend; at current prices the ratio falls to 3.06.
As of 30 September 2026 net debt was USD 14,098.2m, equal to 3.48x EBITDA for the trailing twelve months. That is a leverage level; the facts give no earlier value to compare with, so we do not comment on direction. Operating cash flow in the reported quarter was USD 758.7m and capital expenditure USD 495.4m, so free cash flow before interest and dividends remains positive.
At current pulp prices the portal model estimates annual EBITDA at USD 4,611.5m versus USD 4,269.3m for the trailing twelve months (+8.0%). On that base net debt to EBITDA falls to 3.06 and EV/EBITDA to 5.7. For a commodity producer this is a more relevant starting point than LTM: the trailing twelve months reflect past prices, not today's.
Valuation vs its own history
now vs the 3-year average
| Period | Measure | × |
|---|---|---|
| EV/EBITDA | Now | 6.142093093008612 |
| EV/EBITDA | 3-year average | 6.209599043179425 |
EV/EBITDA LTM of 6.1 is essentially in line with the three-year average of 6.2 (–1%), so the share is valued close to its own history.
EV/EBITDA for the trailing twelve months is 6.1 against a three-year average of 6.2 – a deviation of just 1%, so the multiple sits at its historical level. P/E LTM is 7.5, market capitalisation USD 12,124.4m and return on equity 15.0%.
The portal model re-prices EBITDA at current pulp prices and the target EV/EBITDA; against market capitalisation that gives upside to fair value of +5%. At EV/EBITDA of 5.7 on current prices the share looks neither cheap nor expensive: the market already reflects today's price level, and there is almost no cushion.
Share price, three years
close, last point 2026-11-10
| Period | Measure | USD per share |
|---|---|---|
| 2025-11-10 | Closing price | 8.75 |
| 2025-11-11 | Closing price | 8.850000381469727 |
| 2025-11-12 | Closing price | 9.079999923706055 |
| 2025-11-13 | Closing price | 8.979999542236328 |
| 2025-11-14 | Closing price | 8.90999984741211 |
| 2025-11-17 | Closing price | 9.069999694824219 |
| 2025-11-18 | Closing price | 9.149999618530273 |
| 2025-11-19 | Closing price | 9.09000015258789 |
| 2025-11-20 | Closing price | 8.989999771118164 |
| 2025-11-21 | Closing price | 8.949999809265137 |
| 2025-11-24 | Closing price | 8.899999618530273 |
| 2025-11-25 | Closing price | 8.869999885559082 |
| 2025-11-26 | Closing price | 8.960000038146973 |
| 2025-11-28 | Closing price | 8.949999809265137 |
| 2025-12-01 | Closing price | 8.880000114440918 |
| 2025-12-02 | Closing price | 9.050000190734863 |
| 2025-12-03 | Closing price | 9.220000267028809 |
| 2025-12-04 | Closing price | 9.289999961853027 |
| 2025-12-05 | Closing price | 9.239999771118164 |
| 2025-12-08 | Closing price | 9.239999771118164 |
| 2025-12-09 | Closing price | 9.270000457763672 |
| 2025-12-10 | Closing price | 9.4399995803833 |
| 2025-12-11 | Closing price | 9.130000114440918 |
| 2025-12-12 | Closing price | 9.020000457763672 |
| 2025-12-15 | Closing price | 9.010000228881836 |
| 2025-12-16 | Closing price | 8.920000076293945 |
| 2025-12-17 | Closing price | 8.989999771118164 |
| 2025-12-18 | Closing price | 9.539999961853027 |
| 2025-12-19 | Closing price | 9.470000267028809 |
| 2025-12-22 | Closing price | 9.1899995803833 |
| 2025-12-23 | Closing price | 9.300000190734863 |
| 2025-12-24 | Closing price | 9.270000457763672 |
| 2025-12-26 | Closing price | 9.319999694824219 |
| 2025-12-29 | Closing price | 9.260000228881836 |
| 2025-12-30 | Closing price | 9.350000381469727 |
| 2025-12-31 | Closing price | 9.34000015258789 |
| 2026-01-02 | Closing price | 9.520000457763672 |
| 2026-01-05 | Closing price | 9.350000381469727 |
| 2026-01-06 | Closing price | 9.3100004196167 |
| 2026-01-07 | Closing price | 9.3100004196167 |
| 2026-01-08 | Closing price | 9.270000457763672 |
| 2026-01-09 | Closing price | 9.550000190734863 |
| 2026-01-12 | Closing price | 9.65999984741211 |
| 2026-01-13 | Closing price | 9.609999656677246 |
| 2026-01-14 | Closing price | 9.65999984741211 |
| 2026-01-15 | Closing price | 9.739999771118164 |
| 2026-01-16 | Closing price | 9.640000343322754 |
| 2026-01-20 | Closing price | 9.5600004196167 |
| 2026-01-21 | Closing price | 9.75 |
| 2026-01-22 | Closing price | 9.859999656677246 |
| 2026-01-23 | Closing price | 9.850000381469727 |
| 2026-01-26 | Closing price | 9.789999961853027 |
| 2026-01-27 | Closing price | 9.829999923706055 |
| 2026-01-28 | Closing price | 9.890000343322754 |
| 2026-01-29 | Closing price | 9.529999732971191 |
| 2026-01-30 | Closing price | 9.369999885559082 |
| 2026-02-02 | Closing price | 9.319999694824219 |
| 2026-02-03 | Closing price | 9.40999984741211 |
| 2026-02-04 | Closing price | 9.449999809265137 |
| 2026-02-05 | Closing price | 9.579999923706055 |
| 2026-02-06 | Closing price | 9.680000305175781 |
| 2026-02-09 | Closing price | 9.850000381469727 |
| 2026-02-10 | Closing price | 9.850000381469727 |
| 2026-02-11 | Closing price | 11.180000305175781 |
| 2026-02-12 | Closing price | 11.229999542236328 |
| 2026-02-13 | Closing price | 11.180000305175781 |
| 2026-02-17 | Closing price | 10.970000267028809 |
| 2026-02-18 | Closing price | 10.880000114440918 |
| 2026-02-19 | Closing price | 10.9399995803833 |
| 2026-02-20 | Closing price | 10.989999771118164 |
| 2026-02-23 | Closing price | 11.0 |
| 2026-02-24 | Closing price | 11.329999923706055 |
| 2026-02-25 | Closing price | 11.4399995803833 |
| 2026-02-26 | Closing price | 11.460000038146973 |
| 2026-02-27 | Closing price | 11.329999923706055 |
| 2026-03-02 | Closing price | 11.180000305175781 |
| 2026-03-03 | Closing price | 10.850000381469727 |
| 2026-03-04 | Closing price | 10.75 |
| 2026-03-05 | Closing price | 10.529999732971191 |
| 2026-03-06 | Closing price | 10.399999618530273 |
| 2026-03-09 | Closing price | 10.670000076293945 |
| 2026-03-10 | Closing price | 10.699999809265137 |
| 2026-03-11 | Closing price | 10.600000381469727 |
| 2026-03-12 | Closing price | 10.149999618530273 |
| 2026-03-13 | Closing price | 10.010000228881836 |
| 2026-03-16 | Closing price | 10.140000343322754 |
| 2026-03-17 | Closing price | 10.119999885559082 |
| 2026-03-18 | Closing price | 10.020000457763672 |
| 2026-03-19 | Closing price | 9.729999542236328 |
| 2026-03-20 | Closing price | 9.40999984741211 |
| 2026-03-23 | Closing price | 9.789999961853027 |
| 2026-03-24 | Closing price | 9.680000305175781 |
| 2026-03-25 | Closing price | 9.819999694824219 |
| 2026-03-26 | Closing price | 9.619999885559082 |
| 2026-03-27 | Closing price | 9.609999656677246 |
| 2026-03-30 | Closing price | 9.609999656677246 |
| 2026-03-31 | Closing price | 10.010000228881836 |
| 2026-04-01 | Closing price | 10.09000015258789 |
| 2026-04-02 | Closing price | 9.850000381469727 |
| 2026-04-06 | Closing price | 9.649999618530273 |
| 2026-04-07 | Closing price | 9.020000457763672 |
| 2026-04-08 | Closing price | 9.239999771118164 |
| 2026-04-09 | Closing price | 9.420000076293945 |
| 2026-04-10 | Closing price | 9.399999618530273 |
| 2026-04-13 | Closing price | 9.510000228881836 |
| 2026-04-14 | Closing price | 9.6899995803833 |
| 2026-04-15 | Closing price | 9.529999732971191 |
| 2026-04-16 | Closing price | 9.520000457763672 |
| 2026-04-17 | Closing price | 9.649999618530273 |
| 2026-04-20 | Closing price | 9.59000015258789 |
| 2026-04-21 | Closing price | 9.479999542236328 |
| 2026-04-22 | Closing price | 9.539999961853027 |
| 2026-04-23 | Closing price | 9.350000381469727 |
| 2026-04-24 | Closing price | 9.100000381469727 |
| 2026-04-27 | Closing price | 9.100000381469727 |
| 2026-04-28 | Closing price | 9.069999694824219 |
| 2026-04-29 | Closing price | 8.930000305175781 |
| 2026-04-30 | Closing price | 8.869999885559082 |
| 2026-05-01 | Closing price | 8.710000038146973 |
| 2026-05-04 | Closing price | 8.550000190734863 |
| 2026-05-05 | Closing price | 8.600000381469727 |
| 2026-05-06 | Closing price | 8.739999771118164 |
| 2026-05-07 | Closing price | 8.770000457763672 |
| 2026-05-08 | Closing price | 8.869999885559082 |
| 2026-05-11 | Closing price | 8.739999771118164 |
| 2026-05-12 | Closing price | 8.75 |
| 2026-05-13 | Closing price | 8.569999694824219 |
| 2026-05-14 | Closing price | 8.539999961853027 |
| 2026-05-15 | Closing price | 8.210000038146973 |
| 2026-05-18 | Closing price | 8.369999885559082 |
| 2026-05-19 | Closing price | 8.140000343322754 |
| 2026-05-20 | Closing price | 8.449999809265137 |
| 2026-05-21 | Closing price | 8.449999809265137 |
| 2026-05-22 | Closing price | 8.3100004196167 |
| 2026-05-26 | Closing price | 8.329999923706055 |
| 2026-05-27 | Closing price | 8.359999656677246 |
| 2026-05-28 | Closing price | 8.260000228881836 |
| 2026-05-29 | Closing price | 8.180000305175781 |
| 2026-06-01 | Closing price | 8.119999885559082 |
| 2026-06-02 | Closing price | 8.0600004196167 |
| 2026-06-03 | Closing price | 8.039999961853027 |
| 2026-06-04 | Closing price | 8.029999732971191 |
| 2026-06-05 | Closing price | 8.180000305175781 |
| 2026-06-08 | Closing price | 8.119999885559082 |
| 2026-06-09 | Closing price | 8.149999618530273 |
| 2026-06-10 | Closing price | 8.020000457763672 |
| 2026-06-11 | Closing price | 8.149999618530273 |
| 2026-06-12 | Closing price | 8.229999542236328 |
| 2026-06-15 | Closing price | 8.449999809265137 |
| 2026-06-16 | Closing price | 8.420000076293945 |
| 2026-06-17 | Closing price | 8.279999732971191 |
| 2026-06-18 | Closing price | 8.390000343322754 |
| 2026-06-22 | Closing price | 8.210000038146973 |
| 2026-06-23 | Closing price | 8.039999961853027 |
| 2026-06-24 | Closing price | 8.109999656677246 |
| 2026-06-25 | Closing price | 8.100000381469727 |
| 2026-06-26 | Closing price | 7.71999979019165 |
| 2026-06-29 | Closing price | 7.670000076293945 |
| 2026-06-30 | Closing price | 7.760000228881836 |
| 2026-07-01 | Closing price | 7.809999942779541 |
| 2026-07-02 | Closing price | 7.880000114440918 |
| 2026-07-06 | Closing price | 7.980000019073486 |
| 2026-07-07 | Closing price | 8.010000228881836 |
| 2026-07-08 | Closing price | 7.929999828338623 |
| 2026-07-09 | Closing price | 7.989999771118164 |
| 2026-07-10 | Closing price | 8.069999694824219 |
| 2026-07-13 | Closing price | 8.109999656677246 |
| 2026-07-14 | Closing price | 8.149999618530273 |
| 2026-07-15 | Closing price | 8.1899995803833 |
| 2026-07-16 | Closing price | 8.199999809265137 |
| 2026-07-17 | Closing price | 8.210000038146973 |
| 2026-07-20 | Closing price | 8.239999771118164 |
| 2026-07-21 | Closing price | 8.239999771118164 |
| 2026-07-22 | Closing price | 8.449999809265137 |
| 2026-07-23 | Closing price | 8.34000015258789 |
| 2026-07-24 | Closing price | 8.289999961853027 |
| 2026-07-27 | Closing price | 8.220000267028809 |
| 2026-07-28 | Closing price | 8.40999984741211 |
| 2026-07-29 | Closing price | 8.300000190734863 |
| 2026-07-30 | Closing price | 8.4399995803833 |
| 2026-07-31 | Closing price | 8.520000457763672 |
| 2026-08-03 | Closing price | 8.529999732971191 |
| 2026-08-04 | Closing price | 8.350000381469727 |
| 2026-08-05 | Closing price | 8.350000381469727 |
| 2026-08-06 | Closing price | 8.25 |
| 2026-08-07 | Closing price | 8.220000267028809 |
| 2026-08-10 | Closing price | 8.119999885559082 |
| 2026-08-11 | Closing price | 7.840000152587891 |
| 2026-08-12 | Closing price | 8.020000457763672 |
| 2026-08-13 | Closing price | 7.989999771118164 |
| 2026-08-14 | Closing price | 8.109999656677246 |
| 2026-08-17 | Closing price | 7.860000133514404 |
| 2026-08-18 | Closing price | 7.929999828338623 |
| 2026-08-19 | Closing price | 8.34000015258789 |
| 2026-08-20 | Closing price | 8.5 |
| 2026-08-21 | Closing price | 8.779999732971191 |
| 2026-08-24 | Closing price | 9.069999694824219 |
| 2026-08-25 | Closing price | 9.029999732971191 |
| 2026-08-26 | Closing price | 8.9399995803833 |
| 2026-08-27 | Closing price | 8.960000038146973 |
| 2026-08-28 | Closing price | 8.899999618530273 |
| 2026-08-31 | Closing price | 8.720000267028809 |
| 2026-09-01 | Closing price | 8.859999656677246 |
| 2026-09-02 | Closing price | 9.140000343322754 |
| 2026-09-03 | Closing price | 9.149999618530273 |
| 2026-09-04 | Closing price | 9.170000076293945 |
| 2026-09-08 | Closing price | 9.229999542236328 |
| 2026-09-09 | Closing price | 9.270000457763672 |
| 2026-09-10 | Closing price | 9.430000305175781 |
| 2026-09-11 | Closing price | 9.359999656677246 |
| 2026-09-14 | Closing price | 9.199999809265137 |
| 2026-09-15 | Closing price | 9.229999542236328 |
| 2026-09-16 | Closing price | 9.100000381469727 |
| 2026-09-17 | Closing price | 9.260000228881836 |
| 2026-09-18 | Closing price | 9.289999961853027 |
| 2026-09-21 | Closing price | 9.25 |
| 2026-09-22 | Closing price | 9.550000190734863 |
| 2026-09-23 | Closing price | 9.210000038146973 |
| 2026-09-24 | Closing price | 8.779999732971191 |
| 2026-09-25 | Closing price | 8.6899995803833 |
| 2026-09-28 | Closing price | 8.569999694824219 |
| 2026-09-29 | Closing price | 8.520000457763672 |
| 2026-09-30 | Closing price | 8.569999694824219 |
| 2026-10-01 | Closing price | 8.300000190734863 |
| 2026-10-02 | Closing price | 8.5 |
| 2026-10-05 | Closing price | 8.430000305175781 |
| 2026-10-06 | Closing price | 8.399999618530273 |
| 2026-10-07 | Closing price | 8.420000076293945 |
| 2026-10-08 | Closing price | 8.510000228881836 |
| 2026-10-09 | Closing price | 8.569999694824219 |
| 2026-10-12 | Closing price | 8.529999732971191 |
| 2026-10-13 | Closing price | 8.630000114440918 |
| 2026-10-14 | Closing price | 8.5600004196167 |
| 2026-10-15 | Closing price | 8.350000381469727 |
| 2026-10-16 | Closing price | 8.5 |
| 2026-10-19 | Closing price | 8.5 |
| 2026-10-20 | Closing price | 8.449999809265137 |
| 2026-10-21 | Closing price | 8.449999809265137 |
| 2026-10-22 | Closing price | 8.529999732971191 |
| 2026-10-23 | Closing price | 8.640000343322754 |
| 2026-10-26 | Closing price | 8.819999694824219 |
| 2026-10-27 | Closing price | 8.899999618530273 |
| 2026-10-28 | Closing price | 8.989999771118164 |
| 2026-10-29 | Closing price | 9.229999542236328 |
| 2026-10-30 | Closing price | 9.239999771118164 |
| 2026-11-02 | Closing price | 9.25 |
| 2026-11-03 | Closing price | 9.25 |
| 2026-11-04 | Closing price | 9.5600004196167 |
| 2026-11-05 | Closing price | 9.5 |
| 2026-11-06 | Closing price | 9.65999984741211 |
| 2026-11-09 | Closing price | 9.779999732971191 |
| 2026-11-10 | Closing price | 9.779999732971191 |
Trailing twelve-month dividend yield is 1.0% – the payout is small relative to the price and offers no income cushion.
The trailing twelve-month dividend yield is 1.0%. That is a low level: with the share price close to fair value, the payout does not compensate for the lack of profit growth. The facts give no dividend per share or payout ratio, so future payments cannot be estimated.
For a holder this means the share's return must come from EBITDA growth, not from the dividend. At current pulp prices EBITDA can rise 8.0% relative to LTM, but that is not enough to make the dividend yield meaningful. If pulp prices keep rising the company could increase payouts, but for now the yield remains symbolic.
Valuation on the latest reported figures
| Metric | Value |
|---|---|
| Market cap | 12.1 bn USD |
| P/E (LTM) | 7.5 |
| EV/EBITDA (LTM) | 6.1 |
| P/B | 1.51 |
| Net debt / EBITDA (LTM) | 3.48 |
| Operating cash flow (LTM) | 3.18 bn |
| ROE | 15.0% |
| Dividend yield (12m) | 0.0% |
| EV/EBITDA, 3-year average | 6.2 |
Net profit by quarter
| Period | Measure | bn USD |
|---|---|---|
| Q4 2024 | Net profit | −1.0904310000000002 |
| Q1 2025 | Net profit | 1.129569 |
| Q2 2025 | Net profit | 0.898941 |
| Q3 2025 | Net profit | 0.364435 |
| Q4 2025 | Net profit | 0.021213000000000003 |
| Q1 2026 | Net profit | 0.85939 |
| Q2 2026 | Net profit | 0.35593400000000003 |
| Q3 2026 | Net profit | 0.383277 |
Bottom line
The quarter's strength was revenue growth of 34.5% after a 4.3% decline a quarter earlier – an acceleration – and by our calculation reported EBITDA beat the price-implied figure by USD 120.8m (+14.0%). But revenue growth did not turn into profit growth: EBITDA added only 8.8%, the margin fell from 40.0% to 32.3% and net profit rose 5.2%. Leverage at 3.48x LTM EBITDA is a level, not an improvement, and a 1.0% dividend yield offers no cushion. Our conclusion: the share is fairly valued – the portal model shows +5% upside, and EV/EBITDA of 6.1 matches the three-year average of 6.2. Our view: the share is fairly valued; upside on the portal model +5%.