PetroTal: EBITDA up 8.8% but net profit down 72.6% — the gap is cost structure, not one-offs
PetroTal reported results for the second quarter of 2026, ended 30 June. Revenue fell 9.3% year on year to USD 70.7 million, while EBITDA rose 8.8% to USD 47.6 million and net profit collapsed 72.6% to USD 4.8 million. The EBITDA margin rose to 67.3% from 56.1%, but the net margin compressed to 6.8% from 22.5%. With an EV/EBITDA of 2.4 against its own three-year average of 1.07 and the portal model pointing to 19% upside, the share looks rather attractive, but the gap between EBITDA and profit needs explaining.
Key takeaways
— Revenue fell 9.3% year on year, but EBITDA rose 8.8% — the gap is cost structure, not one-offs
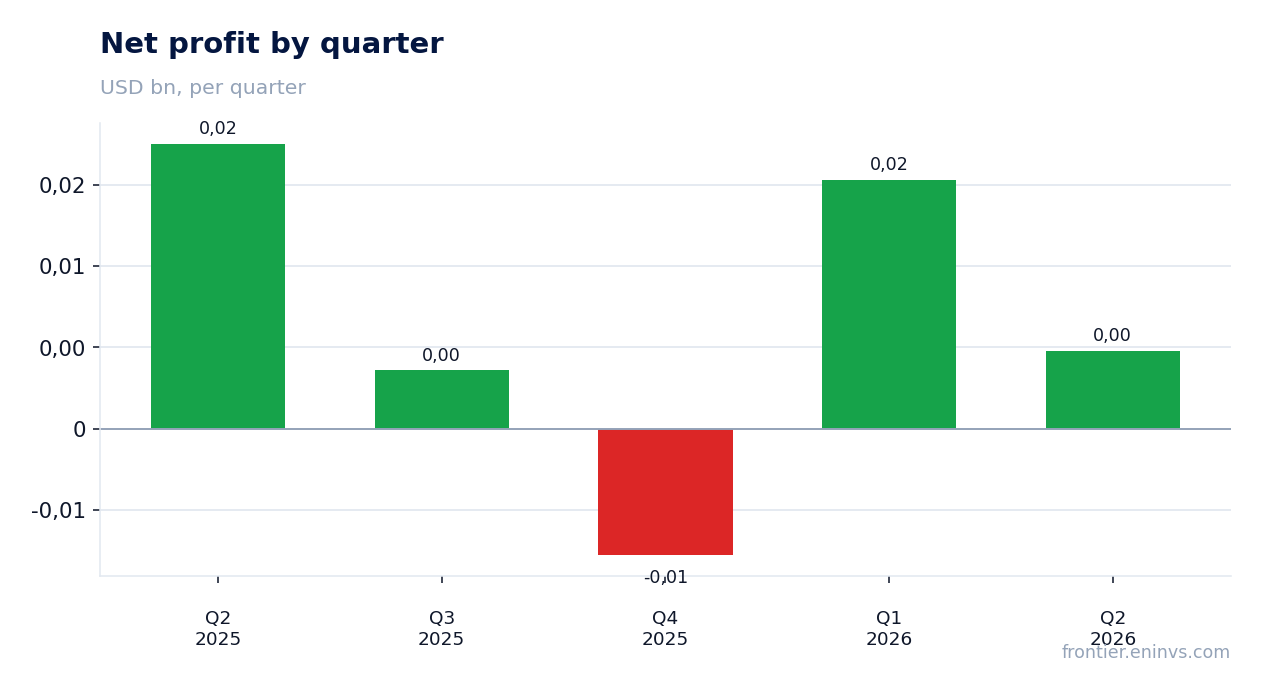
— The EBITDA margin rose to 67.3% from 56.1%, but the net margin compressed to 6.8% from 22.5% — items below the operating line ate the profit
— Operating profit in the second quarter was USD 10.0 million versus USD 21.5 million a year earlier — a 53.2% decline
— Operating cash flow for the quarter was USD 28.2 million, capital expenditure USD 11.2 million, free cash flow remains positive
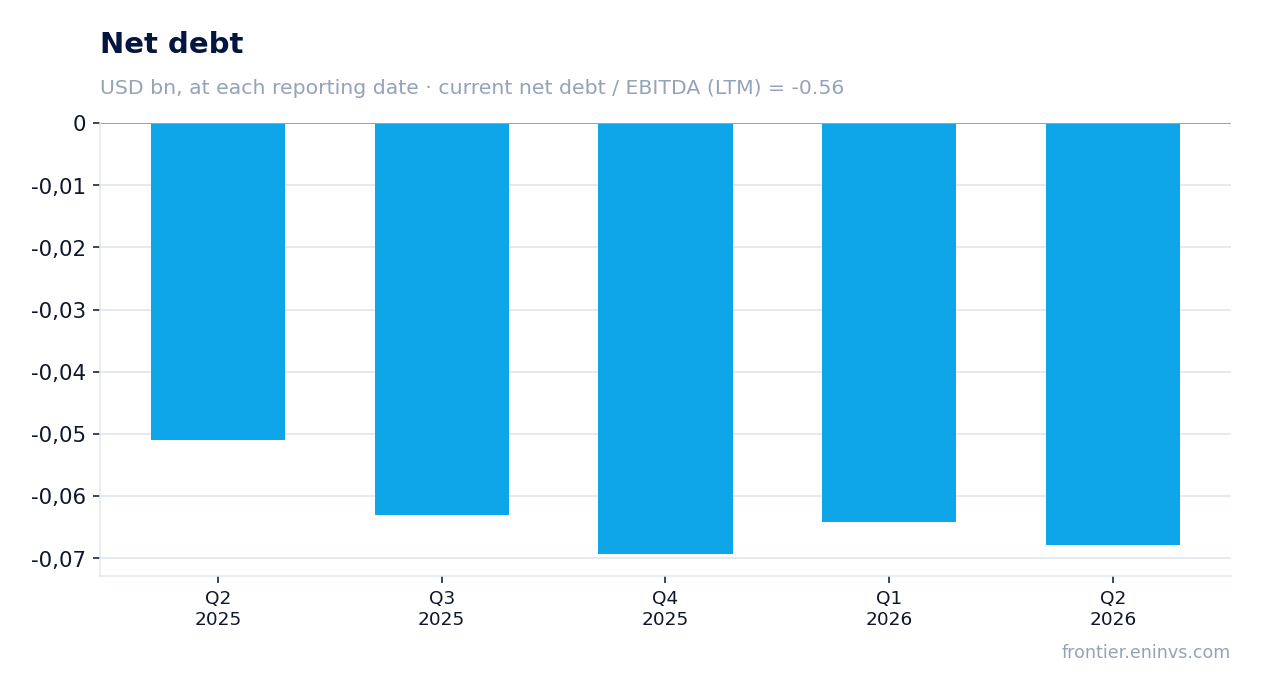
— Net debt at 30 June 2026 was minus USD 67.9 million — the company retains a net cash position
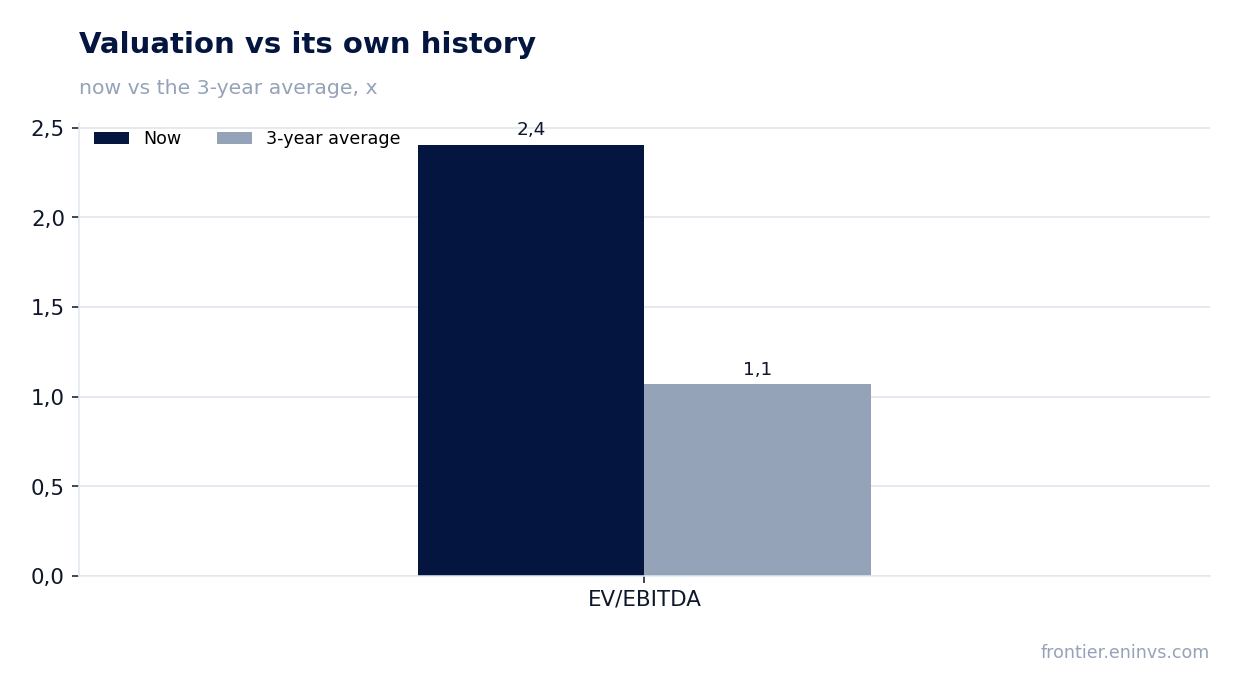
— EV/EBITDA of 2.4 against its own three-year average of 1.07 — the stock trades above its history, but the absolute level remains low
— On the portal's model, the upside to fair value is 19%
Attractiveness
Key figures, USD bn
| Metric | Q2 2025 | Q2 2026 | Change |
|---|---|---|---|
| Revenue | 0.08 | 0.07 | -9.3% |
| EBITDA | 0.04 | 0.05 | +8.8% |
| Operating profit | 0.02 | 0.01 | -53.2% |
| Net profit | 0.02 | 0.00 | -72.6% |
| Operating cash flow | 0.05 | 0.03 | -44.9% |
| Capex | -0.02 | -0.01 | — |
| EBITDA margin | 56.1% | 67.3% | +11.2 pp |
| Net margin | 22.5% | 6.8% | -15.7 pp |
Revenue fell 9.3% year on year, but EBITDA rose 8.8% — the gap is cost structure, not one-offs
PetroTal's revenue for the second quarter of 2026 was USD 70.7 million, down 9.3% from USD 77.9 million a year earlier. The decline in revenue alongside an 8.8% increase in EBITDA to USD 47.6 million indicates that the company cut variable costs or benefited from its cost structure, rather than from one-off items. EBITDA is earnings before interest, taxes, depreciation and amortisation, and its growth on falling revenue means operating expenses fell faster than income.
The EBITDA margin rose to 67.3% from 56.1% a year earlier. Such a margin level is typical for companies with a high share of fixed costs, where a revenue decline does not immediately translate into a profit drop. However, it is important to understand that EBITDA does not account for depreciation, which can be significant for a capital-intensive business, nor does it reflect tax and interest payments.
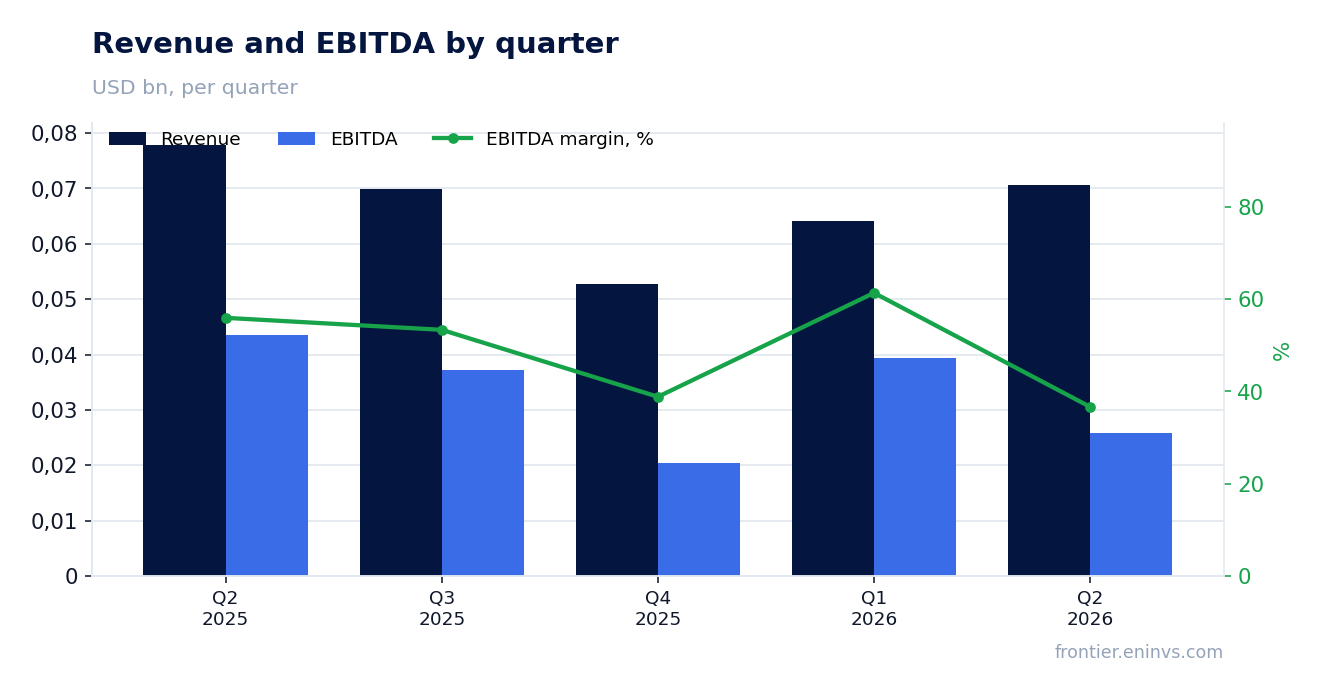
The EBITDA margin rose to 67.3% from 56.1%, but the net margin compressed to 6.8% from 22.5% — items below the operating line ate the profit
PetroTal's net profit for the second quarter of 2026 was USD 4.8 million, down 72.6% from USD 17.5 million a year earlier. The net margin fell to 6.8% from 22.5%. Operating profit declined to USD 10.0 million from USD 21.5 million, a 53.2% drop. The gap between EBITDA growth and the fall in operating profit is explained by higher depreciation or other operating expenses not included in EBITDA.
The sharper fall in net profit compared to operating profit indicates that negative changes also occurred below the operating line — possibly higher interest expenses or taxes. However, the provided facts do not detail these items, so the exact cause cannot be established. It is important to note the fact itself: profit fell much more than revenue and EBITDA.
Operating profit in the second quarter was USD 10.0 million versus USD 21.5 million a year earlier — a 53.2% decline
PetroTal's operating profit for the second quarter of 2026 was USD 10.0 million, down 53.2% from USD 21.5 million in the same period last year. This decline is significantly deeper than the 9.3% revenue drop and contrasts with the 8.8% EBITDA growth. This divergence means that expenses not included in EBITDA (depreciation, impairment or other operating items) increased or new ones appeared.
For an investor, this is an important signal: EBITDA growth does not necessarily mean improved operating efficiency if it is accompanied by a fall in operating profit. In this case, the company shows EBITDA growth against falling revenue and operating profit, which may be due to changes in cost structure or accounting policy. Without additional information from the report, the exact cause is unclear.
Operating cash flow for the quarter was USD 28.2 million, capital expenditure USD 11.2 million, free cash flow remains positive
PetroTal's operating cash flow for the second quarter of 2026 was USD 28.2 million, down 44.9% from USD 51.2 million a year earlier. Capital expenditure for the quarter was USD 11.2 million versus USD 17.1 million a year earlier. Despite the decline in operating cash flow, it remains positive and exceeds capital expenditure, ensuring positive free cash flow.
Free cash flow (operating cash flow minus capital expenditure) was USD 17.0 million. This allows the company to fund ongoing operations and potentially return capital to shareholders. However, the near-halving of operating cash flow year on year indicates a deterioration in cash generation, which may be due to both the revenue decline and changes in working capital.
Net debt at 30 June 2026 was minus USD 67.9 million — the company retains a net cash position
PetroTal's net debt at 30 June 2026 was minus USD 67.9 million, meaning cash and equivalents exceed debt obligations. A year earlier, at 30 June 2025, net debt was also negative at minus USD 51.0 million. Thus, over the year, the net cash position increased by USD 16.9 million.
The net debt to EBITDA ratio for the trailing twelve months is minus 0.56. The negative value confirms that the company has no debt burden but rather a net cash cushion. This gives PetroTal resilience to potential oil price fluctuations and the ability to fund capital expenditure without borrowing.
EV/EBITDA of 2.4 against its own three-year average of 1.07 — the stock trades above its history, but the absolute level remains low
PetroTal's current EV/EBITDA multiple is 2.4, above its own three-year average of 1.07. This means the market values the company more expensively than on average over the past three years. However, the absolute level of the multiple remains low, which may indicate continued undervaluation relative to historical values.
The trailing twelve-month P/E is 22.8, and return on equity (ROE) is 3.6%. The low ROE with a high P/E reflects weak current profitability, consistent with the fall in net profit in the second quarter. The company's market capitalisation is USD 363.4 million.
On the portal's model, the upside to fair value is 19%
According to the portal's model, which re-prices EBITDA at current commodity prices at the target EV/EBITDA, the fair value of PetroTal shares is 19% above the current market price. This is the portal's own estimate, not a market consensus or a target price. The model takes into account current commodity prices and assumes the multiple returns to the target level.
The 19% upside, with a current EV/EBITDA of 2.4 and a net cash position, makes the stock interesting for investors willing to accept risks related to oil price volatility and the company's operating results. However, it should be noted that the model is based on assumptions that may not materialise.
Valuation on the latest reported figures
| Metric | Value |
|---|---|
| Market cap | 0.36 bn USD |
| P/E (LTM) | 22.8 |
| EV/EBITDA (LTM) | 2.4 |
| P/B | 0.71 |
| Net debt / EBITDA (LTM) | -0.56 |
| Operating cash flow (LTM) | 0.10 bn |
| ROE | 3.6% |
| EV/EBITDA, 3-year average | 1.1 |
Bottom line
PetroTal reported for the second quarter of 2026: revenue fell 9.3% year on year to USD 70.7 million, EBITDA rose 8.8% to USD 47.6 million, but net profit collapsed 72.6% to USD 4.8 million. The strong points are EBITDA and margin growth to 67.3%, as well as a net cash position of USD 67.9 million. The weak point is the fall in operating and net profit, indicating problems below the operating line. With an EV/EBITDA of 2.4 against a three-year average of 1.07 and 19% upside on the portal's model, the share looks rather attractive, but confirmation requires sustained profit growth.
Open the company's financial profile TAL →
See also: market overview · valuation map · stock screeners