Talos Energy: revenue up 32.4%, but a $120.6 million hedging loss ate the profit

On November 3, Talos Energy reported third-quarter 2026 results. Revenue came in at $595.991 million, up 32.4% year on year, adjusted EBITDA reached $406.067 million at a 68.1% margin, while the net loss was $81.244 million. Operating cash flow stayed positive at $325.8 million, but a $120.576 million hedging loss outweighed operating income of $156.938 million. On the portal's model the share is 40% above its current price, yet with an LTM EV/EBITDA of 3.75 and revenue growth decelerating from 56.5% in Q2 to 32.4% in Q3, the stock looks neutral.
Key takeaways
— Revenue rose 32.4% on the back of $549.8 million in oil revenue
— EBITDA margin of 68.1% expanded from 52.6% a year earlier on a premium to WTI of about $1.60 per barrel
— The $81.244 million net loss was driven by a $120.576 million hedging loss
— Operating cash flow of $325.8 million covered capital expenditures of $127.883 million
— Net debt of $1,014.8 million with a net debt to LTM EBITDA ratio of 0.6x
— The company repurchased 1.4 million shares for $23.6 million, returning $61.8 million to shareholders year to date
— LTM EV/EBITDA of 3.75 against a portal model implying -40% upside
Attractiveness
Key figures, USD bn
| Metric | Q3 2025 | Q3 2026 | Change |
|---|---|---|---|
| Revenue | 0.45 | 0.60 | +32.4% |
| EBITDA | 0.24 | 0.41 | +71.6% |
| Operating profit | -0.09 | — | — |
| Net profit | -0.10 | -0.08 | — |
| Operating cash flow | 0.11 | 0.33 | +185.4% |
| Capex | 0.09 | 0.13 | +49.6% |
| EBITDA margin | 52.6% | 68.1% | +15.5 pp |
| Net margin | -21.3% | -13.6% | +7.7 pp |
Revenue rose 32.4% on the back of $549.8 million in oil revenue
Third-quarter 2026 revenue came in at $595.991 million, up 32.4% year on year. Oil contributed the bulk at $549.8 million, or 92% of total revenue. Gas brought in $32.139 million and NGLs $14.052 million.
Revenue growth decelerated from 56.5% in the second quarter. The slowdown reflects production of 91.5 thousand barrels of oil equivalent per day, of which 68.5 thousand barrels per day was oil. The average realized oil price was $87.19 per barrel, a $1.60 premium to WTI.
The company closed its acquisition of deepwater assets from Shell on September 22, 2026, so their contribution to third-quarter revenue was limited to a few days. The full effect will show up in the fourth quarter.
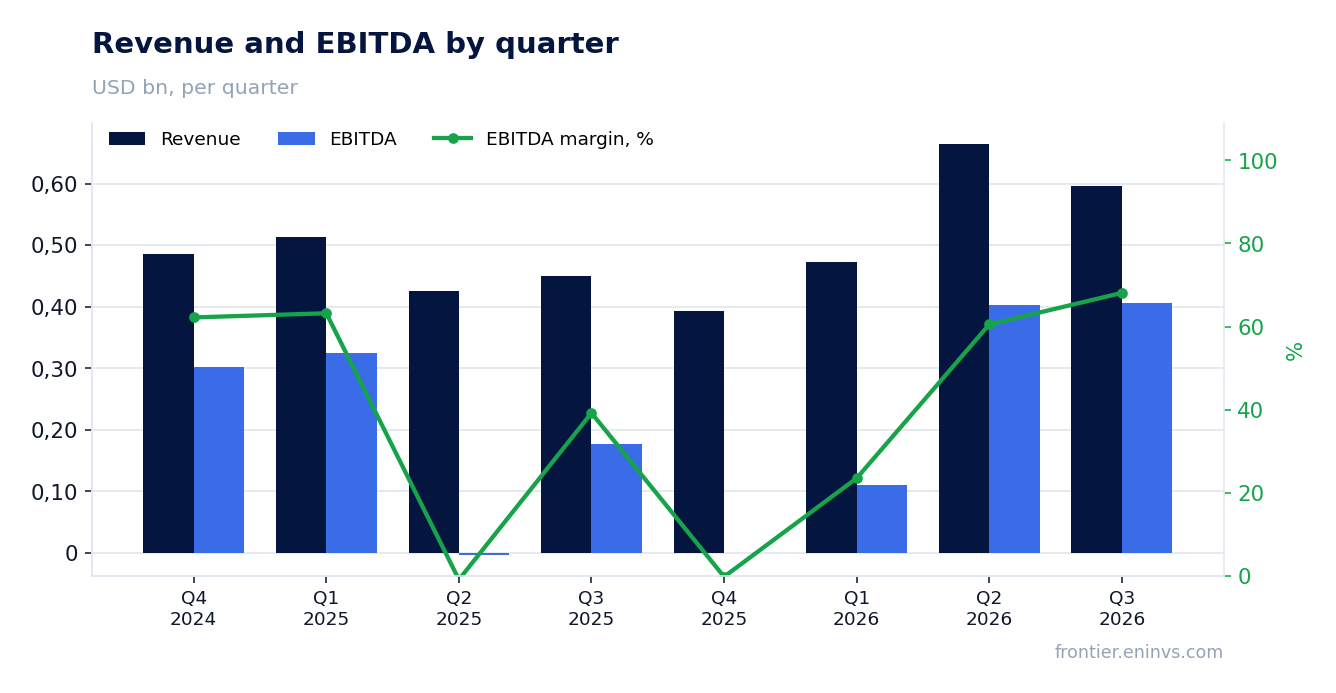
EBITDA margin of 68.1% expanded from 52.6% a year earlier on a premium to WTI of about $1.60 per barrel
Adjusted EBITDA for the third quarter was $406.067 million, with a margin of 68.1% versus 52.6% a year earlier. The company attributes this level to a premium to WTI of about $1.60 per barrel and low operating costs per barrel.
Lease operating expenses were $140.856 million, or $16.74 per barrel of oil equivalent. Adjusted general and administrative expenses were $37.824 million, or $4.50 per barrel. These remain among the lowest in the industry.
The margin expansion is partly due to the absence of storm-related downtime in the third quarter, which had weighed on production a year earlier. The company also delivered its $100 million cost-optimization program ahead of schedule.
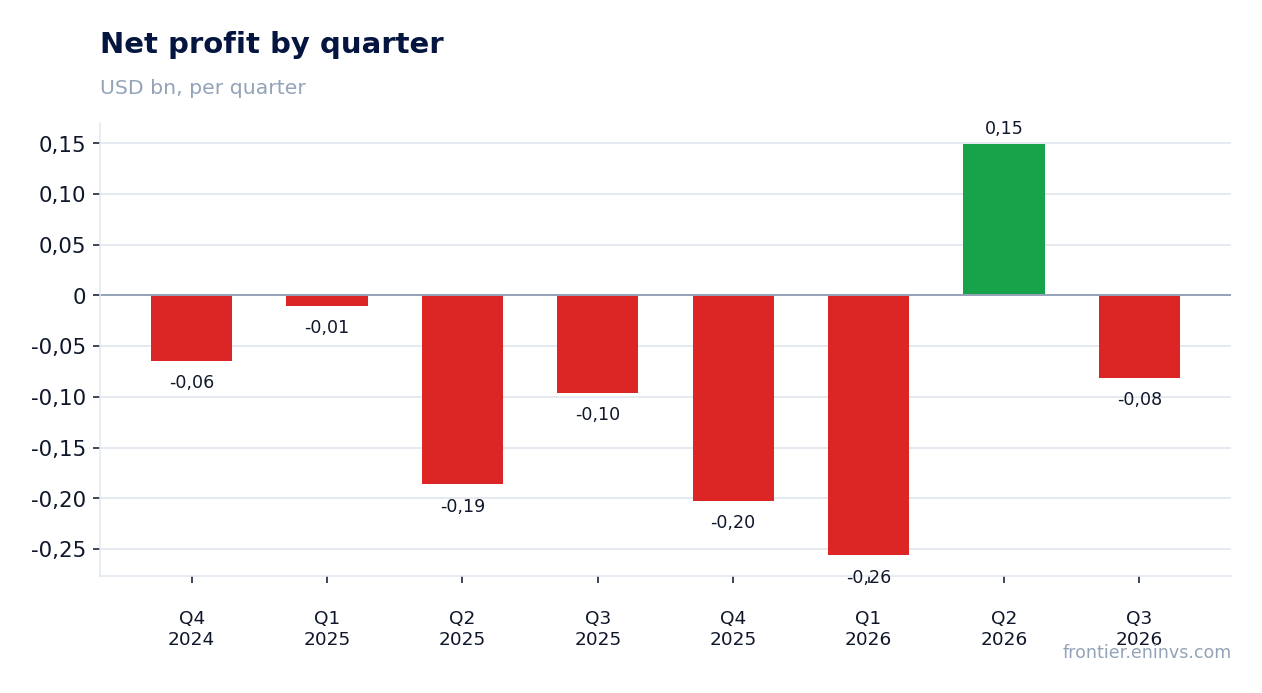
The $81.244 million net loss was driven by a $120.576 million hedging loss
The third-quarter net loss was $81.244 million, or $0.49 per share. Operating income was positive at $156.938 million, but it was outweighed by a $120.576 million loss on the revaluation of production hedges.
Adjusted net income, which strips out non-cash hedging effects, was $99.319 million, or $0.58 per share. This shows the underlying business remains profitable and the loss is accounting-driven.
The hedging loss stems from rising oil prices: the company locked in part of future production at below-market prices. For the fourth quarter of 2026, 4 thousand barrels per day are contracted at a fixed price of $62.50, which at current prices will generate further accounting losses.
Operating cash flow of $325.8 million covered capital expenditures of $127.883 million
Third-quarter operating cash flow was $325.8 million. Capital expenditures were $127.883 million, of which $96.623 million went to U.S. drilling and completions. Free cash flow before interest and dividends remained solid.
The company also spent $49.948 million on plugging and abandonment and decommissioning obligations. These costs are not part of capital expenditures but are part of cash expenses.
For the nine months of 2026, operating cash flow was $800.432 million, up from $734.046 million in the same period last year. The growth is supported by high EBITDA and lower interest expense.
Net debt of $1,014.8 million with a net debt to LTM EBITDA ratio of 0.6x
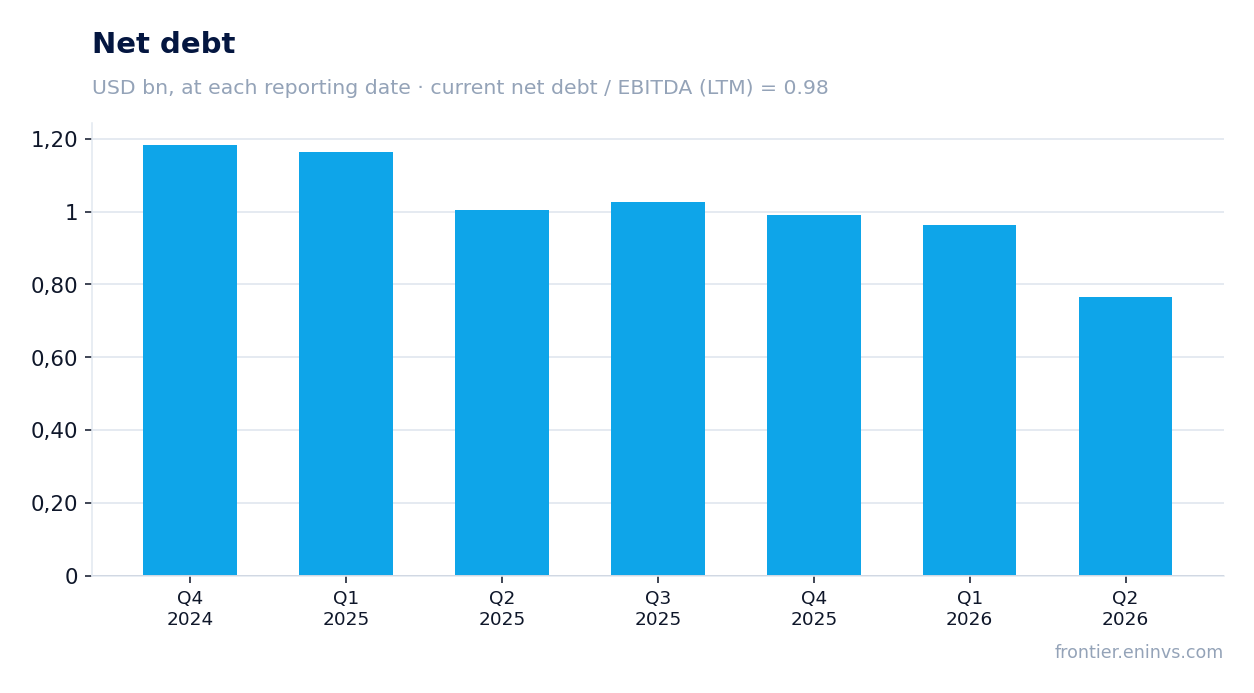
As of September 30, 2026, total debt was $1,425.0 million, cash was $410.2 million and net debt was $1,014.8 million. The ratio of net debt to LTM EBITDA was 0.6x.
The $850.0 million credit facility remained undrawn, and liquidity reached $1,076.3 million including $183.8 million in letters of credit. Low leverage gives the company flexibility for further acquisitions.
The FACTS show net debt of $943.062 million on the latest annual balance sheet and a net debt to LTM EBITDA ratio of 0.98. The difference from the release reflects different dates and calculation bases, but leverage remains moderate in both cases.
The company repurchased 1.4 million shares for $23.6 million, returning $61.8 million to shareholders year to date
In the third quarter Talos repurchased 1.4 million shares for $23.6 million. Year-to-date shareholder returns reached $61.8 million, and shares outstanding have been reduced by about 8% since the program launched in the second quarter of 2025.
The remaining repurchase authorization as of September 30, 2026, was about $176 million. The company plans to allocate up to 50% of annual free cash flow to buybacks.
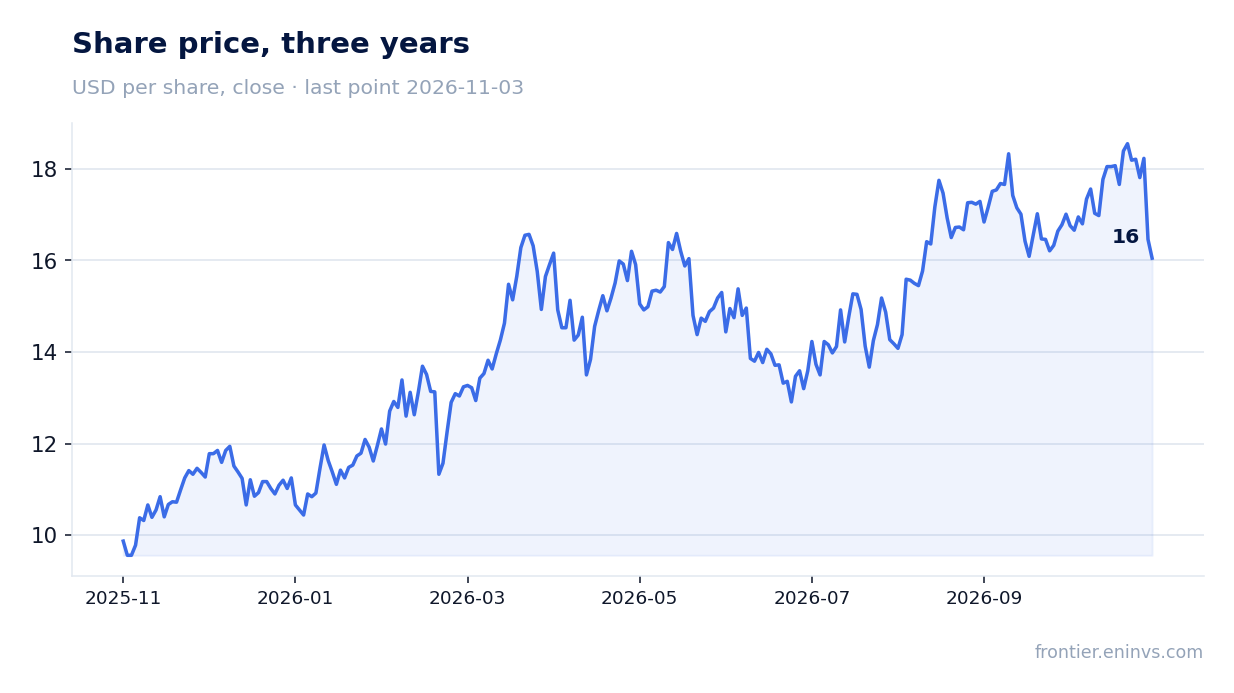
Talos pays no dividends, so all shareholder returns come through buybacks. At the current price of $16.46 and a market capitalization of $2,679.8 million, the $176 million authorization equals about 6.6% of market cap.
LTM EV/EBITDA of 3.75 against a portal model implying -40% upside
The LTM EV/EBITDA multiple is 3.75. The FACTS do not provide a three-year historical average, so it is impossible to say whether the stock trades above or below its own history.
On the portal's model, which reprices EBITDA at current commodity prices at the target EV/EBITDA, the share is 40% above its current price. This is the portal's own model, not a market consensus or a target price.
Return on equity is 30.6%, reflecting the high profitability of the business. However, the net loss in the reported quarter and the hedging loss may limit market-cap growth in the short term.
Valuation on the latest reported figures
| Metric | Value |
|---|---|
| Market cap | 2.68 bn USD |
| EV/EBITDA (LTM) | 3.8 |
| P/B | 1.24 |
| Net debt / EBITDA (LTM) | 0.98 |
| Operating cash flow (LTM) | 1.00 bn |
| ROE | 30.6% |
Bottom line
The quarter's strength was revenue of $595.991 million and a 68.1% EBITDA margin, reflecting low operating costs and a premium to WTI. However, the $81.244 million net loss and the $120.576 million hedging loss show that profit depends on non-cash revaluations. Operating cash flow of $325.8 million covers capital expenditures, and net debt of $1,014.8 million at 0.6x LTM EBITDA leaves room for maneuver. The question for a holder now is whether the company can sustain its margin and revenue growth after integrating the acquired assets, given the deceleration to 32.4%.
Open the company's financial profile TALO →
See also: market overview · valuation map · stock screeners