Trulieve Cannabis: revenue fell 20.1% on Harvest deconsolidation, but EBITDA held at $60.2 million
On November 5, Trulieve Cannabis reported third-quarter 2026 results. Revenue was $230.2 million, down 20.1% year on year, EBITDA was $60.2 million, and net income was $0.8 million. The revenue decline is explained by the Harvest deconsolidation, but even without it the company earned less than cannabis prices allowed: at year-ago volumes and costs, our calculation implies revenue of $280.2 million and EBITDA of $63.7 million. With low leverage (0.19x EBITDA) and an EV/EBITDA of 9.0x, the share looks neutral: the current price already reflects revenue weakness, but a turnaround in volumes is needed for growth.
Key takeaways
— The average cannabis price in the quarter was $1,064 – 2.8% below a year earlier but 2.3% above the previous quarter
— At year-ago volumes and costs, our calculation implies revenue of $280.2 million and EBITDA of $63.7 million, meaning the company fell short by $50.0 million in revenue and $3.6 million in EBITDA
— Revenue fell 20.1% year on year, a deceleration from -10.3% in the prior quarter, but the decline is largely due to the Harvest deconsolidation
— Gross margin rose to 64% from 59% a year earlier, and EBITDA margin to 26.1% from 24.9%, despite the revenue decline
— Net income of $0.8 million includes one-off items: a $1.7 million impairment loss over nine months and $9.2 million in transaction costs in the quarter
— Leverage is low: net debt of $46.0 million, or 0.19x trailing-twelve-month EBITDA, while operating cash flow for the quarter was $74.4 million
— On the portal's spot model, EBITDA at current cannabis prices is $290.9 million versus $244.3 million trailing twelve months, implying EV/EBITDA of 7.6x
Attractiveness
Key figures, USD bn
| Metric | Q3 2025 | Q3 2026 | Change |
|---|---|---|---|
| Revenue | 0.29 | 0.23 | -20.1% |
| EBITDA | 0.07 | 0.06 | -16.0% |
| Operating profit | 0.04 | 0.04 | +0.6% |
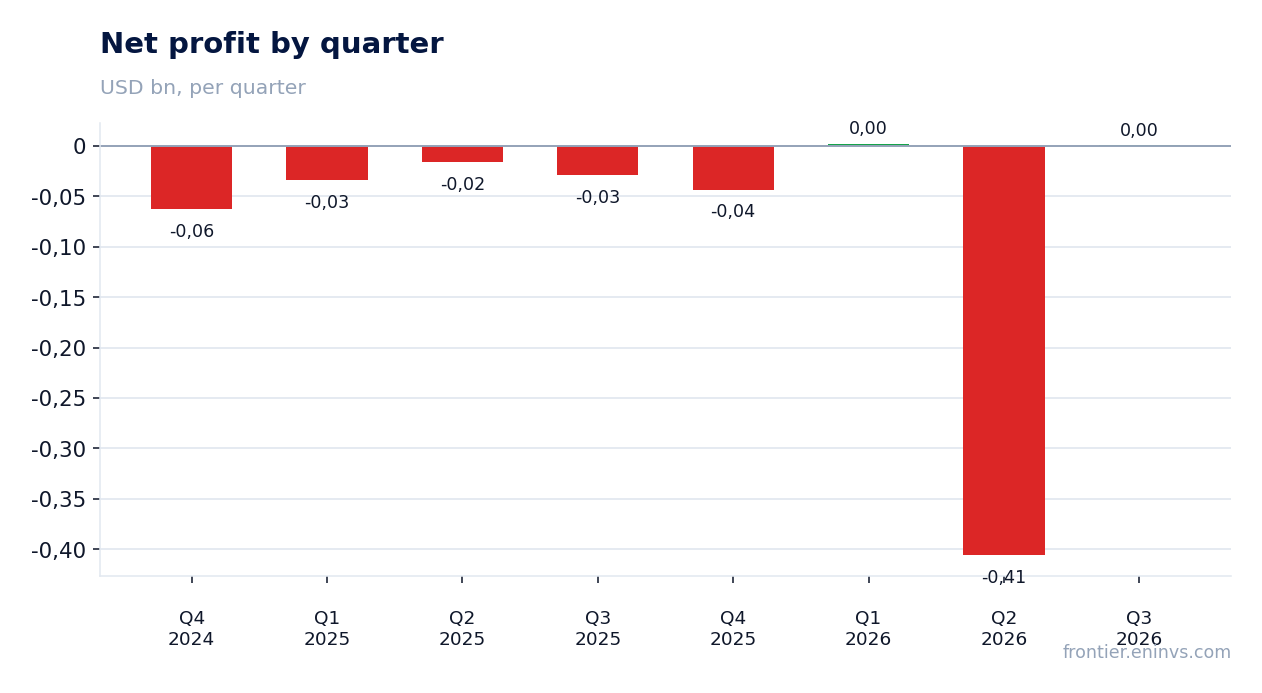
| Net profit | -0.03 | 0.00 | to profit |
| Operating cash flow | 0.08 | 0.07 | -3.1% |
| Capex | 0.01 | 0.03 | +135.4% |
| EBITDA margin | 24.9% | 26.1% | +1.2 pp |
| Net margin | -10.0% | 0.3% | +10.3 pp |
The average cannabis price in the quarter was $1,064 – 2.8% below a year earlier but 2.3% above the previous quarter
The average cannabis price in the third quarter of 2026 was $1,064, 2.8% below the year-ago level ($1,094) and 2.3% above the previous quarter ($1,040). The spot price now stands at $1,132, 6.4% above the reported-period average.
Thus, the price backdrop was moderately negative year on year but improved sequentially. For a cannabis producer, this means revenue and EBITDA should have declined only slightly at unchanged volumes and costs.
Commodity prices: period average and now
| Benchmark | Year ago | Q3 2026 | YoY | Spot 2026-11-06 |
|---|---|---|---|---|
| Cannabis Spot Index, USD | 1 094 | 1 064 | -2,8% | 1 132 |
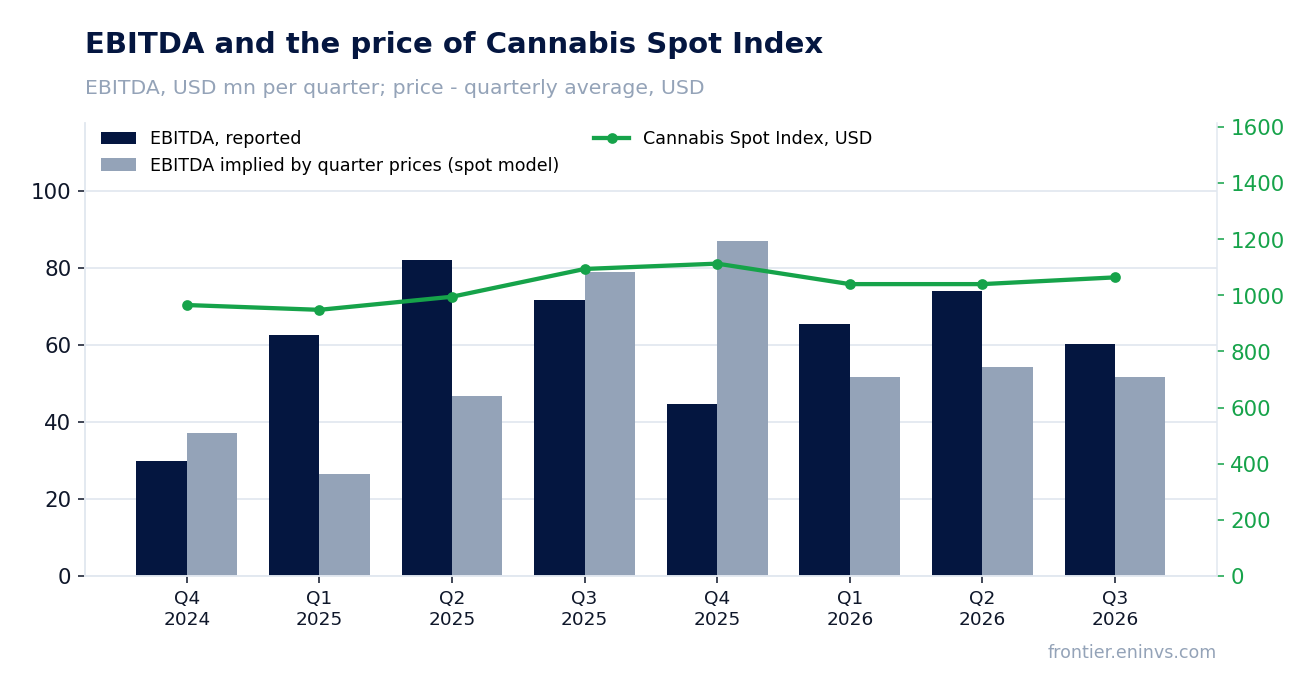
At year-ago volumes and costs, our calculation implies revenue of $280.2 million and EBITDA of $63.7 million, meaning the company fell short by $50.0 million in revenue and $3.6 million in EBITDA
If the company had maintained the volumes and costs of the third quarter of 2025 and only cannabis prices had changed, revenue would have been $280.2 million and EBITDA $63.7 million. In fact, revenue was $230.2 million, $50.0 million (17.9%) below the calculated level, and EBITDA was $60.2 million, $3.6 million (5.6%) below.
The gap is mainly explained by the Harvest deconsolidation: in the reported period, results include only Trulieve's medical operations, whereas a year earlier Harvest's operations were also consolidated. This reduced revenue but had a smaller impact on EBITDA, as Harvest likely had lower margins.
Compared with the previous quarter (Q2 2026), the calculation at that period's prices gives revenue of $277.3 million and EBITDA of $80.3 million. Actual figures are $47.1 million (17.0%) and $20.1 million (25.0%) lower, respectively, also due to the Harvest deconsolidation and lower volumes.
What the prices implied and what the company earned
| Base (Q3 2025) | Implied at period prices | Reported | Reported vs implied | |
|---|---|---|---|---|
| Revenue, USD mn | 288,2 | 280,2 | 230,2 | -17,9% |
| EBITDA, USD mn | 71,7 | 63,7 | 60,2 | -5,6% |
| EBITDA, portal spot model, USD mn | — | 51,7 | 60,2 | +16,5% |
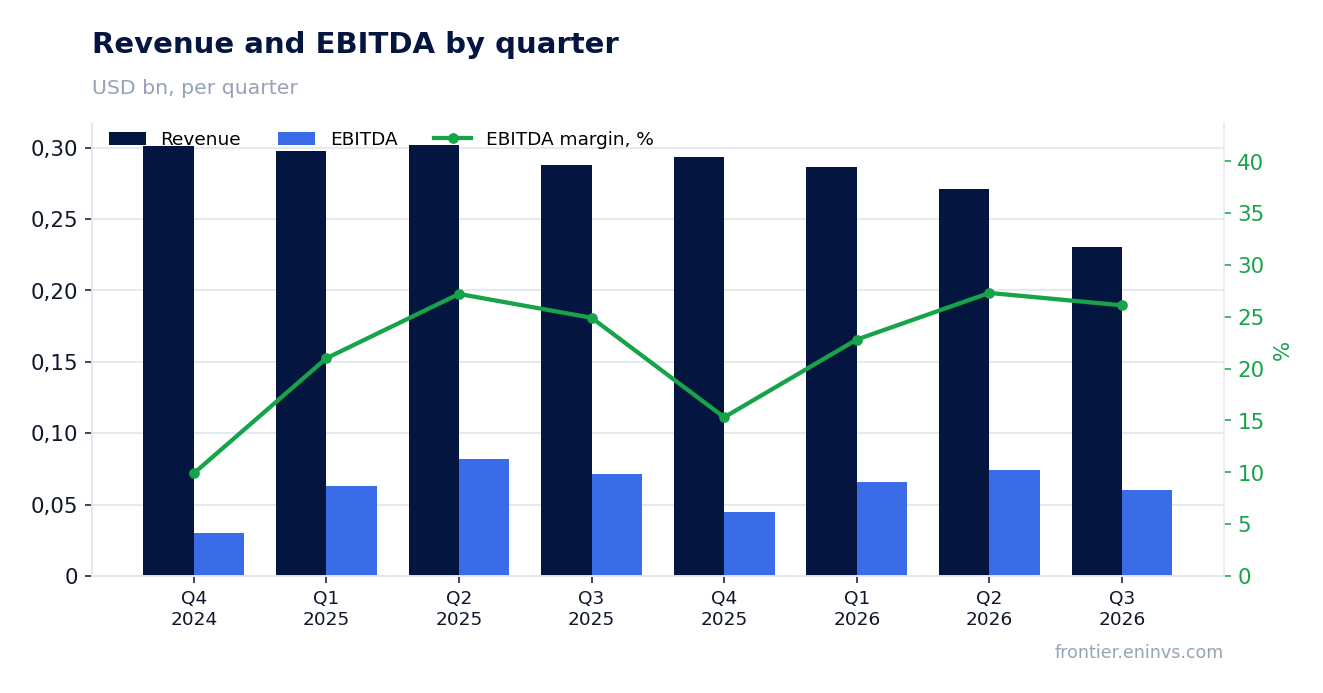
Revenue fell 20.1% year on year, a deceleration from -10.3% in the prior quarter, but the decline is largely due to the Harvest deconsolidation
Revenue in the third quarter of 2026 was $230.2 million, down 20.1% from $288.2 million a year earlier. The rate of decline accelerated: the previous quarter saw a 10.3% drop. However, the main reason is the Harvest deconsolidation, which occurred on June 3, 2026, and led to the exclusion of its revenue from consolidated results.
Excluding Harvest, Trulieve's revenue likely declined less but still fell. At year-ago prices and volumes, our calculation implies revenue of $280.2 million, pointing to lower volumes or a change in sales mix.
The company notes a seven-fold increase in traffic in Georgia following the medical program expansion on July 1, but this has not yet offset declines in other regions. Texas also offers growth potential, but it is not yet realised.
Gross margin rose to 64% from 59% a year earlier, and EBITDA margin to 26.1% from 24.9%, despite the revenue decline
Gross profit was $148.0 million on revenue of $230.2 million, a margin of 64% versus 59% a year earlier. The margin increase is explained by a reduction in cost of goods sold to $82.2 million from $118.3 million, likely due to the exclusion of lower-margin Harvest operations and cost optimisation.
EBITDA margin in the reported period was 26.1% versus 24.9% a year earlier. Operating profit reached $42.5 million and depreciation was $17.7 million, giving EBITDA of $60.2 million. Lower depreciation is also linked to the Harvest deconsolidation.
Adjusted EBITDA, according to the company, was $89.2 million, or 39% of revenue, up from 36% a year earlier. The difference between adjusted and reported EBITDA includes one-off items such as transaction costs and share-based compensation.
Net income of $0.8 million includes one-off items: a $1.7 million impairment loss over nine months and $9.2 million in transaction costs in the quarter
Net income attributable to shareholders was $0.8 million versus a loss of $26.8 million a year earlier. However, it includes one-off items: a $1.7 million loss on impairment and disposal of assets over nine months (zero in the quarter), $9.2 million in acquisition and transaction costs in the quarter, and a $6.4 million share of Harvest's net loss in the quarter.
In addition, the nine months of 2026 include a $403.3 million loss on the deconsolidation transaction, which is excluded from EBITDA but significantly affected the nine-month net loss ($403.0 million). There was no such loss in the third quarter.
The company's adjusted net income was $18.0 million, or $0.09 per share, versus an adjusted loss of $12.5 million a year earlier. This indicates improved operating efficiency despite the revenue decline.
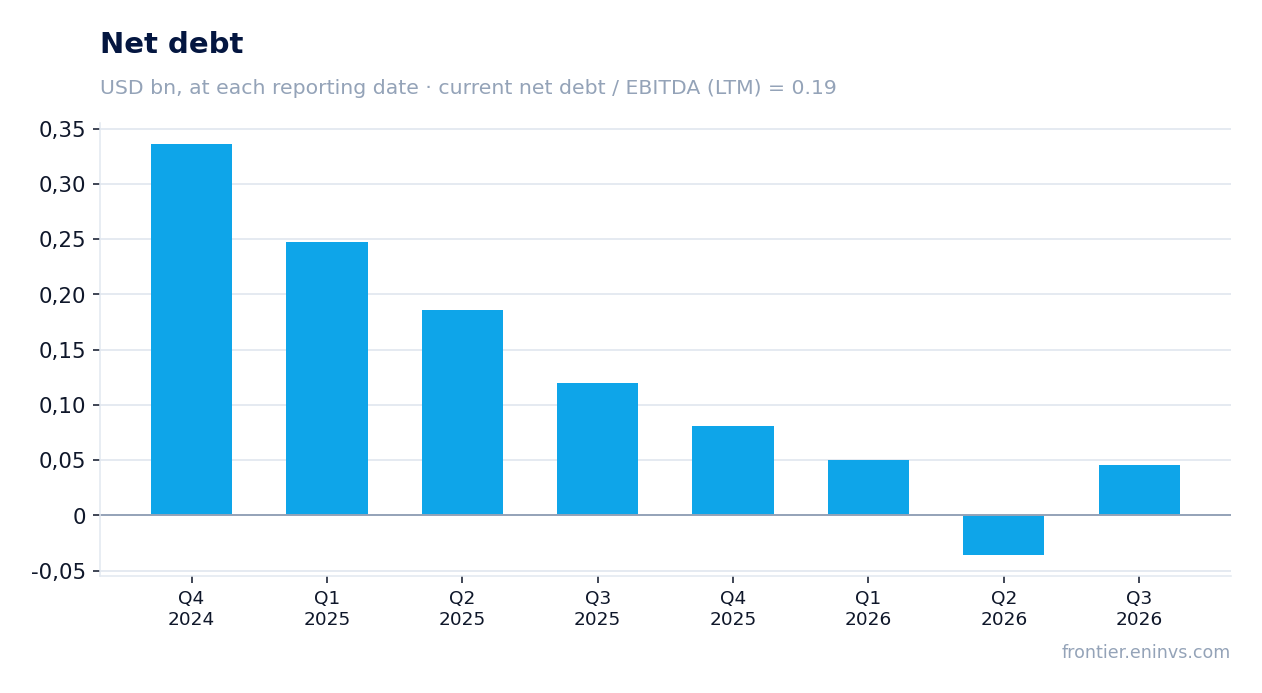
Leverage is low: net debt of $46.0 million, or 0.19x trailing-twelve-month EBITDA, while operating cash flow for the quarter was $74.4 million
Net debt as of September 30, 2026, was $46.0 million. Over the trailing twelve months, EBITDA was $248.2 million, giving a net debt/EBITDA ratio of 0.19. This is a low leverage level that poses no threat to financial stability.
Operating cash flow in the third quarter was $74.4 million, and capital expenditures were $29.0 million, resulting in free cash flow of $45.4 million. For the nine months, operating cash flow was $183.3 million and free cash flow $119.8 million.
The company repaid $65 million of mortgage notes due in 2028 ahead of schedule, reducing interest expense. Interest expense for the quarter was $12.0 million, and interest income was $2.8 million. Cash at quarter-end was $326.7 million.
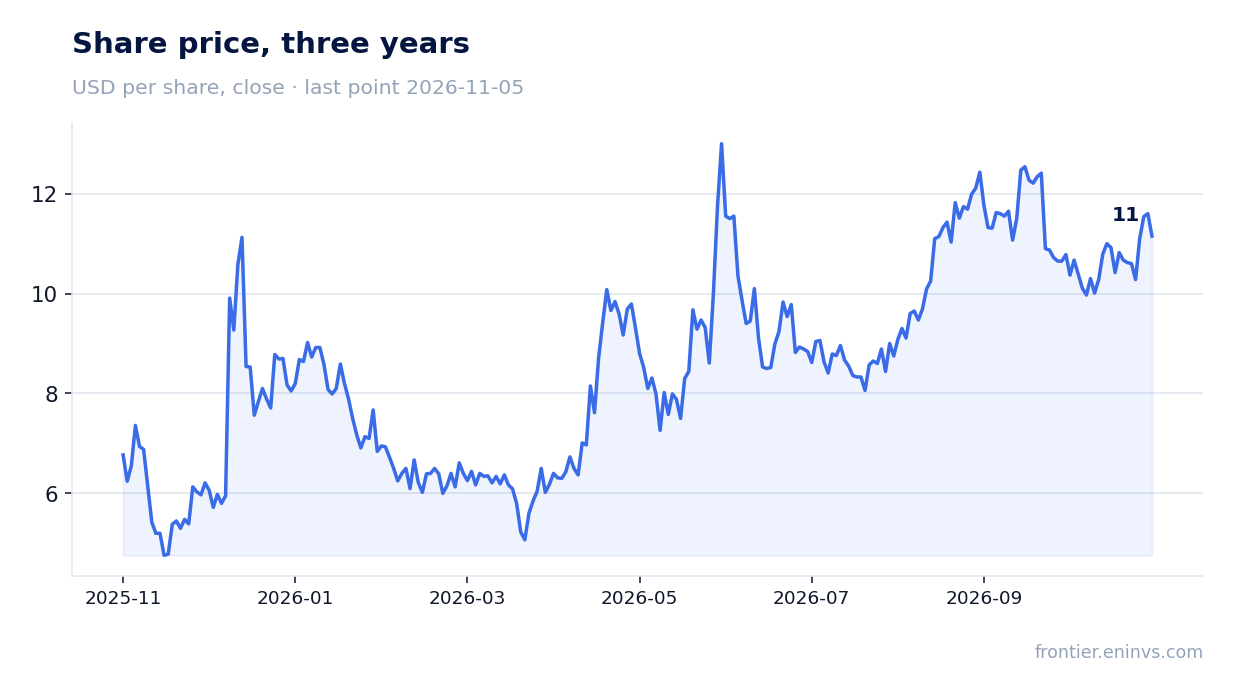
On the portal's spot model, EBITDA at current cannabis prices is $290.9 million versus $244.3 million trailing twelve months, implying EV/EBITDA of 7.6x
On the portal's spot model, at current cannabis prices annual EBITDA is estimated at $290.9 million versus $244.3 million trailing twelve months. This means current prices are above the average of the past year, and the company's earnings power is higher than historical results show.
At current prices, EV/EBITDA is 7.6x and net debt/EBITDA is 0.16. For comparison, based on LTM EBITDA the EV/EBITDA multiple is 9.0x. Market capitalisation is $2,152.9 million.
On the portal's model, the fair value of the share, re-pricing EBITDA at current commodity prices and the target EV/EBITDA, implies a -8% upside to the current price. This is our own estimate, not a consensus forecast.
Valuation on the latest reported figures
| Metric | Value |
|---|---|
| Market cap | 2.15 bn USD |
| EV/EBITDA (LTM) | 9.0 |
| P/B | 1.88 |
| Net debt / EBITDA (LTM) | 0.19 |
| Operating cash flow (LTM) | 0.24 bn |
| ROE | 0.4% |
Bottom line
The key takeaway is that the company maintained high margins and low leverage despite the revenue decline from the Harvest deconsolidation. However, organic growth is still weak: even excluding Harvest, revenue lags the price-implied level. The low EV/EBITDA multiple (9.0x on LTM and 7.6x at current prices) and the -8% upside on the portal's model suggest the share is fairly valued, with no clear bias either way. A sustained recovery in volumes and prices is needed to improve the verdict.
Open the company's financial profile TCNNF →
See also: market overview · valuation map · stock screeners