Teck Resources: profit up 5.7x, but almost all of it is a paper revaluation gain
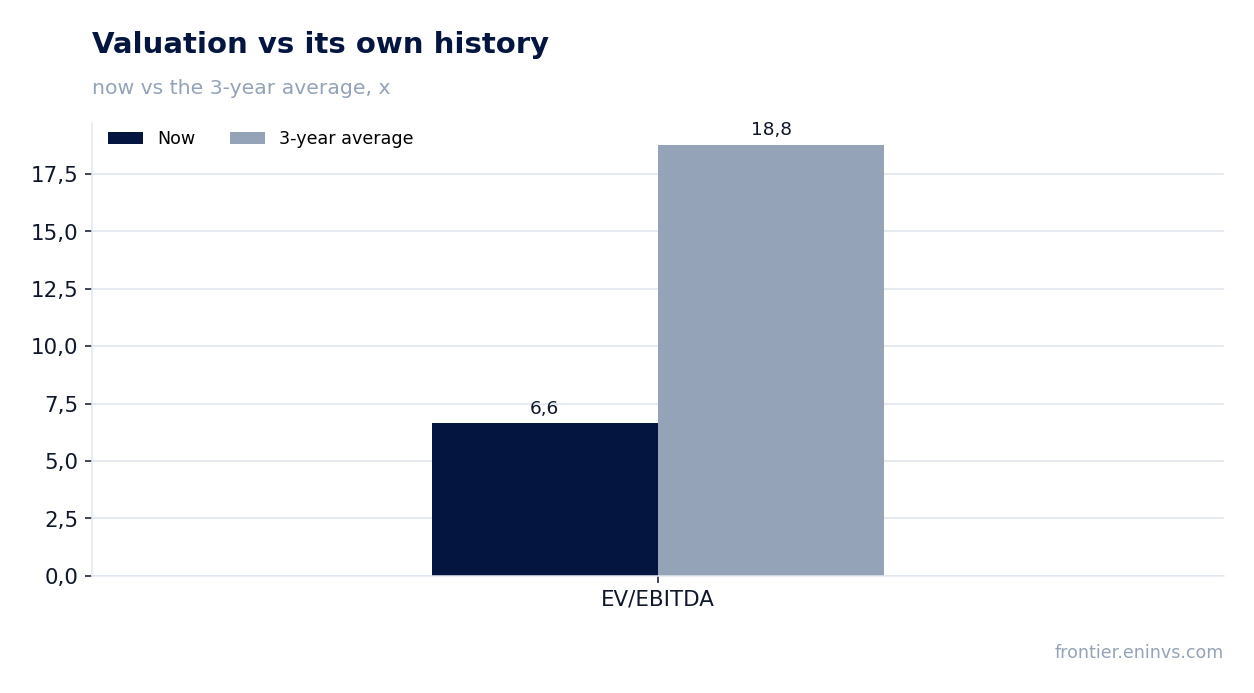
Teck Resources' Q3 2026 results showed revenue of USD 3,260.8 mn (+34.6% YoY), EBITDA of USD 2,162.8 mn (+181.9%) and net profit of USD 1,149.3 mn (+471.5%). The EBITDA margin rose to 66.3% from 31.7% a year earlier, and the net margin to 35.2% from 8.3%. Profit grew several times faster than revenue, pointing to large one-off items in the income statement rather than organic improvement. At an EV/EBITDA of 6.6 versus its own three-year average of 18.8 the share looks cheaper than its history, and the portal model puts upside to fair value at +4%. The verdict is neutral: the cheap valuation and low leverage are offset by the one-off nature of the profit and by decelerating revenue growth.
Key takeaways
— Revenue grew 34.6%, but the pace decelerated from 81.4% a quarter earlier
— The EBITDA margin jumped to 66.3% – a level that does not occur without one-off items
— Net profit of USD 1,149.3 mn came on operating profit of USD 1,184.6 mn – the gap is almost nil
— Leverage is low: net debt of USD 1.5 bn against LTM EBITDA of USD 4.6 bn
— Free cash flow covers the dividend, but the yield is only 0.43%
— The share trades at 6.6x EV/EBITDA versus its own three-year average of 18.8x
Attractiveness
Key figures, USD bn
| Metric | Q3 2025 | Q3 2026 | Change |
|---|---|---|---|
| Revenue | 2.42 | 3.26 | +34.6% |
| EBITDA | 0.77 | 2.16 | +181.9% |
| Operating profit | 0.37 | 1.18 | +222.0% |
| Net profit | 0.20 | 1.15 | +471.5% |
| Operating cash flow | 0.46 | 1.15 | +147.9% |
| EBITDA margin | 31.7% | 66.3% | +34.6 pp |
| Net margin | 8.3% | 35.2% | +26.9 pp |
Revenue grew 34.6%, but the pace decelerated from 81.4% a quarter earlier
In Q3 2026 Teck Resources' revenue reached USD 3,260.8 mn, up 34.6% year on year. That is a strong result, but it is markedly slower than the 81.4% growth in Q2. The deceleration followed two consecutive quarters above 80% – growth was 80.0% in Q1 2026.
The quarterly sequence of growth rates runs: 16.1% in Q3 2025, 80.0% in Q1 2026, 81.4% in Q2 and 34.6% in Q3. This pattern suggests the main low-base effect has run its course. Further growth will depend on commodity prices and shipment volumes rather than on recovery from a weak period.
For an investor this means that even if commodity prices hold at current levels, the company is unlikely to show the same revenue growth rate next quarter. The deceleration is not a sign of business deterioration but a consequence of the comparison base no longer being abnormally low.
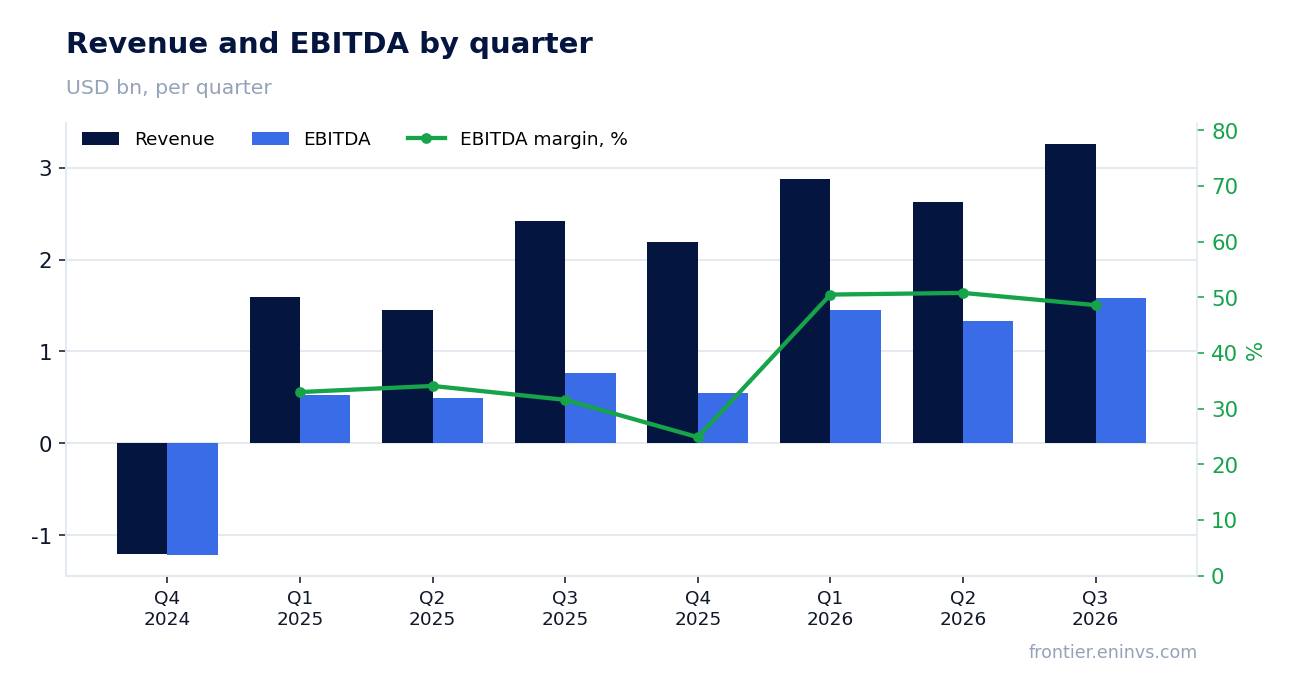
The EBITDA margin jumped to 66.3% – a level that does not occur without one-off items
Q3 2026 EBITDA was USD 2,162.8 mn on revenue of USD 3,260.8 mn, a margin of 66.3%. A year earlier the margin was 31.7% – more than double. Operating profit was USD 1,184.6 mn, giving an operating margin of about 36.3%.
The gap between EBITDA and operating profit of USD 978.2 mn is depreciation and impairment. Such a gap is typical for a mining company with heavy assets, but it does not by itself explain the margin jump. The reason is that revenue grew 34.6% while EBITDA grew 181.9%. This means either costs fell sharply or items unrelated to operations landed in EBITDA.
A 66.3% margin for a commodity company is an abnormally high level. Even in favourable cycles mining companies rarely show such profitability at the EBITDA level. This is the main argument that the quarterly result contains a one-off component that will not repeat next period.
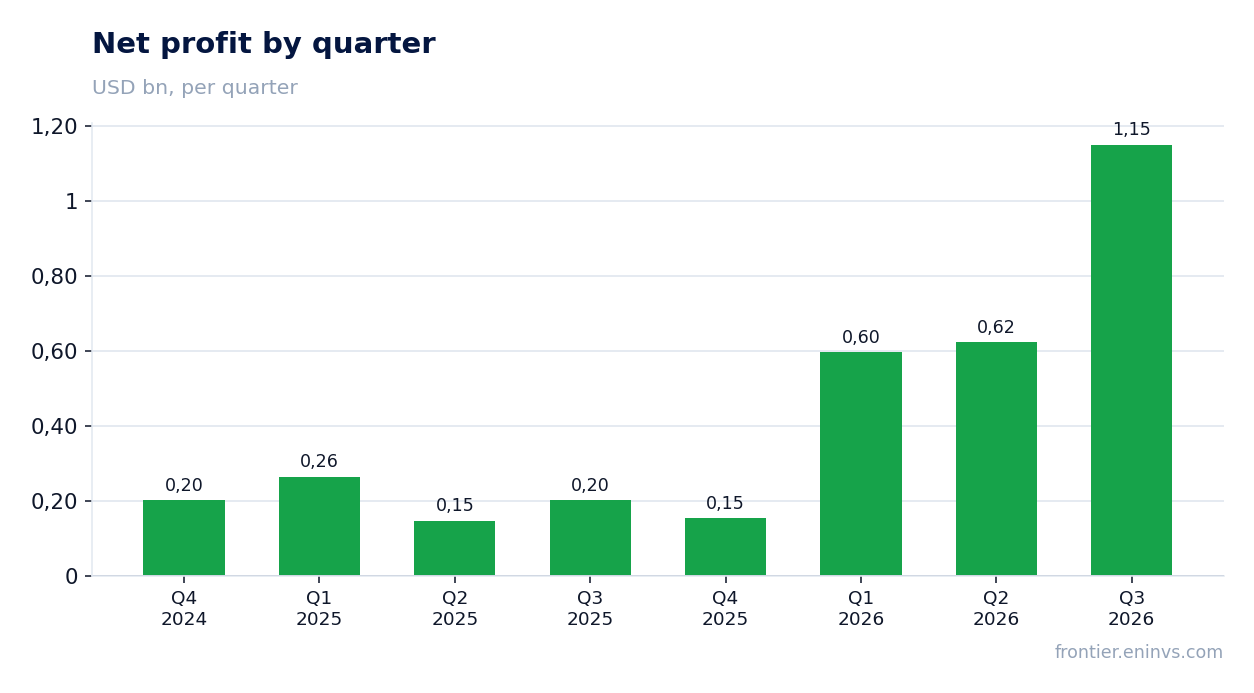
Net profit of USD 1,149.3 mn came on operating profit of USD 1,184.6 mn – the gap is almost nil
Q3 2026 net profit was USD 1,149.3 mn versus USD 201.1 mn a year earlier – growth of 471.5%. Operating profit was USD 1,184.6 mn. The gap between operating and net profit is only USD 35.3 mn, which for a company with USD 1.5 bn of net debt implies near-zero net financial costs and a low tax burden in the reporting period.
Such a profit structure is unusual. Normally a mining company with debt sees financial costs and taxes take a noticeable share of operating profit. Here net profit is almost equal to operating profit, which may reflect tax deductions, FX differences or one-off gains below the operating line.
For assessing profit sustainability it matters that the net margin of 35.2% versus 8.3% a year earlier rose more than fourfold. If the one-off items that drove this growth do not repeat, next quarter's profit will be markedly lower even if revenue holds at the current level.
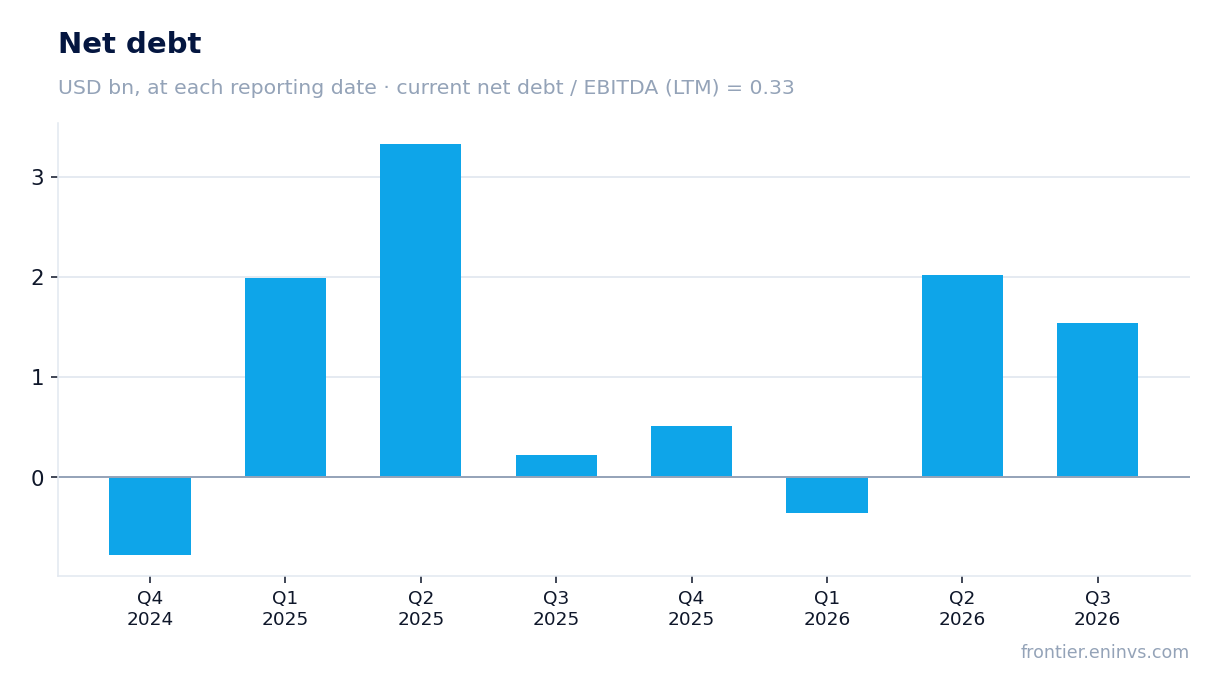
Leverage is low: net debt of USD 1.5 bn against LTM EBITDA of USD 4.6 bn
Net debt at 30 September 2026 was USD 1,538.4 mn. The ratio of net debt to LTM EBITDA is 0.33. That is a low level for a mining company: LTM EBITDA was USD 4,642.2 mn, three times net debt.
Debt dynamics: net debt was USD 2.0 bn at 30 June 2026 and USD 1.5 bn at 30 September, a decrease of USD 0.5 bn over the quarter. Over twelve months net debt rose from USD 0.2 bn at 30 September 2025 to USD 1.5 bn at 30 September 2026, an increase of USD 1.3 bn. The annual increase does not create a problem at current EBITDA but shows the company financed part of its spending with borrowed funds.
Operating cash flow in Q3 2026 was USD 1,147.8 mn, and USD 4,046.0 mn over twelve months. Such a flow comfortably covers interest costs and supports low leverage. At a ratio of 0.33 even a significant fall in EBITDA would not push the company beyond a comfortable debt level.
Free cash flow covers the dividend, but the yield is only 0.43%
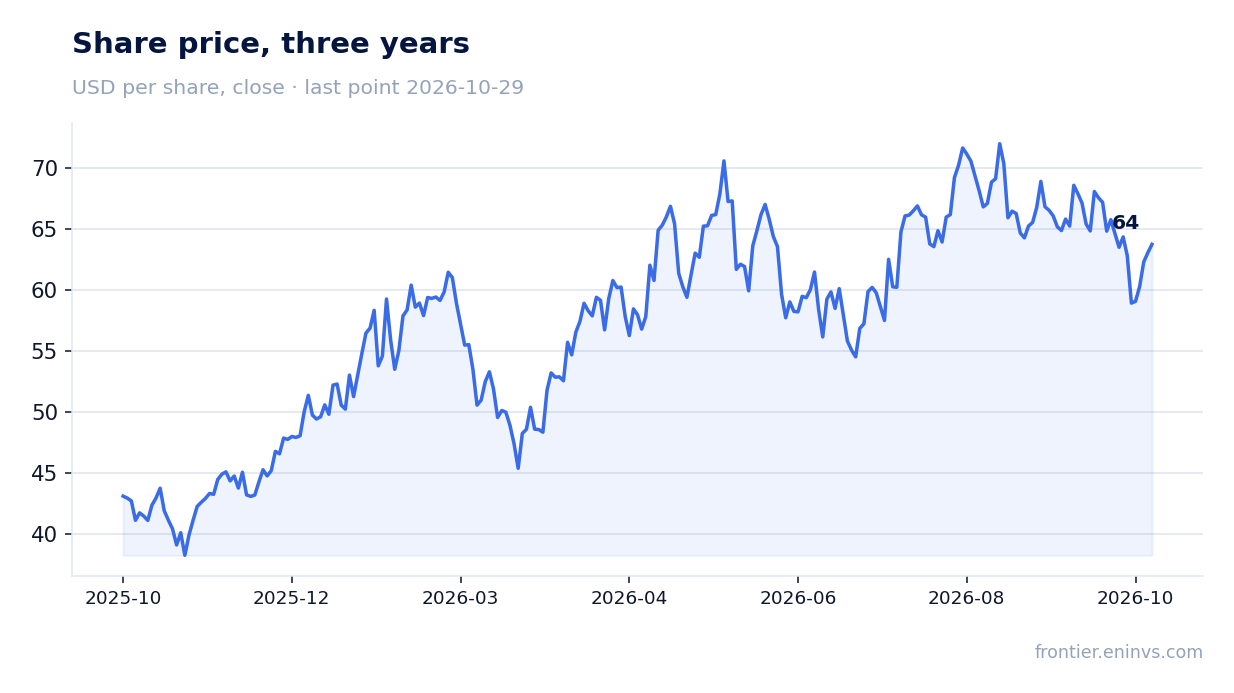
Teck Resources' trailing twelve-month dividend yield is 0.43%. That is a low level for a mining company, explained by the high valuation of equity: market capitalisation of USD 31.1 bn against LTM net profit of USD 2,757.2 mn. The company pays dividends, but they are not the main element of return for an investor.
LTM operating cash flow of USD 4,046.0 mn against net profit of USD 2,757.2 mn means cash flow exceeds profit. That is a good sign: the company generates real money, not just paper profit. However, capital expenditure is not disclosed in the facts, so free cash flow after investment cannot be assessed.
Our estimate of the current-year dividend is based on the 0.43% yield on the current price and LTM profit of USD 2,757.2 mn. On such a profit base and current payout the dividend looks sustainable, but its growth depends on whether profit holds above USD 2.7 bn. If the one-off items of Q3 do not repeat, next year's profit may be lower and the dividend will grow more slowly.
The share trades at 6.6x EV/EBITDA versus its own three-year average of 18.8x
The LTM EV/EBITDA multiple is 6.6x versus its own three-year average of 18.8x. The share trades 65% below its historical valuation on this multiple. That is a strong argument that the market has already priced in the risk of one-off profit and decelerating growth.
The LTM P/E is 11.3x. With profit of USD 2,757.2 mn and market capitalisation of USD 31.1 bn, that is a moderate valuation for a commodity company. A return on equity of 22.3% confirms the business remains profitable even adjusted for one-off items.
On the portal's model, which reprices EBITDA at current commodity prices at the target EV/EBITDA, the upside to fair value is +4%. That is a small gap and shows the current price is close to the model's valuation. The key question is whether EBITDA holds at the level built into the model or whether the one-off items of Q3 distorted the base.
Valuation on the latest reported figures
| Metric | Value |
|---|---|
| Market cap | 31.1 bn USD |
| P/E (LTM) | 11.3 |
| EV/EBITDA (LTM) | 6.6 |
| P/B | 1.73 |
| Net debt / EBITDA (LTM) | 0.33 |
| Operating cash flow (LTM) | 4.05 bn |
| ROE | 22.3% |
| Dividend yield (12m) | 0.4% |
| EV/EBITDA, 3-year average | 18.8 |
Bottom line
The strong side of the report is low leverage of 0.33 and quarterly operating cash flow of USD 1,147.8 mn, which confirm the resilience of the business. The weak side is the one-off nature of profit: the 66.3% EBITDA margin and net profit of USD 1,149.3 mn against operating profit of USD 1,184.6 mn point to items unlikely to repeat. The EV/EBITDA of 6.6x versus the three-year average of 18.8x makes the share cheap relative to its own history, but the portal model gives only +4% upside. The verdict is neutral: the cheap valuation and low debt are offset by one-off profit and decelerating revenue growth. A change in the verdict would require seeing EBITDA hold above USD 1.5 bn next quarter without one-off items.
Open the company's financial profile TECK →
See also: market overview · valuation map · stock screeners