Taseko Mines: copper up a third, but volumes and costs mattered more than price
Contents

On 11 November Taseko Mines reported third-quarter 2026 results. The average copper price in the period was USD 14,408 versus USD 10,825 a year earlier (+33.1%), and spot is now USD 13,997 (–2.9% against the quarterly average). Revenue reached USD 247.0m (+98.5% year on year) and EBITDA USD 99.1m (+146.5%), but at the year-ago volumes and costs the price alone implied EBITDA of USD 79.8m, so the company earned USD 19.4m more than the price effect. Our conclusion: rather attractive – the portal model puts the upside at +21% to fair value. Our view: the share is rather attractive at the current price; upside on the portal model +21%.
Our view: is there upside
Our view in numbers
| Metric | Our read |
|---|---|
| Verdict | Rather attractive |
| Upside on the portal model | +21% |
| How the model works | spot model: EBITDA re-priced to current commodity prices at the target EV/EBITDA, against market cap |
| Net debt / EBITDA | 1.13 – low leverage |
| Strongest case for | On the portal model the share trades 21% below fair value, and at current copper prices EBITDA is USD 369.3m with net debt at 1.0x EBITDA. |
| Strongest case against | Spot copper at USD 13,997 is already 2.9% below the reported quarter's average, and net profit of USD 24.3m on EBITDA of USD 99.1m leaves little cushion if the price falls. |
| What would change the view | If the average copper price next quarter holds above USD 14,408, the spot model would lift EBITDA above USD 369.3m and the verdict would move one step up; a fall below USD 14,000 would move it down. |
Key takeaways
— Copper averaged USD 14,408 in the quarter versus USD 10,825 a year earlier – the price alone explains only part of the growth
— At the year-ago volumes and costs the price implied EBITDA of USD 79.8m; reported USD 99.1m is USD 19.4m higher, and volumes and costs close the gap
— Revenue of USD 247.0m grew +98.5% year on year but decelerated from +189.8% a quarter earlier
— EBITDA margin of 40.1% versus 32.3% a year earlier – the margin gain did not come from price alone
— Net debt of USD 370.5m is 1.13x trailing-twelve-month EBITDA – leverage is moderate
— The portal spot model gives EBITDA of USD 369.3m at current prices against USD 329.3m over the last twelve months
— On the portal model the share trades 21% below fair value, and that upside is the main argument for the stock
Key figures, USD bn
| Metric | Q3 2025 | Q3 2026 | Change |
|---|---|---|---|
| Revenue | 0.12 | 0.25 | +98.5% |
| EBITDA | 0.04 | 0.10 | +146.5% |
| Operating profit | 0.02 | 0.08 | +289.7% |
| Net profit | -0.02 | 0.02 | to profit |
| Operating cash flow | 0.03 | 0.09 | +237.7% |
| Capex | 0.02 | — | — |
| EBITDA margin | 32.3% | 40.1% | +7.8 pp |
| Net margin | -16.0% | 9.8% | +25.8 pp |
Copper averaged USD 14,408 in the quarter versus USD 10,825 a year earlier – the price alone explains only part of the growth
The average copper price in the third quarter of 2026 was USD 14,408 versus USD 10,825 a year earlier, up 33.1%. Against the previous quarter the price added 5.3%, from USD 13,682. Spot on 11 November is USD 13,997, 2.9% below the reported-period average.
For a copper producer this is the main external backdrop: revenue and EBITDA are first of all a function of price, volume and unit costs. The price rose by a third, but it alone does not explain the doubling of revenue – volumes and costs close the gap, as discussed below.
Commodity prices: period average and now
| Benchmark | Year ago | Q3 2026 | YoY | Spot 2026-11-11 |
|---|---|---|---|---|
| Copper, USD | 10 825 | 14 408 | +33,1% | 13 997 |
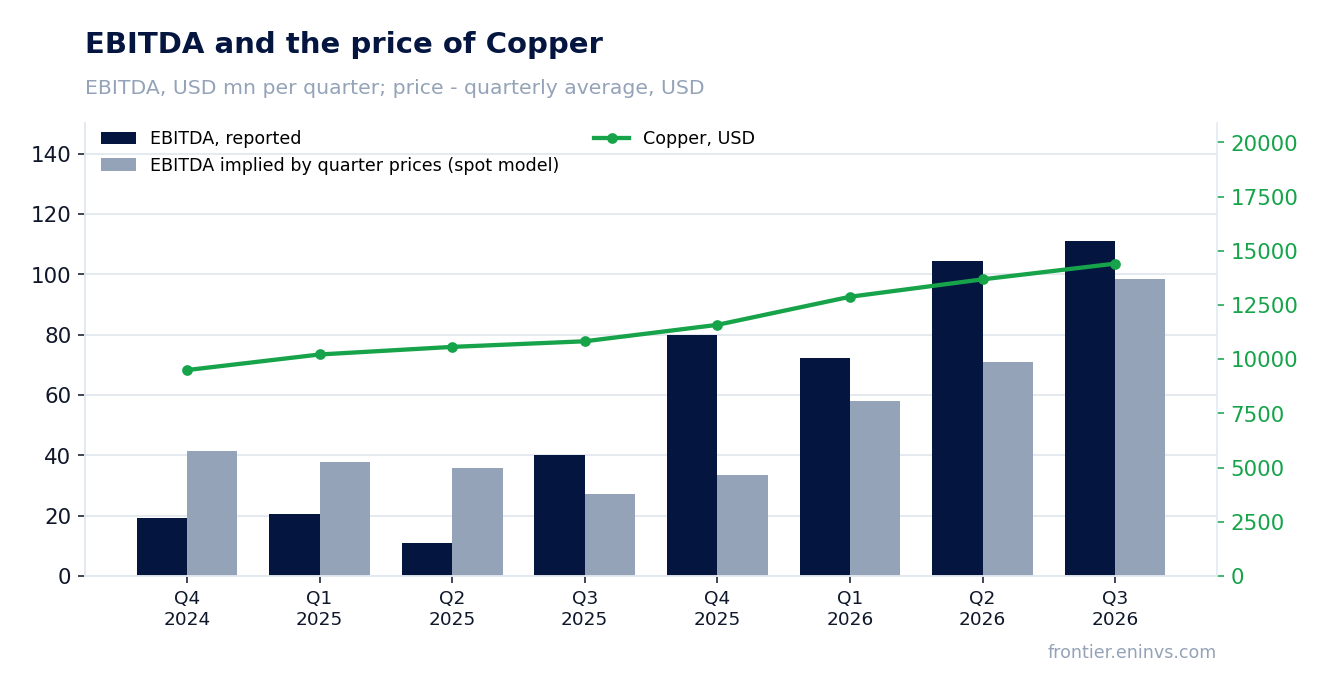
At the year-ago volumes and costs the price implied EBITDA of USD 79.8m; reported USD 99.1m is USD 19.4m higher, and volumes and costs close the gap
At the year-ago volumes and non-commodity costs, with only this period's prices applied, revenue would have been USD 164m (a price effect of +USD 39.5m, or +31.8%) and EBITDA USD 79.8m, by our calculation. Reported revenue of USD 247.0m and EBITDA of USD 99.1m are USD 83.1m and USD 19.4m higher respectively.
So price explains roughly 40% of the EBITDA increase, and the rest comes from volumes and unit costs. The USD 19.4m gap is what the company earned beyond the price effect; in the report it sits in production and cost of sales, not in one-off items.
The portal spot model, built from the average of the previous four quarters, expected EBITDA of USD 98.3m and revenue of USD 208.6m. Actual USD 99.1m and USD 247.0m are 0.8% and 18.5% above the model. That confirms the quarter was strong not only on price but also on sales volume.
What the prices implied and what the company earned
| Base (Q3 2025) | Implied at period prices | Reported | Reported vs implied | |
|---|---|---|---|---|
| Revenue, USD mn | 124,5 | 164,0 | 247,0 | +50,6% |
| EBITDA, USD mn | 40,2 | 79,8 | 99,1 | +24,3% |
| EBITDA, portal spot model, USD mn | — | 98,3 | 99,1 | +0,8% |
Revenue and EBITDA by quarter
| Period | Measure | bn USD |
|---|---|---|
| Q4 2024 | Revenue | 0.119927 |
| Q1 2025 | Revenue | 0.099581 |
| Q2 2025 | Revenue | 0.083073 |
| Q3 2025 | Revenue | 0.124455 |
| Q4 2025 | Revenue | 0.17445 |
| Q1 2026 | Revenue | 0.172694 |
| Q2 2026 | Revenue | 0.240769 |
| Q3 2026 | Revenue | 0.247048 |
| Q4 2024 | EBITDA | 0.019179 |
| Q1 2025 | EBITDA | 0.020446 |
| Q2 2025 | EBITDA | 0.010780999999999999 |
| Q3 2025 | EBITDA | 0.040223999999999996 |
| Q4 2025 | EBITDA | 0.079759 |
| Q1 2026 | EBITDA | 0.07211 |
| Q2 2026 | EBITDA | 0.104577 |
| Q3 2026 | EBITDA | 0.111231 |
EBITDA margin
| Period | Measure | % |
|---|---|---|
| Q4 2024 | EBITDA margin | 16.0 |
| Q1 2025 | EBITDA margin | 20.5 |
| Q2 2025 | EBITDA margin | 13.0 |
| Q3 2025 | EBITDA margin | 32.3 |
| Q4 2025 | EBITDA margin | 45.7 |
| Q1 2026 | EBITDA margin | 41.8 |
| Q2 2026 | EBITDA margin | 43.4 |
| Q3 2026 | EBITDA margin | 45.0 |
Revenue of USD 247.0m grew +98.5% year on year but decelerated from +189.8% a quarter earlier
Third-quarter 2026 revenue was USD 247.0m, up 98.5% year on year. A quarter earlier, in the second quarter of 2026, growth was +189.8%, so the pace decelerated. Sequentially, revenue rose 2.6% from USD 240.8m in the second quarter.
The slowdown in the annual rate is explained by the high base: second-quarter 2025 revenue was only USD 83.1m, while the third quarter was already USD 124.5m. The absolute level of revenue remains the highest in recent quarters.
At the previous quarter's volumes and costs with this period's prices, revenue would have been USD 253m, by our calculation. Actual USD 247.0m is USD 6.0m lower, meaning sales volume or the realised price was slightly below the previous quarter.
EBITDA margin of 40.1% versus 32.3% a year earlier – the margin gain did not come from price alone
The EBITDA margin in the third quarter of 2026 was 40.1% versus 32.3% a year earlier. A gain of 7.8 percentage points with copper up 33.1% means unit costs did not eat the price effect and volumes rose.
Operating profit of USD 78.7m on revenue of USD 247.0m gives an operating margin of 31.9%. Net profit was USD 24.3m, a margin of 9.8% versus a negative –16.0% a year earlier, when the quarter was loss-making.
The difference between EBITDA and operating profit – USD 20.4m – is depreciation. Interest and taxes sit below operating profit and absorb part of EBITDA: net profit of USD 24.3m against EBITDA of USD 99.1m.
Net debt of USD 370.5m is 1.13x trailing-twelve-month EBITDA – leverage is moderate
Net debt at 30 September 2026 was USD 370.5m. With trailing-twelve-month EBITDA of USD 329.3m, net debt to EBITDA is 1.13x. That is a level, not a direction: the facts give no earlier value to compare with.
Operating cash flow in the quarter was USD 88.2m against capital expenditure of USD 22.9m, leaving free cash flow of about USD 65.3m. Over the last twelve months operating cash flow was USD 362.6m – comfortably covering both interest and capex.
At current copper prices the portal spot model gives EBITDA of USD 369.3m, which would bring net debt to EBITDA down to 1.0x. Leverage is not a constraint for the company at today's copper price.
The portal spot model gives EBITDA of USD 369.3m at current prices against USD 329.3m over the last twelve months
At current copper prices the portal spot model values annual EBITDA at USD 369.3m against USD 329.3m over the last twelve months, 8.2% higher. The difference is small because spot at USD 13,997 is only 2.9% below the reported quarter's average of USD 14,408.
On that base EV/EBITDA at current prices is 8.1 and net debt to EBITDA is 1.0x. For valuing the company this is a more reliable base than LTM: the last twelve months include quarters with lower copper prices.
Market capitalisation is USD 2,623.4m. On LTM EBITDA of USD 329.3m, EV/EBITDA is 8.14, P/E 46.9 and ROE 15.3%. The P/E is high because net profit is low relative to EBITDA – interest and taxes take a significant part of operating profit.
Share price, three years
close, last point 2026-11-10
| Period | Measure | USD per share |
|---|---|---|
| 2025-11-10 | Closing price | 4.610000133514404 |
| 2025-11-11 | Closing price | 4.599999904632568 |
| 2025-11-12 | Closing price | 4.789999961853027 |
| 2025-11-13 | Closing price | 4.21999979019165 |
| 2025-11-14 | Closing price | 4.340000152587891 |
| 2025-11-17 | Closing price | 4.46999979019165 |
| 2025-11-18 | Closing price | 4.340000152587891 |
| 2025-11-19 | Closing price | 4.46999979019165 |
| 2025-11-20 | Closing price | 4.300000190734863 |
| 2025-11-21 | Closing price | 4.25 |
| 2025-11-24 | Closing price | 4.420000076293945 |
| 2025-11-25 | Closing price | 4.550000190734863 |
| 2025-11-26 | Closing price | 5.039999961853027 |
| 2025-11-28 | Closing price | 5.28000020980835 |
| 2025-12-01 | Closing price | 5.199999809265137 |
| 2025-12-02 | Closing price | 5.119999885559082 |
| 2025-12-03 | Closing price | 5.25 |
| 2025-12-04 | Closing price | 5.349999904632568 |
| 2025-12-05 | Closing price | 5.300000190734863 |
| 2025-12-08 | Closing price | 5.210000038146973 |
| 2025-12-09 | Closing price | 5.230000019073486 |
| 2025-12-10 | Closing price | 5.230000019073486 |
| 2025-12-11 | Closing price | 5.440000057220459 |
| 2025-12-12 | Closing price | 5.429999828338623 |
| 2025-12-15 | Closing price | 5.409999847412109 |
| 2025-12-16 | Closing price | 5.199999809265137 |
| 2025-12-17 | Closing price | 5.179999828338623 |
| 2025-12-18 | Closing price | 5.139999866485596 |
| 2025-12-19 | Closing price | 5.5 |
| 2025-12-22 | Closing price | 5.53000020980835 |
| 2025-12-23 | Closing price | 5.579999923706055 |
| 2025-12-24 | Closing price | 5.639999866485596 |
| 2025-12-26 | Closing price | 5.809999942779541 |
| 2025-12-29 | Closing price | 5.630000114440918 |
| 2025-12-30 | Closing price | 5.650000095367432 |
| 2025-12-31 | Closing price | 5.659999847412109 |
| 2026-01-02 | Closing price | 5.599999904632568 |
| 2026-01-05 | Closing price | 6.010000228881836 |
| 2026-01-06 | Closing price | 6.199999809265137 |
| 2026-01-07 | Closing price | 6.070000171661377 |
| 2026-01-08 | Closing price | 5.929999828338623 |
| 2026-01-09 | Closing price | 5.929999828338623 |
| 2026-01-12 | Closing price | 6.269999980926514 |
| 2026-01-13 | Closing price | 6.519999980926514 |
| 2026-01-14 | Closing price | 7.289999961853027 |
| 2026-01-15 | Closing price | 7.150000095367432 |
| 2026-01-16 | Closing price | 7.050000190734863 |
| 2026-01-20 | Closing price | 7.150000095367432 |
| 2026-01-21 | Closing price | 7.059999942779541 |
| 2026-01-22 | Closing price | 7.199999809265137 |
| 2026-01-23 | Closing price | 7.630000114440918 |
| 2026-01-26 | Closing price | 7.849999904632568 |
| 2026-01-27 | Closing price | 8.220000267028809 |
| 2026-01-28 | Closing price | 8.25 |
| 2026-01-29 | Closing price | 8.600000381469727 |
| 2026-01-30 | Closing price | 7.619999885559082 |
| 2026-02-02 | Closing price | 7.710000038146973 |
| 2026-02-03 | Closing price | 8.829999923706055 |
| 2026-02-04 | Closing price | 8.369999885559082 |
| 2026-02-05 | Closing price | 7.599999904632568 |
| 2026-02-06 | Closing price | 7.849999904632568 |
| 2026-02-09 | Closing price | 8.239999771118164 |
| 2026-02-10 | Closing price | 8.199999809265137 |
| 2026-02-11 | Closing price | 8.350000381469727 |
| 2026-02-12 | Closing price | 7.849999904632568 |
| 2026-02-13 | Closing price | 8.289999961853027 |
| 2026-02-17 | Closing price | 7.96999979019165 |
| 2026-02-18 | Closing price | 8.020000457763672 |
| 2026-02-19 | Closing price | 7.670000076293945 |
| 2026-02-20 | Closing price | 7.949999809265137 |
| 2026-02-23 | Closing price | 7.900000095367432 |
| 2026-02-24 | Closing price | 8.399999618530273 |
| 2026-02-25 | Closing price | 8.279999732971191 |
| 2026-02-26 | Closing price | 8.5 |
| 2026-02-27 | Closing price | 8.880000114440918 |
| 2026-03-02 | Closing price | 8.760000228881836 |
| 2026-03-03 | Closing price | 8.029999732971191 |
| 2026-03-04 | Closing price | 8.180000305175781 |
| 2026-03-05 | Closing price | 7.489999771118164 |
| 2026-03-06 | Closing price | 7.199999809265137 |
| 2026-03-09 | Closing price | 7.190000057220459 |
| 2026-03-10 | Closing price | 7.380000114440918 |
| 2026-03-11 | Closing price | 7.349999904632568 |
| 2026-03-12 | Closing price | 7.010000228881836 |
| 2026-03-13 | Closing price | 6.599999904632568 |
| 2026-03-16 | Closing price | 6.789999961853027 |
| 2026-03-17 | Closing price | 6.690000057220459 |
| 2026-03-18 | Closing price | 6.210000038146973 |
| 2026-03-19 | Closing price | 5.900000095367432 |
| 2026-03-20 | Closing price | 5.730000019073486 |
| 2026-03-23 | Closing price | 5.940000057220459 |
| 2026-03-24 | Closing price | 5.960000038146973 |
| 2026-03-25 | Closing price | 6.199999809265137 |
| 2026-03-26 | Closing price | 5.809999942779541 |
| 2026-03-27 | Closing price | 5.980000019073486 |
| 2026-03-30 | Closing price | 5.869999885559082 |
| 2026-03-31 | Closing price | 6.449999809265137 |
| 2026-04-01 | Closing price | 6.769999980926514 |
| 2026-04-02 | Closing price | 6.650000095367432 |
| 2026-04-06 | Closing price | 6.769999980926514 |
| 2026-04-07 | Closing price | 6.760000228881836 |
| 2026-04-08 | Closing price | 7.230000019073486 |
| 2026-04-09 | Closing price | 7.110000133514404 |
| 2026-04-10 | Closing price | 7.289999961853027 |
| 2026-04-13 | Closing price | 7.389999866485596 |
| 2026-04-14 | Closing price | 7.789999961853027 |
| 2026-04-15 | Closing price | 7.510000228881836 |
| 2026-04-16 | Closing price | 7.619999885559082 |
| 2026-04-17 | Closing price | 7.730000019073486 |
| 2026-04-20 | Closing price | 7.710000038146973 |
| 2026-04-21 | Closing price | 7.099999904632568 |
| 2026-04-22 | Closing price | 7.389999866485596 |
| 2026-04-23 | Closing price | 7.159999847412109 |
| 2026-04-24 | Closing price | 7.199999809265137 |
| 2026-04-27 | Closing price | 7.46999979019165 |
| 2026-04-28 | Closing price | 7.210000038146973 |
| 2026-04-29 | Closing price | 6.96999979019165 |
| 2026-04-30 | Closing price | 7.159999847412109 |
| 2026-05-01 | Closing price | 7.150000095367432 |
| 2026-05-04 | Closing price | 6.849999904632568 |
| 2026-05-05 | Closing price | 6.840000152587891 |
| 2026-05-06 | Closing price | 7.519999980926514 |
| 2026-05-07 | Closing price | 7.25 |
| 2026-05-08 | Closing price | 7.489999771118164 |
| 2026-05-11 | Closing price | 7.570000171661377 |
| 2026-05-12 | Closing price | 7.929999828338623 |
| 2026-05-13 | Closing price | 7.789999961853027 |
| 2026-05-14 | Closing price | 7.619999885559082 |
| 2026-05-15 | Closing price | 6.829999923706055 |
| 2026-05-18 | Closing price | 6.519999980926514 |
| 2026-05-19 | Closing price | 6.389999866485596 |
| 2026-05-20 | Closing price | 6.610000133514404 |
| 2026-05-21 | Closing price | 6.579999923706055 |
| 2026-05-22 | Closing price | 6.570000171661377 |
| 2026-05-26 | Closing price | 7.059999942779541 |
| 2026-05-27 | Closing price | 6.980000019073486 |
| 2026-05-28 | Closing price | 7.230000019073486 |
| 2026-05-29 | Closing price | 7.420000076293945 |
| 2026-06-01 | Closing price | 7.900000095367432 |
| 2026-06-02 | Closing price | 8.300000190734863 |
| 2026-06-03 | Closing price | 7.78000020980835 |
| 2026-06-04 | Closing price | 7.630000114440918 |
| 2026-06-05 | Closing price | 6.650000095367432 |
| 2026-06-08 | Closing price | 6.739999771118164 |
| 2026-06-09 | Closing price | 6.570000171661377 |
| 2026-06-10 | Closing price | 6.429999828338623 |
| 2026-06-11 | Closing price | 6.849999904632568 |
| 2026-06-12 | Closing price | 7.5 |
| 2026-06-15 | Closing price | 7.760000228881836 |
| 2026-06-16 | Closing price | 7.809999942779541 |
| 2026-06-17 | Closing price | 7.429999828338623 |
| 2026-06-18 | Closing price | 7.139999866485596 |
| 2026-06-22 | Closing price | 6.960000038146973 |
| 2026-06-23 | Closing price | 6.690000057220459 |
| 2026-06-24 | Closing price | 6.369999885559082 |
| 2026-06-25 | Closing price | 6.570000171661377 |
| 2026-06-26 | Closing price | 6.449999809265137 |
| 2026-06-29 | Closing price | 6.360000133514404 |
| 2026-06-30 | Closing price | 6.880000114440918 |
| 2026-07-01 | Closing price | 7.0 |
| 2026-07-02 | Closing price | 6.929999828338623 |
| 2026-07-06 | Closing price | 6.96999979019165 |
| 2026-07-07 | Closing price | 6.53000020980835 |
| 2026-07-08 | Closing price | 6.46999979019165 |
| 2026-07-09 | Closing price | 7.0 |
| 2026-07-10 | Closing price | 7.300000190734863 |
| 2026-07-13 | Closing price | 7.019999980926514 |
| 2026-07-14 | Closing price | 7.96999979019165 |
| 2026-07-15 | Closing price | 7.440000057220459 |
| 2026-07-16 | Closing price | 6.909999847412109 |
| 2026-07-17 | Closing price | 6.78000020980835 |
| 2026-07-20 | Closing price | 7.019999980926514 |
| 2026-07-21 | Closing price | 7.71999979019165 |
| 2026-07-22 | Closing price | 7.579999923706055 |
| 2026-07-23 | Closing price | 7.260000228881836 |
| 2026-07-24 | Closing price | 7.0 |
| 2026-07-27 | Closing price | 7.110000133514404 |
| 2026-07-28 | Closing price | 6.880000114440918 |
| 2026-07-29 | Closing price | 6.710000038146973 |
| 2026-07-30 | Closing price | 7.079999923706055 |
| 2026-07-31 | Closing price | 6.769999980926514 |
| 2026-08-03 | Closing price | 6.96999979019165 |
| 2026-08-04 | Closing price | 7.829999923706055 |
| 2026-08-05 | Closing price | 8.180000305175781 |
| 2026-08-06 | Closing price | 8.239999771118164 |
| 2026-08-07 | Closing price | 8.319999694824219 |
| 2026-08-10 | Closing price | 8.770000457763672 |
| 2026-08-11 | Closing price | 8.819999694824219 |
| 2026-08-12 | Closing price | 8.729999542236328 |
| 2026-08-13 | Closing price | 8.40999984741211 |
| 2026-08-14 | Closing price | 8.350000381469727 |
| 2026-08-17 | Closing price | 8.770000457763672 |
| 2026-08-18 | Closing price | 8.359999656677246 |
| 2026-08-19 | Closing price | 8.470000267028809 |
| 2026-08-20 | Closing price | 8.6899995803833 |
| 2026-08-21 | Closing price | 9.1899995803833 |
| 2026-08-24 | Closing price | 9.34000015258789 |
| 2026-08-25 | Closing price | 9.510000228881836 |
| 2026-08-26 | Closing price | 9.229999542236328 |
| 2026-08-27 | Closing price | 9.680000305175781 |
| 2026-08-28 | Closing price | 9.180000305175781 |
| 2026-08-31 | Closing price | 9.039999961853027 |
| 2026-09-01 | Closing price | 8.4399995803833 |
| 2026-09-02 | Closing price | 8.319999694824219 |
| 2026-09-03 | Closing price | 8.399999618530273 |
| 2026-09-04 | Closing price | 8.449999809265137 |
| 2026-09-08 | Closing price | 8.899999618530273 |
| 2026-09-09 | Closing price | 8.930000305175781 |
| 2026-09-10 | Closing price | 8.020000457763672 |
| 2026-09-11 | Closing price | 8.140000343322754 |
| 2026-09-14 | Closing price | 7.840000152587891 |
| 2026-09-15 | Closing price | 7.980000019073486 |
| 2026-09-16 | Closing price | 7.949999809265137 |
| 2026-09-17 | Closing price | 8.380000114440918 |
| 2026-09-18 | Closing price | 8.640000343322754 |
| 2026-09-21 | Closing price | 8.670000076293945 |
| 2026-09-22 | Closing price | 9.359999656677246 |
| 2026-09-23 | Closing price | 9.0600004196167 |
| 2026-09-24 | Closing price | 8.970000267028809 |
| 2026-09-25 | Closing price | 8.609999656677246 |
| 2026-09-28 | Closing price | 8.800000190734863 |
| 2026-09-29 | Closing price | 8.880000114440918 |
| 2026-09-30 | Closing price | 8.90999984741211 |
| 2026-10-01 | Closing price | 8.3100004196167 |
| 2026-10-02 | Closing price | 8.949999809265137 |
| 2026-10-05 | Closing price | 8.90999984741211 |
| 2026-10-06 | Closing price | 8.8100004196167 |
| 2026-10-07 | Closing price | 8.520000457763672 |
| 2026-10-08 | Closing price | 8.3100004196167 |
| 2026-10-09 | Closing price | 8.850000381469727 |
| 2026-10-12 | Closing price | 8.710000038146973 |
| 2026-10-13 | Closing price | 8.5600004196167 |
| 2026-10-14 | Closing price | 8.199999809265137 |
| 2026-10-15 | Closing price | 8.09000015258789 |
| 2026-10-16 | Closing price | 7.96999979019165 |
| 2026-10-19 | Closing price | 7.949999809265137 |
| 2026-10-20 | Closing price | 7.949999809265137 |
| 2026-10-21 | Closing price | 7.960000038146973 |
| 2026-10-22 | Closing price | 7.300000190734863 |
| 2026-10-23 | Closing price | 7.460000038146973 |
| 2026-10-26 | Closing price | 7.650000095367432 |
| 2026-10-27 | Closing price | 8.029999732971191 |
| 2026-10-28 | Closing price | 8.079999923706055 |
| 2026-10-29 | Closing price | 7.860000133514404 |
| 2026-10-30 | Closing price | 7.360000133514404 |
| 2026-11-02 | Closing price | 7.409999847412109 |
| 2026-11-03 | Closing price | 7.420000076293945 |
| 2026-11-04 | Closing price | 7.559999942779541 |
| 2026-11-05 | Closing price | 6.980000019073486 |
| 2026-11-06 | Closing price | 6.949999809265137 |
| 2026-11-09 | Closing price | 7.489999771118164 |
| 2026-11-10 | Closing price | 7.264999866485596 |
On the portal model the share trades 21% below fair value, and that upside is the main argument for the stock
On the portal model, which re-prices EBITDA at current copper prices at the target EV/EBITDA, fair value is 21% above the current market price. This is our own estimate, not a market consensus and not a target price.
The EV/EBITDA multiple is 8.14 on LTM and 8.1 at current prices. The facts give no three-year history of the multiple, so it cannot be compared with its own past. The +21% model upside is the only quantitative valuation anchor in the facts.
A P/E of 46.9 looks high, but it is distorted by low net profit: on EBITDA of USD 99.1m, quarterly net profit was USD 24.3m. For a copper producer EV/EBITDA is a more appropriate multiple than P/E.
Valuation on the latest reported figures
| Metric | Value |
|---|---|
| Market cap | 2.62 bn USD |
| P/E (LTM) | 46.9 |
| EV/EBITDA (LTM) | 8.1 |
| P/B | 7.14 |
| Net debt / EBITDA (LTM) | 1.13 |
| Operating cash flow (LTM) | 0.36 bn |
| ROE | 15.3% |
Net profit by quarter
| Period | Measure | bn USD |
|---|---|---|
| Q4 2024 | Net profit | −0.015156643000000001 |
| Q1 2025 | Net profit | −0.020439 |
| Q2 2025 | Net profit | 0.01565 |
| Q3 2025 | Net profit | −0.019922000000000002 |
| Q4 2025 | Net profit | 0.0031869999999999997 |
| Q1 2026 | Net profit | 0.012269 |
| Q2 2026 | Net profit | 0.016184999999999998 |
| Q3 2026 | Net profit | 0.024259 |
Bottom line
What was genuinely strong in the quarter is that the company earned USD 19.4m of EBITDA more than the price effect: volumes and unit costs did better than copper alone. Revenue of USD 247.0m and EBITDA of USD 99.1m are the highest in recent quarters, with a margin of 40.1% versus 32.3% a year earlier. The weak spot remains thin net profit of USD 24.3m on EBITDA of USD 99.1m: interest and taxes take most of operating profit. The key question for a holder is whether the copper price holds near USD 14,000: spot is already USD 13,997, and that decides whether EBITDA stays at the spot model's USD 369.3m. Our conclusion: rather attractive – the portal model puts the upside at +21% to fair value. Our view: the share is rather attractive at the current price; upside on the portal model +21%.