Teekay Tankers: rates doubled, yet the company earned less than the price allowed
Contents
On 13 November Teekay Tankers reported third-quarter 2026 results. The average Aframax TD25 rate in the quarter was $88,284 per day, 146.8% above a year earlier, and Suezmax TD20 was $140,436 (+246.4%). Revenue rose 61.2% to $369.2m, EBITDA by 248.2% to $224.4m and net profit by 112.0% to $195.2m. At the year-ago volumes and costs and current rates, our calculation implies revenue of $645.5m and EBITDA of $481m: the company earned $276.3m less on revenue and $256.6m less on EBITDA. Our conclusion: rather unattractive – on the portal's model the share trades 33% above its modelled fair value. Our view: the share is rather unattractive at the current price; upside on the portal model -33%.
Our view: is there upside
Our view in numbers
| Metric | Our read |
|---|---|
| Verdict | Rather unattractive |
| Upside on the portal model | -33% |
| How the model works | spot model: EBITDA re-priced to current commodity prices at the target EV/EBITDA, against market cap |
| EV/EBITDA now and 3-year average | 4.1 vs 2.4 – a 74% premium to its history |
| Dividend yield, 12m | 2.0% |
| Net debt / EBITDA | -1.43 – net cash |
| Strongest case for | Net cash of $1,023.9m and free cash flow of $92.8m in the quarter keep the balance sheet strong and the 1.96% dividend yield secure. |
| Strongest case against | On the portal's model the share is 33% above fair value, and EV/EBITDA of 4.1 is 74% above its own three-year average of 2.4. |
| What would change the view | A sustained Suezmax rate above $160,000 per day with Aframax near $76,250 would lift the EBITDA base and move the verdict one step up, toward neutral. |
Key takeaways
— Aframax and Suezmax rates rose 2.5–3.5-fold, yet revenue added only 61.2%
— At the quarter's rates our calculation implies EBITDA of $481m against $224.4m reported
— The EBITDA margin rose to 60.8% from 28.1%, yet it is still half of what the rates imply
— Net cash of $1,023.9m equals 1.43x annual EBITDA, so there is no leverage risk here
— Free cash flow of $92.8m covers the 1.96% dividend yield with room to spare
— EV/EBITDA of 4.1 against its own three-year average of 2.4 is a 74% premium to its history
— On the portal's model the share is 33% above fair value, and that decides the verdict
Key figures, USD bn
| Metric | Q3 2025 | Q3 2026 | Change |
|---|---|---|---|
| Revenue | 0.23 | 0.37 | +61.2% |
| EBITDA | 0.06 | 0.22 | +248.2% |
| Operating profit | 0.04 | 0.17 | +285.0% |
| Net profit | 0.09 | 0.20 | +112.0% |
| Operating cash flow | 0.07 | 0.14 | +93.3% |
| Capex | 0.13 | 0.05 | -59.5% |
| EBITDA margin | 28.1% | 60.8% | +32.7 pp |
| Net margin | 40.2% | 52.9% | +12.7 pp |
Aframax and Suezmax rates rose 2.5–3.5-fold, yet revenue added only 61.2%
The average Aframax TD25 rate on the USG–UKC route was $88,284 per day in the third quarter, 146.8% above a year earlier and 7.3% below the second quarter. Suezmax TD20 WAF–UKC averaged $140,436 per day: +246.4% year on year and +35.3% quarter on quarter. In the portal's model these two routes account for 52% and 43% of revenue respectively.
Revenue for the quarter was $369.2m, 61.2% more than a year earlier. That growth is well short of the move in the rates themselves, and it slowed from 63.0% in the second quarter to 61.2% in the third. Spot rates have since diverged: Aframax is at $76,250 per day, 13.6% below the quarterly average, while Suezmax is at $160,000, 13.9% above it.
Commodity prices: period average and now
| Benchmark | Year ago | Q3 2026 | YoY | Spot 2026-11-13 |
|---|---|---|---|---|
| Aframax TD25 USG-UKC TCE, USD/day, USD | 35 765 | 88 284 | +146,8% | 76 250 |
| Suezmax TD20 WAF-UKC TCE, USD/day, USD | 40 542 | 140 436 | +246,4% | 160 000 |
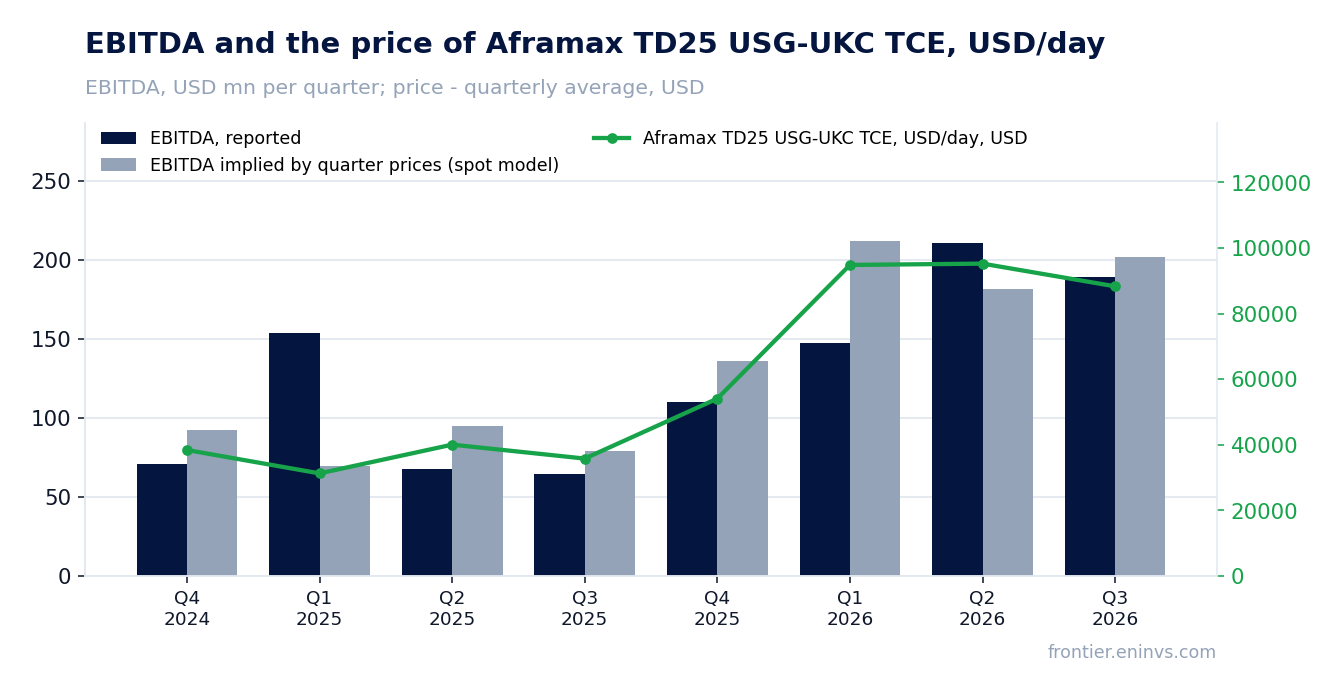
At the quarter's rates our calculation implies EBITDA of $481m against $224.4m reported
Holding third-quarter 2025 volumes and non-commodity costs and moving only the rates to third-quarter 2026 levels, revenue would have been $645.5m and EBITDA $481m. The company actually earned $369.2m of revenue and $224.4m of EBITDA: a gap of $276.3m on revenue (42.8%) and $256.6m on EBITDA (53.3%).
The quarter-on-quarter gap is smaller: at second-quarter volumes and costs and third-quarter rates, revenue would have been $422.3m and EBITDA $253.3m, $53.0m and $28.9m above the actual figures. The disclosure does not name the causes: only cargo volumes and rates are given, and the report does not explain the difference between the quoted rate and the realised price.
The portal's spot model, re-priced from the average of the previous four quarters, expected EBITDA of $202.1m and revenue of $361.2m; the actual figures were 11.0% and 2.2% above that. This estimate points the other way from the year-ago calculation, and for judging what the company should have earned at these rates we rely on the latter.
What the prices implied and what the company earned
| Base (Q3 2025) | Implied at period prices | Reported | Reported vs implied | |
|---|---|---|---|---|
| Revenue, USD mn | 229,0 | 645,5 | 369,2 | -42,8% |
| EBITDA, USD mn | 64,4 | 481,0 | 224,4 | -53,3% |
| EBITDA, portal spot model, USD mn | — | 202,1 | 224,4 | +11,0% |
Revenue and EBITDA by quarter
| Period | Measure | bn USD |
|---|---|---|
| Q4 2024 | Revenue | 0.258351 |
| Q1 2025 | Revenue | 0.231639 |
| Q2 2025 | Revenue | 0.23286600000000002 |
| Q3 2025 | Revenue | 0.229023 |
| Q4 2025 | Revenue | 0.258269 |
| Q1 2026 | Revenue | 0.286094 |
| Q2 2026 | Revenue | 0.37950799999999996 |
| Q3 2026 | Revenue | 0.36924599999999996 |
| Q4 2024 | EBITDA | 0.07080800000000001 |
| Q1 2025 | EBITDA | 0.15357400000000002 |
| Q2 2025 | EBITDA | 0.067606 |
| Q3 2025 | EBITDA | 0.06444799999999999 |
| Q4 2025 | EBITDA | 0.110101 |
| Q1 2026 | EBITDA | 0.147204 |
| Q2 2026 | EBITDA | 0.210494 |
| Q3 2026 | EBITDA | 0.188968 |
EBITDA margin
| Period | Measure | % |
|---|---|---|
| Q4 2024 | EBITDA margin | 27.4 |
| Q1 2025 | EBITDA margin | 66.3 |
| Q2 2025 | EBITDA margin | 29.0 |
| Q3 2025 | EBITDA margin | 28.1 |
| Q4 2025 | EBITDA margin | 42.6 |
| Q1 2026 | EBITDA margin | 51.5 |
| Q2 2026 | EBITDA margin | 55.5 |
| Q3 2026 | EBITDA margin | 51.2 |
The EBITDA margin rose to 60.8% from 28.1%, yet it is still half of what the rates imply
EBITDA for the quarter was $224.4m on revenue of $369.2m, a margin of 60.8% against 28.1% a year earlier. Operating profit was $167.5m and net profit $195.2m, a net margin of 52.9% against 40.2%. Net profit exceeds operating profit, the one place where the report raises a question: the difference comes from items below operating profit, and the disclosure does not break them out.
The margin rose because rates climbed faster than costs, but its level tells the same story as the gap to the calculated EBITDA: at $88,284 per day for Aframax and $140,436 for Suezmax, freight should have produced noticeably more per unit of revenue. Part of the difference may sit in the realised price against the benchmark, part in utilisation and voyage structure, but the report names no specific causes.
Net cash of $1,023.9m equals 1.43x annual EBITDA, so there is no leverage risk here
At 30 September 2026 net debt was negative at $1,023.9m, meaning the company held net cash. Against trailing-twelve-month EBITDA of $716.8m that is 1.43x annual EBITDA. The level is given as it stands; our data do not allow a comparison with the prior period, so we make no claim about the direction of change.
Operating cash flow for the quarter was $144.7m and capital expenditure $52.0m, implying free cash flow of about $92.8m. With net cash and that level of cash generation, interest expense is not a constraint, and the liquidity cushion lets the company ride out weaker rates without balance-sheet pressure.
Free cash flow of $92.8m covers the 1.96% dividend yield with room to spare
The trailing-twelve-month dividend yield is 1.96% on a market capitalisation of $3,110.0m. With free cash flow of $92.8m in a single quarter, the payout is covered by cash generation with room to spare, and net cash of $1,023.9m allows payment even in a weak year.
Our estimate for the current year's dividend rests on trailing-twelve-month profit of $546.7m and the actual payout base; if the current policy holds, the yield stays around 2%. The one risk to the payout is a fall in rates: Aframax is already at $76,250 per day, 13.6% below the quarterly average, and if Suezmax follows, profit and the dividend will compress.
Valuation vs its own history
now vs the 3-year average
| Period | Measure | × |
|---|---|---|
| EV/EBITDA | Now | 4.093924026940732 |
| EV/EBITDA | 3-year average | 2.3566787913120897 |
EV/EBITDA of 4.1 against its own three-year average of 2.4 is a 74% premium to its history
On trailing-twelve-month EV/EBITDA the share trades at 4.1 against its own three-year average of 2.4, a 74% premium. P/E on the same basis is 5.7 and return on equity 31.6%. By earnings the stock looks cheap, but by enterprise value to EBITDA it is more expensive than it has been for three years.
The gap arises because trailing-twelve-month profit was earned at high rates, and EV/EBITDA is measured against that same high base. Re-pricing EBITDA to today's rates, the portal's model gives $799.7m against $692.2m for the last twelve months (+15.5%), which brings EV/EBITDA down to 2.6 and net cash to 1.28x annual EBITDA. That base, not the historical one, should be the starting point for valuation.
Share price, three years
close, last point 2026-11-13
| Period | Measure | USD per share |
|---|---|---|
| 2025-11-14 | Closing price | 62.470001220703125 |
| 2025-11-17 | Closing price | 62.4900016784668 |
| 2025-11-18 | Closing price | 63.029998779296875 |
| 2025-11-19 | Closing price | 61.88999938964844 |
| 2025-11-20 | Closing price | 60.52000045776367 |
| 2025-11-21 | Closing price | 62.25 |
| 2025-11-24 | Closing price | 60.9900016784668 |
| 2025-11-25 | Closing price | 59.27000045776367 |
| 2025-11-26 | Closing price | 58.11000061035156 |
| 2025-11-28 | Closing price | 57.66999816894531 |
| 2025-12-01 | Closing price | 55.529998779296875 |
| 2025-12-02 | Closing price | 55.790000915527344 |
| 2025-12-03 | Closing price | 57.0 |
| 2025-12-04 | Closing price | 55.470001220703125 |
| 2025-12-05 | Closing price | 55.209999084472656 |
| 2025-12-08 | Closing price | 55.33000183105469 |
| 2025-12-09 | Closing price | 53.849998474121094 |
| 2025-12-10 | Closing price | 53.470001220703125 |
| 2025-12-11 | Closing price | 53.93000030517578 |
| 2025-12-12 | Closing price | 53.59000015258789 |
| 2025-12-15 | Closing price | 54.08000183105469 |
| 2025-12-16 | Closing price | 53.63999938964844 |
| 2025-12-17 | Closing price | 54.4900016784668 |
| 2025-12-18 | Closing price | 53.75 |
| 2025-12-19 | Closing price | 54.18000030517578 |
| 2025-12-22 | Closing price | 54.369998931884766 |
| 2025-12-23 | Closing price | 53.84000015258789 |
| 2025-12-24 | Closing price | 53.86000061035156 |
| 2025-12-26 | Closing price | 54.34000015258789 |
| 2025-12-29 | Closing price | 54.400001525878906 |
| 2025-12-30 | Closing price | 53.16999816894531 |
| 2025-12-31 | Closing price | 53.41999816894531 |
| 2026-01-02 | Closing price | 51.5 |
| 2026-01-05 | Closing price | 51.959999084472656 |
| 2026-01-06 | Closing price | 53.4900016784668 |
| 2026-01-07 | Closing price | 59.02000045776367 |
| 2026-01-08 | Closing price | 59.099998474121094 |
| 2026-01-09 | Closing price | 58.93000030517578 |
| 2026-01-12 | Closing price | 58.70000076293945 |
| 2026-01-13 | Closing price | 60.75 |
| 2026-01-14 | Closing price | 61.41999816894531 |
| 2026-01-15 | Closing price | 59.810001373291016 |
| 2026-01-16 | Closing price | 60.13999938964844 |
| 2026-01-20 | Closing price | 60.849998474121094 |
| 2026-01-21 | Closing price | 62.0 |
| 2026-01-22 | Closing price | 60.470001220703125 |
| 2026-01-23 | Closing price | 61.779998779296875 |
| 2026-01-26 | Closing price | 61.45000076293945 |
| 2026-01-27 | Closing price | 61.90999984741211 |
| 2026-01-28 | Closing price | 63.33000183105469 |
| 2026-01-29 | Closing price | 64.19000244140625 |
| 2026-01-30 | Closing price | 64.5199966430664 |
| 2026-02-02 | Closing price | 65.25 |
| 2026-02-03 | Closing price | 65.13999938964844 |
| 2026-02-04 | Closing price | 64.2699966430664 |
| 2026-02-05 | Closing price | 64.41999816894531 |
| 2026-02-06 | Closing price | 66.73999786376953 |
| 2026-02-09 | Closing price | 66.93000030517578 |
| 2026-02-10 | Closing price | 66.97000122070312 |
| 2026-02-11 | Closing price | 69.56999969482422 |
| 2026-02-12 | Closing price | 68.44999694824219 |
| 2026-02-13 | Closing price | 70.55000305175781 |
| 2026-02-17 | Closing price | 71.61000061035156 |
| 2026-02-18 | Closing price | 72.54000091552734 |
| 2026-02-19 | Closing price | 73.88999938964844 |
| 2026-02-20 | Closing price | 72.87999725341797 |
| 2026-02-23 | Closing price | 71.81999969482422 |
| 2026-02-24 | Closing price | 73.81999969482422 |
| 2026-02-25 | Closing price | 74.7699966430664 |
| 2026-02-26 | Closing price | 76.98999786376953 |
| 2026-02-27 | Closing price | 78.2699966430664 |
| 2026-03-02 | Closing price | 78.13999938964844 |
| 2026-03-03 | Closing price | 75.88999938964844 |
| 2026-03-04 | Closing price | 77.27999877929688 |
| 2026-03-05 | Closing price | 73.19999694824219 |
| 2026-03-06 | Closing price | 71.80999755859375 |
| 2026-03-09 | Closing price | 74.37999725341797 |
| 2026-03-10 | Closing price | 72.5 |
| 2026-03-11 | Closing price | 69.44999694824219 |
| 2026-03-12 | Closing price | 64.97000122070312 |
| 2026-03-13 | Closing price | 63.38999938964844 |
| 2026-03-16 | Closing price | 66.19999694824219 |
| 2026-03-17 | Closing price | 63.91999816894531 |
| 2026-03-18 | Closing price | 65.94000244140625 |
| 2026-03-19 | Closing price | 68.06999969482422 |
| 2026-03-20 | Closing price | 67.08000183105469 |
| 2026-03-23 | Closing price | 69.4000015258789 |
| 2026-03-24 | Closing price | 72.98999786376953 |
| 2026-03-25 | Closing price | 70.37000274658203 |
| 2026-03-26 | Closing price | 70.5999984741211 |
| 2026-03-27 | Closing price | 72.44999694824219 |
| 2026-03-30 | Closing price | 72.02999877929688 |
| 2026-03-31 | Closing price | 73.31999969482422 |
| 2026-04-01 | Closing price | 72.95999908447266 |
| 2026-04-02 | Closing price | 76.98999786376953 |
| 2026-04-06 | Closing price | 78.20999908447266 |
| 2026-04-07 | Closing price | 75.81999969482422 |
| 2026-04-08 | Closing price | 77.04000091552734 |
| 2026-04-09 | Closing price | 74.87000274658203 |
| 2026-04-10 | Closing price | 73.95999908447266 |
| 2026-04-13 | Closing price | 75.08000183105469 |
| 2026-04-14 | Closing price | 72.88999938964844 |
| 2026-04-15 | Closing price | 74.7300033569336 |
| 2026-04-16 | Closing price | 74.41000366210938 |
| 2026-04-17 | Closing price | 75.29000091552734 |
| 2026-04-20 | Closing price | 76.5 |
| 2026-04-21 | Closing price | 73.62999725341797 |
| 2026-04-22 | Closing price | 73.41999816894531 |
| 2026-04-23 | Closing price | 73.80000305175781 |
| 2026-04-24 | Closing price | 75.94000244140625 |
| 2026-04-27 | Closing price | 77.70999908447266 |
| 2026-04-28 | Closing price | 78.02999877929688 |
| 2026-04-29 | Closing price | 78.30999755859375 |
| 2026-04-30 | Closing price | 78.55000305175781 |
| 2026-05-01 | Closing price | 80.4800033569336 |
| 2026-05-04 | Closing price | 79.69999694824219 |
| 2026-05-05 | Closing price | 82.61000061035156 |
| 2026-05-06 | Closing price | 79.37999725341797 |
| 2026-05-07 | Closing price | 81.2699966430664 |
| 2026-05-08 | Closing price | 83.02999877929688 |
| 2026-05-11 | Closing price | 81.55999755859375 |
| 2026-05-12 | Closing price | 80.05999755859375 |
| 2026-05-13 | Closing price | 77.56999969482422 |
| 2026-05-14 | Closing price | 77.33999633789062 |
| 2026-05-15 | Closing price | 77.19000244140625 |
| 2026-05-18 | Closing price | 76.94000244140625 |
| 2026-05-19 | Closing price | 75.9800033569336 |
| 2026-05-20 | Closing price | 78.98999786376953 |
| 2026-05-21 | Closing price | 77.69999694824219 |
| 2026-05-22 | Closing price | 77.20999908447266 |
| 2026-05-26 | Closing price | 75.5199966430664 |
| 2026-05-27 | Closing price | 73.9800033569336 |
| 2026-05-28 | Closing price | 70.29000091552734 |
| 2026-05-29 | Closing price | 70.3499984741211 |
| 2026-06-01 | Closing price | 72.20999908447266 |
| 2026-06-02 | Closing price | 70.58999633789062 |
| 2026-06-03 | Closing price | 70.77999877929688 |
| 2026-06-04 | Closing price | 70.12999725341797 |
| 2026-06-05 | Closing price | 72.19999694824219 |
| 2026-06-08 | Closing price | 71.66000366210938 |
| 2026-06-09 | Closing price | 72.01000213623047 |
| 2026-06-10 | Closing price | 72.76000213623047 |
| 2026-06-11 | Closing price | 72.5 |
| 2026-06-12 | Closing price | 75.4000015258789 |
| 2026-06-15 | Closing price | 75.55999755859375 |
| 2026-06-16 | Closing price | 75.13999938964844 |
| 2026-06-17 | Closing price | 73.93000030517578 |
| 2026-06-18 | Closing price | 74.44999694824219 |
| 2026-06-22 | Closing price | 77.58000183105469 |
| 2026-06-23 | Closing price | 79.20999908447266 |
| 2026-06-24 | Closing price | 76.33999633789062 |
| 2026-06-25 | Closing price | 70.27999877929688 |
| 2026-06-26 | Closing price | 67.98999786376953 |
| 2026-06-29 | Closing price | 65.98999786376953 |
| 2026-06-30 | Closing price | 64.87000274658203 |
| 2026-07-01 | Closing price | 64.33000183105469 |
| 2026-07-02 | Closing price | 67.5999984741211 |
| 2026-07-06 | Closing price | 68.76000213623047 |
| 2026-07-07 | Closing price | 69.33000183105469 |
| 2026-07-08 | Closing price | 71.69000244140625 |
| 2026-07-09 | Closing price | 69.2699966430664 |
| 2026-07-10 | Closing price | 72.44999694824219 |
| 2026-07-13 | Closing price | 70.72000122070312 |
| 2026-07-14 | Closing price | 72.2699966430664 |
| 2026-07-15 | Closing price | 72.73999786376953 |
| 2026-07-16 | Closing price | 71.83000183105469 |
| 2026-07-17 | Closing price | 70.06999969482422 |
| 2026-07-20 | Closing price | 71.91000366210938 |
| 2026-07-21 | Closing price | 75.55999755859375 |
| 2026-07-22 | Closing price | 74.77999877929688 |
| 2026-07-23 | Closing price | 75.69000244140625 |
| 2026-07-24 | Closing price | 75.80999755859375 |
| 2026-07-27 | Closing price | 75.97000122070312 |
| 2026-07-28 | Closing price | 76.77999877929688 |
| 2026-07-29 | Closing price | 78.18000030517578 |
| 2026-07-30 | Closing price | 77.36000061035156 |
| 2026-07-31 | Closing price | 79.37000274658203 |
| 2026-08-03 | Closing price | 80.4800033569336 |
| 2026-08-04 | Closing price | 76.80000305175781 |
| 2026-08-05 | Closing price | 74.41999816894531 |
| 2026-08-06 | Closing price | 77.08999633789062 |
| 2026-08-07 | Closing price | 77.25 |
| 2026-08-10 | Closing price | 76.20999908447266 |
| 2026-08-11 | Closing price | 77.47000122070312 |
| 2026-08-12 | Closing price | 80.88999938964844 |
| 2026-08-13 | Closing price | 83.54000091552734 |
| 2026-08-14 | Closing price | 85.12999725341797 |
| 2026-08-17 | Closing price | 89.11000061035156 |
| 2026-08-18 | Closing price | 89.0999984741211 |
| 2026-08-19 | Closing price | 90.81999969482422 |
| 2026-08-20 | Closing price | 91.12000274658203 |
| 2026-08-21 | Closing price | 91.0199966430664 |
| 2026-08-24 | Closing price | 92.01000213623047 |
| 2026-08-25 | Closing price | 90.02999877929688 |
| 2026-08-26 | Closing price | 83.19999694824219 |
| 2026-08-27 | Closing price | 88.19999694824219 |
| 2026-08-28 | Closing price | 88.69999694824219 |
| 2026-08-31 | Closing price | 89.63999938964844 |
| 2026-09-01 | Closing price | 88.30000305175781 |
| 2026-09-02 | Closing price | 90.75 |
| 2026-09-03 | Closing price | 91.83000183105469 |
| 2026-09-04 | Closing price | 93.37000274658203 |
| 2026-09-08 | Closing price | 92.33000183105469 |
| 2026-09-09 | Closing price | 96.30999755859375 |
| 2026-09-10 | Closing price | 98.25 |
| 2026-09-11 | Closing price | 100.83000183105469 |
| 2026-09-14 | Closing price | 100.0 |
| 2026-09-15 | Closing price | 99.25 |
| 2026-09-16 | Closing price | 100.62999725341797 |
| 2026-09-17 | Closing price | 100.81999969482422 |
| 2026-09-18 | Closing price | 100.91999816894531 |
| 2026-09-21 | Closing price | 98.76000213623047 |
| 2026-09-22 | Closing price | 95.5999984741211 |
| 2026-09-23 | Closing price | 94.54000091552734 |
| 2026-09-24 | Closing price | 94.08000183105469 |
| 2026-09-25 | Closing price | 94.06999969482422 |
| 2026-09-28 | Closing price | 95.70999908447266 |
| 2026-09-29 | Closing price | 96.80999755859375 |
| 2026-09-30 | Closing price | 97.05999755859375 |
| 2026-10-01 | Closing price | 101.01000213623047 |
| 2026-10-02 | Closing price | 103.0999984741211 |
| 2026-10-05 | Closing price | 103.37999725341797 |
| 2026-10-06 | Closing price | 101.23999786376953 |
| 2026-10-07 | Closing price | 102.12000274658203 |
| 2026-10-08 | Closing price | 106.62000274658203 |
| 2026-10-09 | Closing price | 106.13999938964844 |
| 2026-10-12 | Closing price | 108.43000030517578 |
| 2026-10-13 | Closing price | 106.38999938964844 |
| 2026-10-14 | Closing price | 101.55999755859375 |
| 2026-10-15 | Closing price | 97.02999877929688 |
| 2026-10-16 | Closing price | 96.81999969482422 |
| 2026-10-19 | Closing price | 94.80000305175781 |
| 2026-10-20 | Closing price | 94.47000122070312 |
| 2026-10-21 | Closing price | 95.98999786376953 |
| 2026-10-22 | Closing price | 95.30999755859375 |
| 2026-10-23 | Closing price | 99.47000122070312 |
| 2026-10-26 | Closing price | 101.0 |
| 2026-10-27 | Closing price | 98.0999984741211 |
| 2026-10-28 | Closing price | 99.29000091552734 |
| 2026-10-29 | Closing price | 101.2300033569336 |
| 2026-10-30 | Closing price | 100.80000305175781 |
| 2026-11-02 | Closing price | 95.47000122070312 |
| 2026-11-03 | Closing price | 95.58000183105469 |
| 2026-11-04 | Closing price | 88.87999725341797 |
| 2026-11-05 | Closing price | 81.97000122070312 |
| 2026-11-06 | Closing price | 85.70999908447266 |
| 2026-11-09 | Closing price | 85.12000274658203 |
| 2026-11-10 | Closing price | 85.69999694824219 |
| 2026-11-11 | Closing price | 88.95999908447266 |
| 2026-11-12 | Closing price | 88.5 |
| 2026-11-13 | Closing price | 89.43000030517578 |
On the portal's model the share is 33% above fair value, and that decides the verdict
On the portal's model, which re-prices EBITDA to current rates and values it at a target EV/EBITDA, the share is 33% above modelled fair value. This is our own estimate, not a market consensus or a target price. At current rates EBITDA is $799.7m and EV/EBITDA 2.6; the margin of safety is negative because the market has already priced in the high base.
The multiple against history points the same way: 4.1 against 2.4 over three years. Both yardsticks – the model and the premium to its own history – point in the same direction, which makes the conclusion robust. What would change it: a sustained Suezmax rate above $160,000 per day with Aframax holding near $76,250 would lift the EBITDA base and bring the multiple back toward its historical level.
Valuation on the latest reported figures
| Metric | Value |
|---|---|
| Market cap | 3.11 bn USD |
| P/E (LTM) | 5.7 |
| EV/EBITDA (LTM) | 4.1 |
| P/B | 1.95 |
| Net debt / EBITDA (LTM) | -1.43 |
| Operating cash flow (LTM) | 0.49 bn |
| ROE | 31.6% |
| Dividend yield (12m) | 2.0% |
| EV/EBITDA, 3-year average | 2.4 |
Net profit by quarter
| Period | Measure | bn USD |
|---|---|---|
| Q4 2024 | Net profit | 0.082121 |
| Q1 2025 | Net profit | 0.075562 |
| Q2 2025 | Net profit | 0.062182 |
| Q3 2025 | Net profit | 0.092079 |
| Q4 2025 | Net profit | 0.120461 |
| Q1 2026 | Net profit | 0.153551 |
| Q2 2026 | Net profit | 0.230989 |
| Q3 2026 | Net profit | 0.195221 |
Bottom line
The quarter's strength was the rate environment: Aframax and Suezmax rates rose 146.8% and 246.4%, and the company closed the quarter with EBITDA of $224.4m and a 60.8% margin. Yet at those rates our calculation implies EBITDA of $481m – a gap of $256.6m that the report does not explain with verifiable causes. Net cash of $1,023.9m and free cash flow of $92.8m keep the balance sheet strong and the 1.96% dividend yield secure. The question for a holder now is price: EV/EBITDA of 4.1 against its own three-year average of 2.4 is a 74% premium, and on the portal's model the share is 33% above fair value. Our conclusion: rather unattractive – the portal's model implies 33% downside. Our view: the share is rather unattractive at the current price; upside on the portal model -33%.