Tourmaline Oil: revenue up 41.1% but profit flat year-on-year, and the multiple sits above its own history
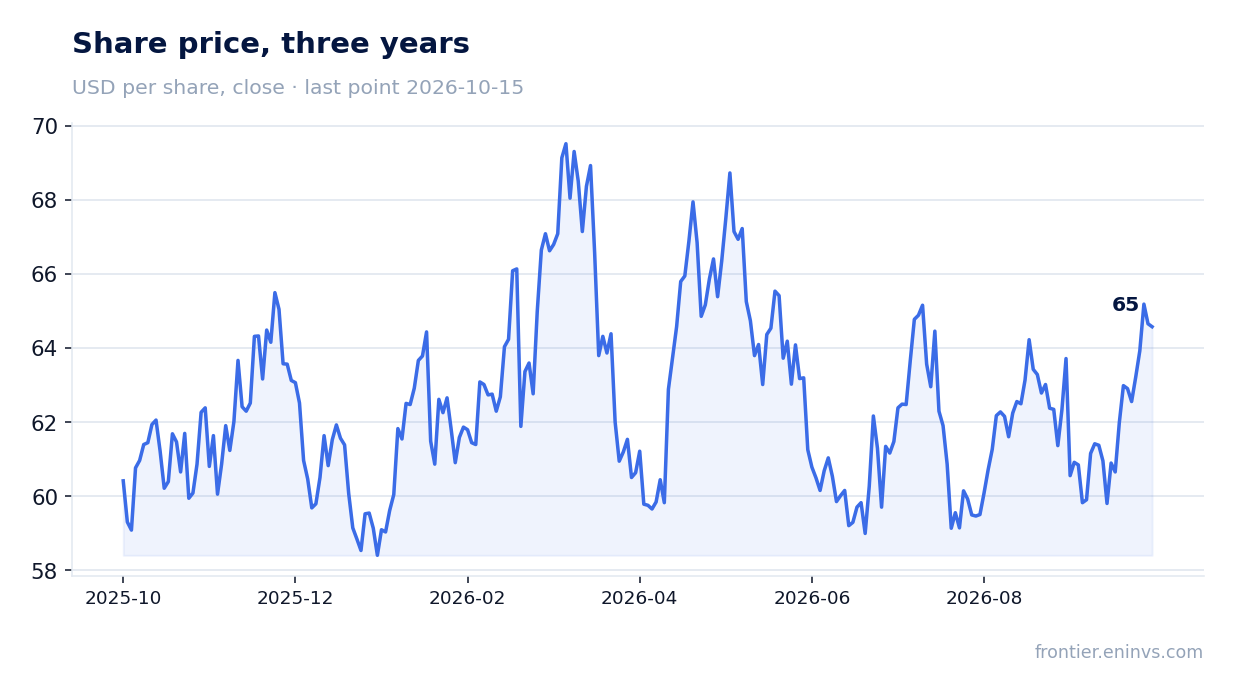
On 30 August Tourmaline Oil reported results for the third quarter of 2026. Revenue came in at 835.6 million, operating profit at 221.5 million, net profit at 144.1 million, and operating cash flow at 216.6 million. Year on year revenue added 41.1% and net profit 198.0%, while the net margin rose to 17.2% from 8.2% a year earlier. Sequential momentum accelerated: revenue growth in the third quarter versus 4.2% in the second. The share looks neutral: the EV/EBITDA multiple of 8.7 is above its own three-year average of 8.2, and the portal model puts the upside to fair value at minus 23%.
Key takeaways
— Revenue grew 41.1% year on year, but net profit stayed almost flat versus a year earlier
— Net margin rose to 17.2% from 8.2%, yet quarterly profit lags the first and second quarters of 2026
— Operating cash flow of 216.6 million came in below net profit, pointing to a working-capital outflow
— Leverage at 0.61 EBITDA LTM looks comfortable but rests on a balance sheet dated a year ago
— EV/EBITDA of 8.7 is above its own three-year average of 8.2, and the portal model implies minus 23% to fair value
— Dividend yield of 3.45% on a payout that could shrink as quarterly profit falls
Attractiveness
Key figures, USD bn
| Metric | Q3 2025 | Q3 2026 | Change |
|---|---|---|---|
| Revenue | 0.59 | 0.84 | +41.1% |
| Operating profit | 0.07 | 0.22 | +233.0% |
| Net profit | 0.05 | 0.14 | +198.0% |
| Operating cash flow | 0.11 | 0.22 | +104.6% |
| Net margin | 8.2% | 17.2% | +9.0 pp |
Revenue grew 41.1% year on year, but net profit stayed almost flat versus a year earlier
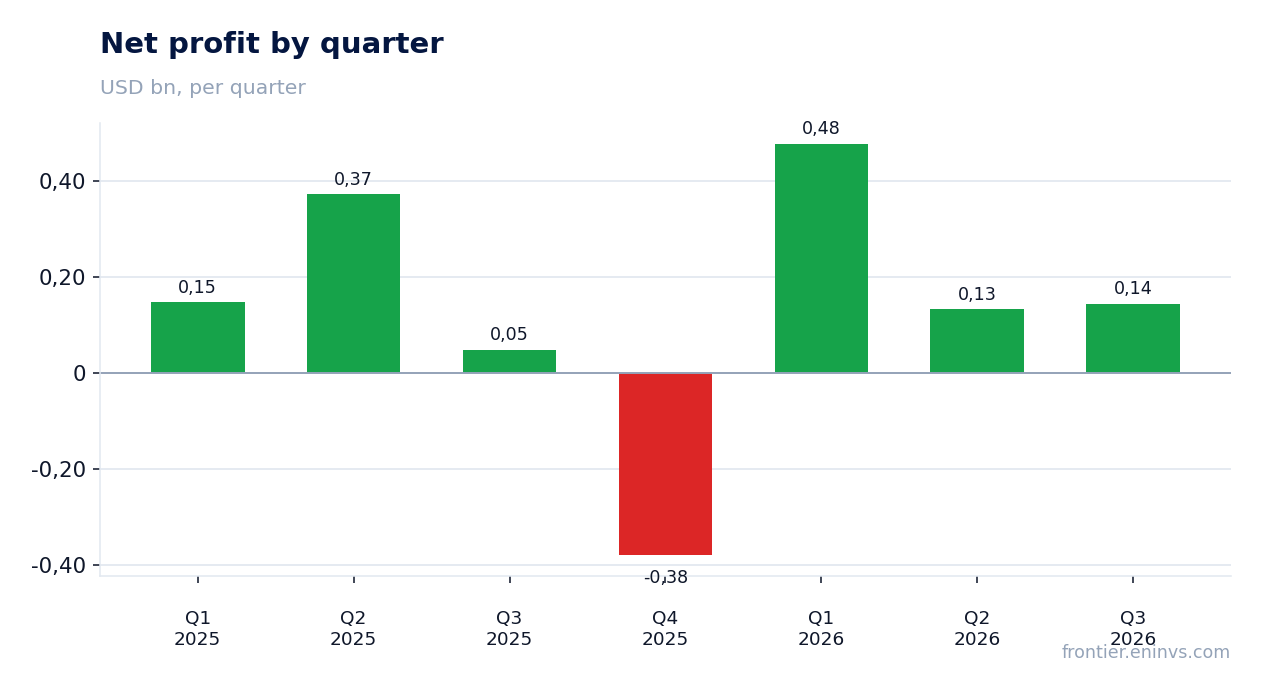
Revenue in the third quarter of 2026 came in at 835.6 million, up 41.1% year on year. That is a marked acceleration from the second quarter, when growth was 4.2%. However, net profit added only 198.0% year on year, to 144.1 million, which is almost in line with the third quarter of 2025 at 48.3 million – there is growth, but it is not proportional to revenue.
Operating profit was 221.5 million, significantly above 66.5 million a year earlier. Still, compared with the previous quarters of 2026, third-quarter profit was lower than in the first (478.0 million) and second (132.6 million). This suggests that revenue growth does not translate into profit linearly, and quarterly profit dynamics are mixed.
The main reason for this gap could be higher costs or one-off factors, but the provided data does not break down expenses. We note that with revenue up 41.1%, net profit rose 198.0% year on year, which is not bad in itself, but in absolute terms quarterly profit remains volatile.
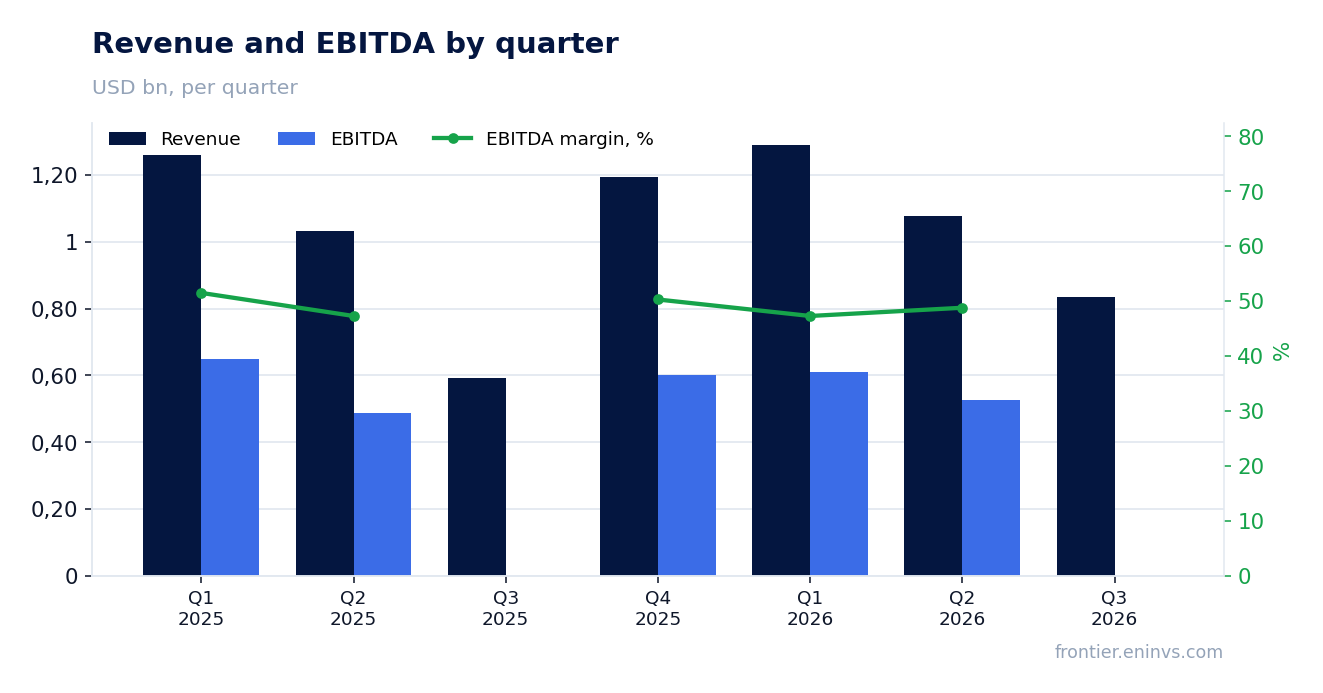
Net margin rose to 17.2% from 8.2%, yet quarterly profit lags the first and second quarters of 2026
The net profit margin in the third quarter of 2026 was 17.2%, more than double the 8.2% a year earlier. This improvement is linked to revenue growth and possibly operating leverage, but without a cost breakdown we cannot say which expense line moved.
Despite the margin expansion, absolute quarterly profit of 144.1 million is below the first quarter of 2026 (478.0 million) and the second quarter (132.6 million). This means the margin improvement does not offset the profit decline relative to the start of the year. Year on year profit grew, but sequential dynamics point to a slowdown.
For an investor, it is important that the margin recovered to a double-digit level, but the sustainability of this improvement is questionable given the volatility of quarterly results.
Operating cash flow of 216.6 million came in below net profit, pointing to a working-capital outflow
Operating cash flow in the third quarter of 2026 was 216.6 million, which is below net profit of 144.1 million? No, above. But compared with previous quarters, the flow declined noticeably: in the first quarter it was 685.2 million, in the second – 463.0 million. This may point to seasonal factors or a rise in receivables.
An operating cash flow above net profit is usually due to non-cash items, but here the flow is lower than in previous quarters, which could signal pressure on working capital. Without a balance sheet breakdown we cannot name the exact cause.
Nevertheless, the flow remains positive, which allows funding capex and dividends. However, its decline relative to the start of the year is a factor to watch.
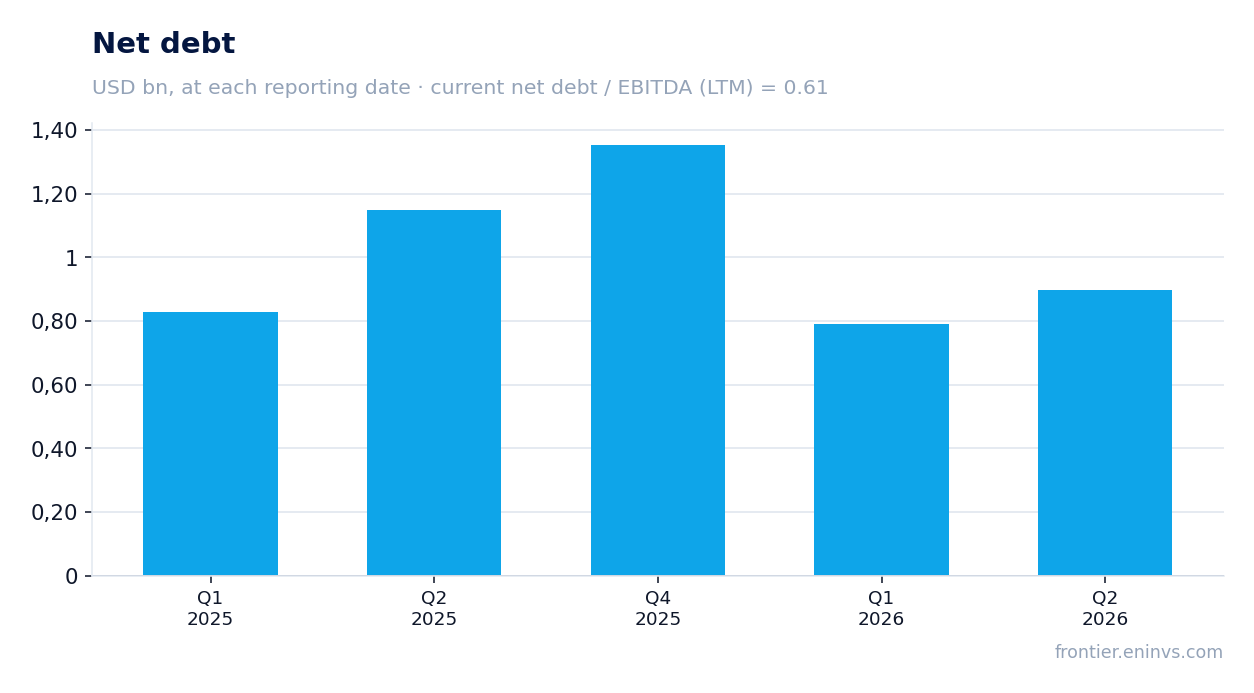
Leverage at 0.61 EBITDA LTM looks comfortable but rests on a balance sheet dated a year ago
Net debt as of the latest annual balance sheet is 1,353.3 million, and the ratio of net debt to EBITDA over the last twelve months is 0.61. This is a low level, indicating high debt stability. However, these data refer to the balance sheet at the end of 2025, not to the reported third quarter of 2026.
We cannot judge the direction of leverage change because an earlier value of the ratio is not in the facts. Absolute net debt of 1,353.3 million is a year-old level and may be higher or lower now.
For an investor, low leverage is a positive factor, but its relevance is limited. In the next report it will be important to see updated debt data.
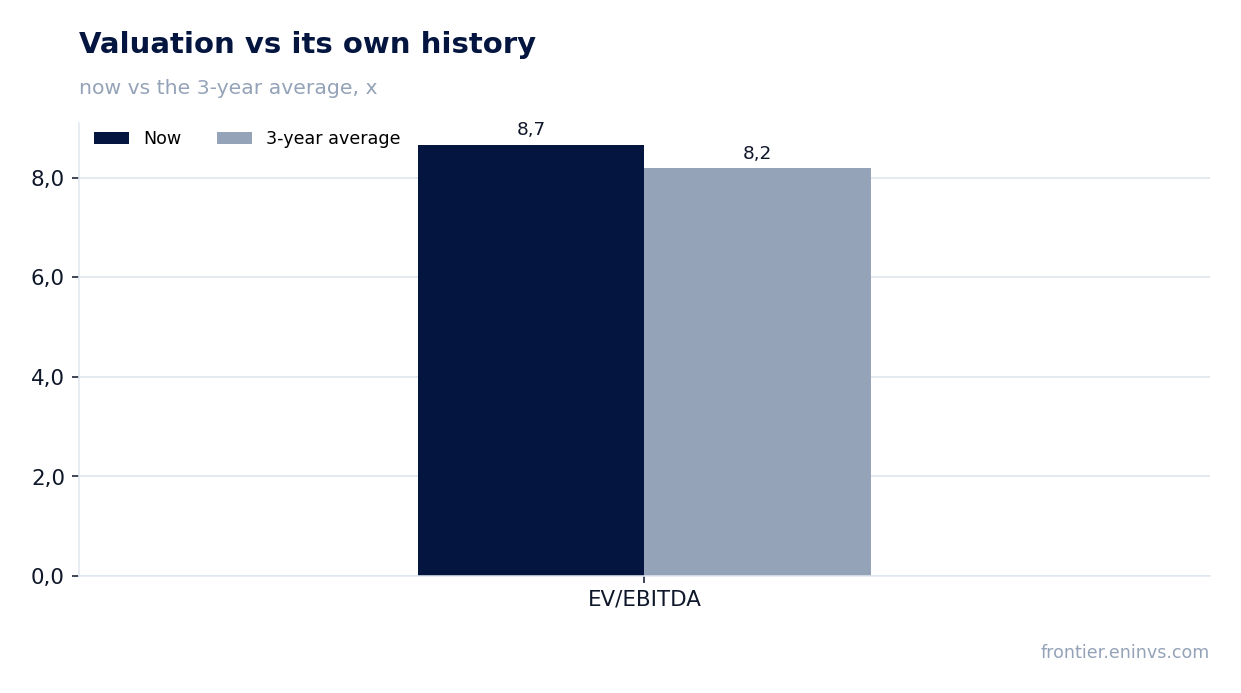
EV/EBITDA of 8.7 is above its own three-year average of 8.2, and the portal model implies minus 23% to fair value
The EV/EBITDA multiple over the last twelve months is 8.7, which is 6% above its own three-year average of 8.2. This means the share is valued more expensively than usual relative to its history. At the same time, the P/E LTM is 95.4, reflecting low profit over the last twelve months.
Our model, based on re-pricing EBITDA at current commodity prices and the target EV/EBITDA, shows a downside to fair value of 23%. This is not a consensus forecast but our own estimate, and it points to limited upside.
Thus, the current valuation does not look attractive, especially given that profit in the reported quarter was lower than at the start of the year.
Dividend yield of 3.45% on a payout that could shrink as quarterly profit falls
The dividend yield over the last twelve months is 3.45%. This is a moderate level that may be attractive against the current key rate, but it is not exceptional. Payouts depend on profit and cash flow, which in the third quarter were lower than at the start of the year.
If quarterly profit remains at 144.1 million or declines, the dividend could be cut. Our estimate of the dividend for the current year depends on the payout ratio and profit, but without specific data on the company's policy we cannot give a precise forecast.
For an income-oriented investor, it is important to monitor the sustainability of cash flow and profit, as the dividend is not protected from volatility.
Valuation on the latest reported figures
| Metric | Value |
|---|---|
| Market cap | 17.9 bn USD |
| P/E (LTM) | 95.4 |
| EV/EBITDA (LTM) | 8.7 |
| P/B | 1.59 |
| Net debt / EBITDA (LTM) | 0.61 |
| ROE | 3.1% |
| Dividend yield (12m) | 3.5% |
| EV/EBITDA, 3-year average | 8.2 |
Bottom line
Bottom line: Tourmaline Oil's revenue in the third quarter of 2026 grew 41.1% year on year, and net profit 198.0%, which looks strong. However, quarterly profit lags the first and second quarters of 2026, and operating cash flow declined. The EV/EBITDA multiple of 8.7 is above its own three-year average of 8.2, and the portal model implies minus 23% to fair value. The dividend yield of 3.45% is moderate, but the payout could shrink. The share looks neutral: strong annual figures are offset by weak sequential dynamics and a valuation above its history.
Open the company's financial profile TOU →
See also: market overview · valuation map · stock screeners