Texas Pacific Land Corporation: revenue accelerated to 34.6%, yet the market met the report with a 14% drop

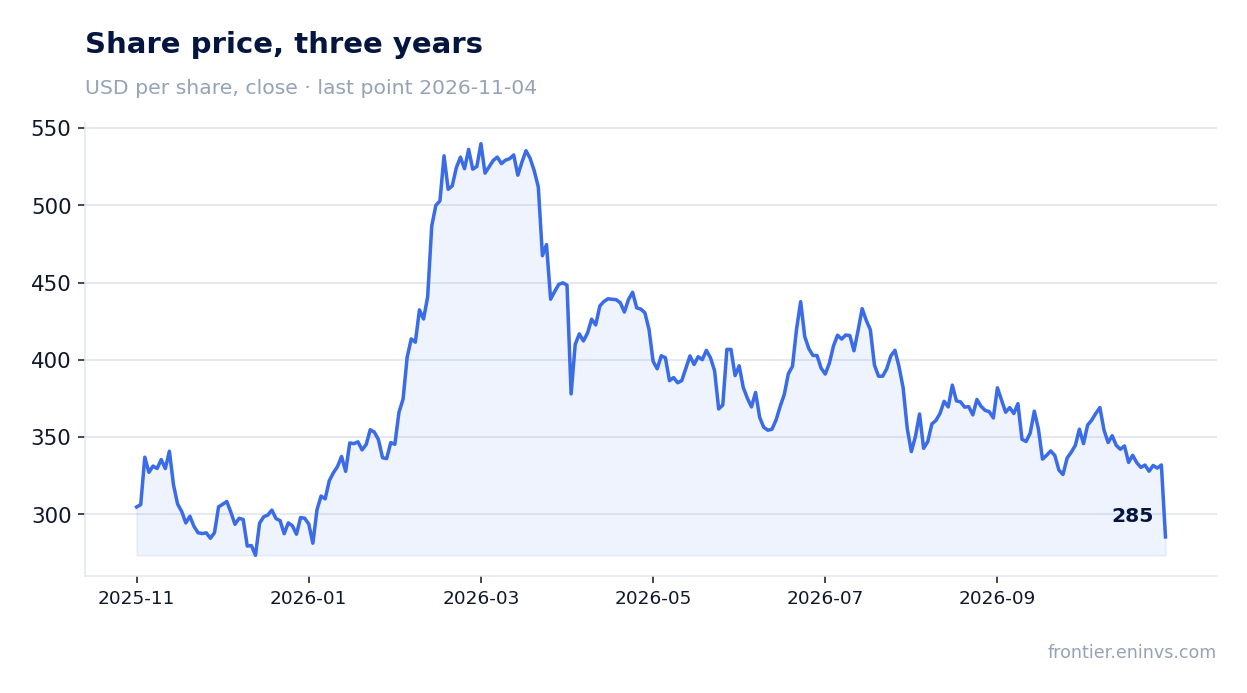
On 4 November Texas Pacific Land Corporation released its third-quarter 2026 results. Revenue came in at 273.39 million dollars, up 34.6% year on year, EBITDA at 230.62 million with an 84.4% margin, and net profit at 167.37 million. Growth accelerated from the second quarter, when revenue rose 31.2%, and the company carries no debt: net debt at the end of September was negative, minus 354.33 million. Despite the strong figures, the share fell 14.0% on the release day, and at an EV/EBITDA of 24.0 against its own three-year average of 45.1 the stock looks cheaper than its history, but the portal's model points to minus 49% upside – a neutral verdict.
Key takeaways
— Revenue rose 34.6% year on year, and growth accelerated from 31.2% in the second quarter
— The EBITDA margin climbed to 84.4% from 80.8% a year earlier, the best level in recent quarters
— Net profit added 38.0% year on year, with a margin of 61.2%
— The company carries no debt: net debt of minus 354.33 million, or minus 0.43 EBITDA over the last twelve months
— Free cash flow remains high, while capital expenditure is small
— The 0.81% dividend yield is well below the key rate, and the payout is not the main argument in this story
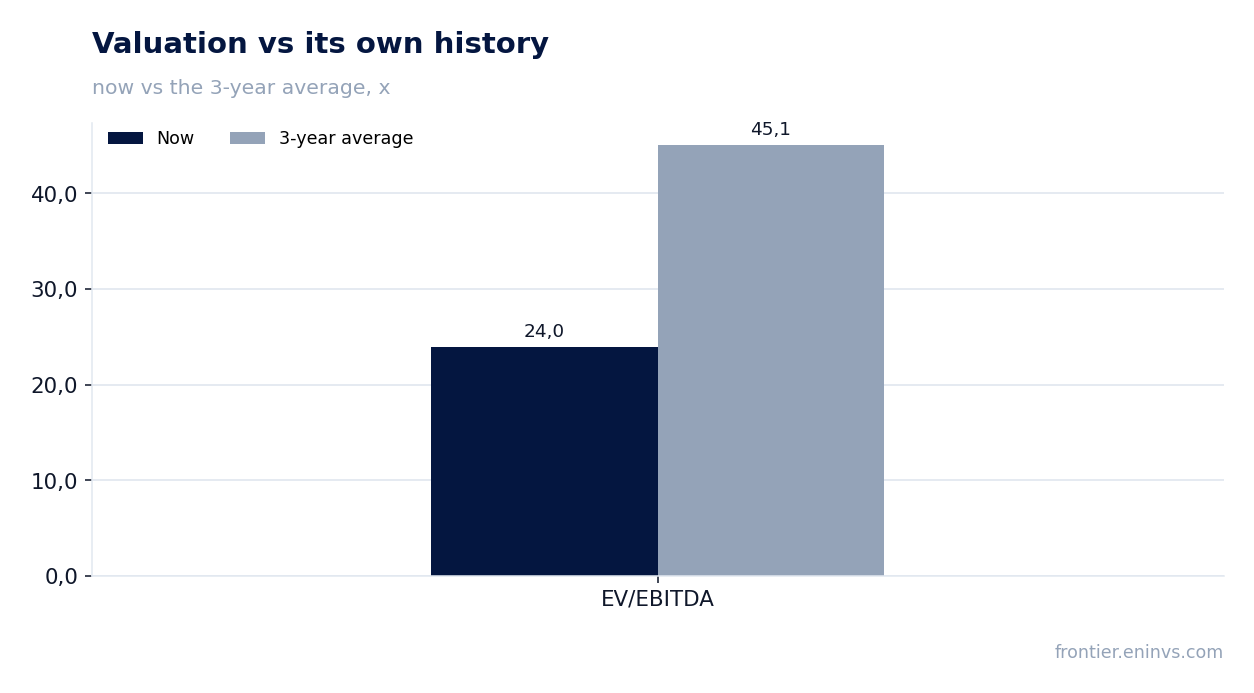
— The stock trades at an EV/EBITDA of 24.0 against its own three-year average of 45.1, i.e. cheaper than its history
Attractiveness
Key figures, USD bn
| Metric | Q3 2025 | Q3 2026 | Change |
|---|---|---|---|
| Revenue | 0.20 | 0.27 | +34.6% |
| EBITDA | 0.16 | 0.23 | +40.6% |
| Operating profit | 0.15 | 0.21 | +39.4% |
| Net profit | 0.12 | 0.17 | +38.0% |
| Operating cash flow | 0.15 | 0.19 | +24.4% |
| Capex | 0.02 | — | — |
| EBITDA margin | 80.8% | 84.4% | +3.6 pp |
| Net margin | 59.7% | 61.2% | +1.5 pp |
Revenue rose 34.6% year on year, and growth accelerated from 31.2% in the second quarter
In the third quarter of 2026, Texas Pacific Land Corporation's revenue reached 273.39 million dollars, 34.6% more than a year earlier. This is an acceleration from the second quarter, when growth was 31.2%, and the best quarterly pace in recent periods. Quarterly revenue has grown consistently: 211.58 million in the fourth quarter of 2025, 236.82 million in the first quarter of 2026, 246.06 million in the second, and 273.39 million in the third.
Over the last twelve months, revenue amounted to 967.8 million dollars. The company does not disclose in the provided facts which segment delivered the main increase, but the steady acceleration of quarterly growth suggests that demand for its services and resources remains strong. Revenue growth is accompanied by even faster profit growth, which points to operating leverage.
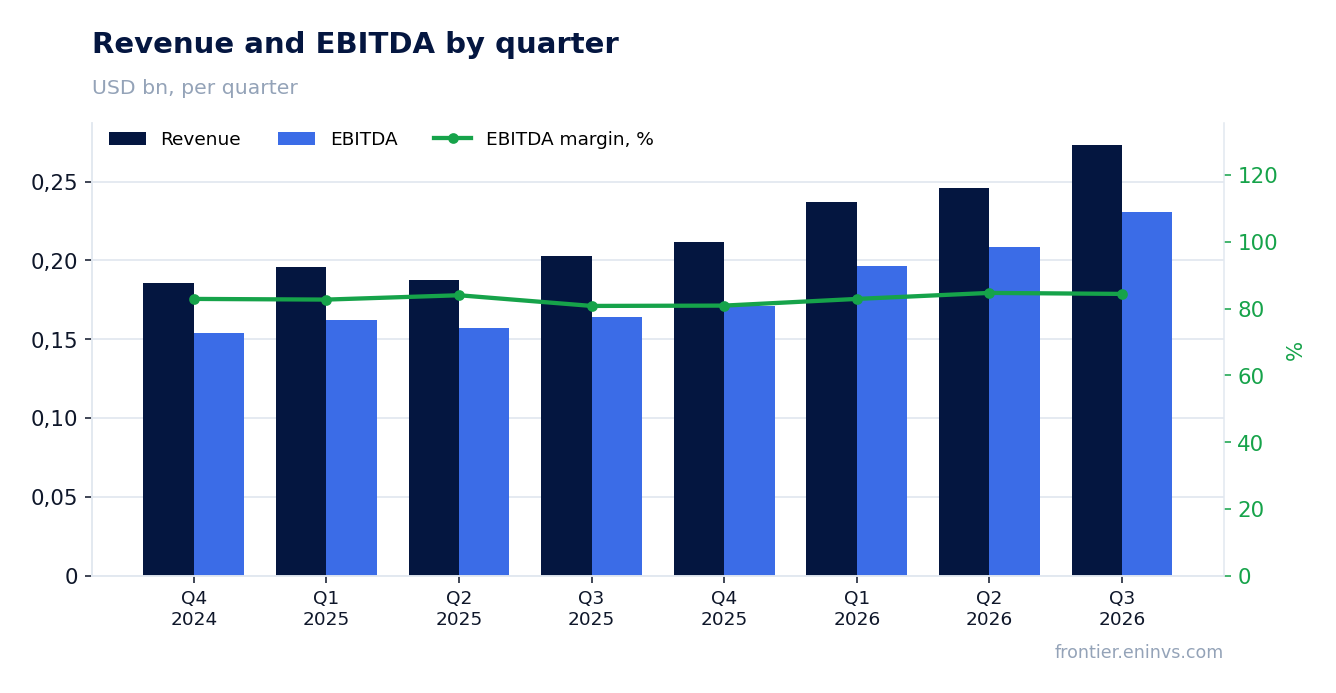
The EBITDA margin climbed to 84.4% from 80.8% a year earlier, the best level in recent quarters
EBITDA in the third quarter of 2026 was 230.62 million dollars, up 40.6% year on year. The EBITDA margin reached 84.4% against 80.8% a year earlier. Such a margin means that almost all revenue turns into operating profit: operating profit was 207.78 million dollars.
The 3.6 percentage point margin increase alongside accelerating revenue suggests the company controls costs. The provided facts do not break down expenses, so it is impossible to say which line drove the improvement. However, the combination of accelerating revenue and rising profitability is a strong signal of business quality.
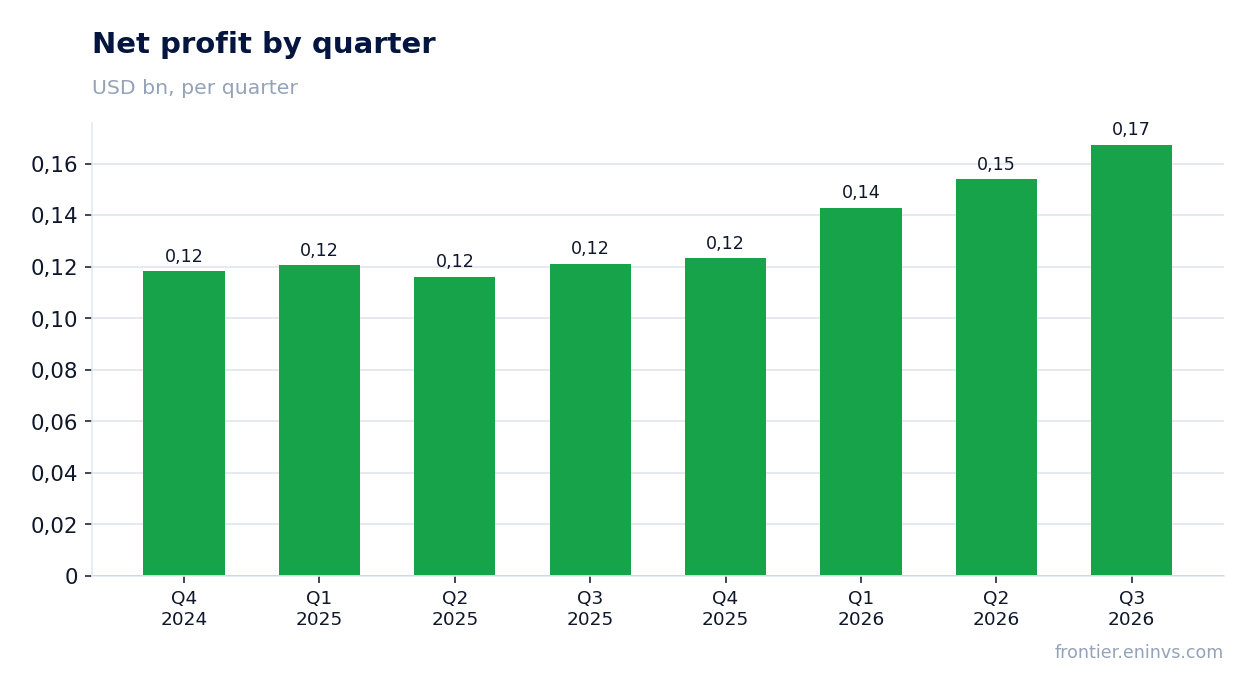
Net profit added 38.0% year on year, with a margin of 61.2%
Net profit in the third quarter of 2026 was 167.37 million dollars, 38.0% more than a year earlier. The net margin rose to 61.2% from 59.7%. Profit grows slower than EBITDA, which is explained by taxes and other items below the operating line, but the pace is still very high.
Over the last twelve months, net profit amounted to 587.5 million dollars. A margin above 60% is an exceptional figure that reflects the low capital intensity of the business. The facts contain no data on one-off items in profit, so there is no reason to consider it inflated.
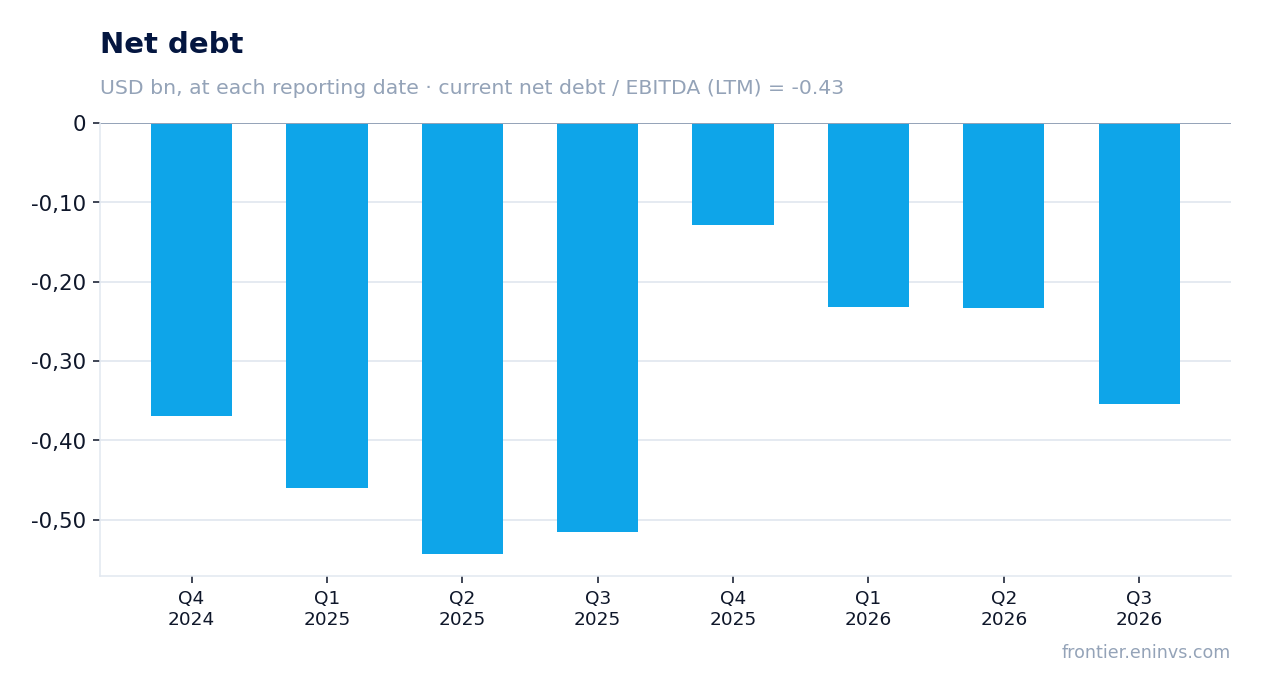
The company carries no debt: net debt of minus 354.33 million, or minus 0.43 EBITDA over the last twelve months
As of 30 September 2026, Texas Pacific Land Corporation's net debt was minus 354.33 million dollars, meaning cash exceeds debt obligations. The ratio of net debt to EBITDA over the last twelve months is minus 0.43. This is a level, not a direction: the facts contain no previous value for this ratio, so it cannot be claimed that leverage rose or fell.
From 30 June 2026, net debt changed from minus 0.2 billion dollars to minus 0.4 billion, i.e. by minus 0.1 billion. Over the year, from 30 September 2025, it changed from minus 0.5 billion to minus 0.4 billion, adding 0.2 billion. Negative net debt means the company has a liquidity cushion rather than a debt burden.
Free cash flow remains high, while capital expenditure is small
Operating cash flow in the third quarter of 2026 was 192.39 million dollars. Over the last twelve months it reached 641.0 million. Capital expenditure for the third quarter is not given in the facts, but in previous quarters it was small: 21.85 million in the second quarter of 2026 and 7.35 million in the first. With such low capital intensity, operating cash flow almost entirely converts into free cash.
High cash flow allows the company to pay dividends and build its cash cushion. Negative net debt confirms that generated funds do not go to servicing loans. In the next report, it is worth watching the dynamics of operating cash flow: it matters for assessing the sustainability of dividend payments.
The 0.81% dividend yield is well below the key rate, and the payout is not the main argument in this story
Texas Pacific Land Corporation's dividend yield over the last twelve months is 0.81%. This is a very low level that does not compare with money market yields or the key rate. The company pays dividends, but they are not the main way of returning capital to shareholders.
Our estimate of the current-year dividend is based on actual payments and profit. With net profit of 587.5 million dollars over the last twelve months and a market capitalisation of 19.69 billion dollars, a 0.81% yield corresponds to payments of about 160 million dollars a year. This is a modest share of profit, and the company has room to increase payments, but the policy is not disclosed in the facts.
For an income-oriented investor, this stock is not suitable: the 0.81% yield is below that of risk-free instruments. The main argument for the share is business growth and undervaluation on multiples, not dividends.
The stock trades at an EV/EBITDA of 24.0 against its own three-year average of 45.1, i.e. cheaper than its history
The EV/EBITDA multiple over the last twelve months is 24.0. This is 47% below its own three-year average of 45.1. On this measure, the stock trades cheaper than usual over the past three years. The P/E over the last twelve months is 33.5, which looks moderate given profit growth above 30%.
Market capitalisation is 19.69 billion dollars. On the release day, the share fell 14.0%, and from then until 4 November the price remained at that level. Such a reaction may reflect disappointment among investors who expected even stronger results, or profit-taking after a rally.
The portal's model, which reprices EBITDA at current commodity prices at the target EV/EBITDA, implies minus 49% upside to the current market capitalisation. This is our own estimate, not a consensus. It suggests that the market may be pricing in higher resource prices than current ones.
Valuation on the latest reported figures
| Metric | Value |
|---|---|
| Market cap | 19.7 bn USD |
| P/E (LTM) | 33.5 |
| EV/EBITDA (LTM) | 24.0 |
| P/B | 13.50 |
| Net debt / EBITDA (LTM) | -0.43 |
| Operating cash flow (LTM) | 0.64 bn |
| ROE | 38.5% |
| Dividend yield (12m) | 0.8% |
| EV/EBITDA, 3-year average | 45.1 |
Bottom line
The third-quarter 2026 report showed strong revenue acceleration to 34.6% and an EBITDA margin rise to 84.4%. The company remains debt-free and generates high cash flow. However, the market met these results with a 14.0% drop in the share, and the portal's model points to minus 49% upside. The EV/EBITDA of 24.0 is below its own three-year average of 45.1, making the stock cheap by historical standards, but uncertainty over commodity prices and the weak 0.81% dividend yield balance the arguments. The verdict is neutral.
Open the company's financial profile TPL →
See also: market overview · valuation map · stock screeners