Topaz Energy: revenue up 38.9% in the quarter, but 1.6x EBITDA leverage keeps valuation near its historical level
Topaz Energy reported second-quarter 2026 results. Revenue rose 38.9% year on year to $78.9 million, net profit added 22.9%, and EBITDA increased 12.5%. Growth accelerated from the first quarter, when revenue was up 9.3%. At the same time, the EBITDA margin fell to 100.3% from 123.9% a year earlier, while leverage of 1.6x EBITDA and an EV/EBITDA multiple of 14.8 versus a three-year average of 14.8 leave the stock looking fairly valued.
Key takeaways
— Second-quarter revenue rose 38.9% year on year to $78.9 million, well ahead of 9.3% in the first quarter
— EBITDA added 12.5% year on year, but its margin fell to 100.3% from 123.9% a year earlier
— Net profit grew 22.9% year on year to $37.7 million, with its margin down to 47.9% from 54.1%
— Operating cash flow for the quarter was $65.1 million, exceeding net profit
— Net debt at end-June 2026 stood at $382.2 million, or 1.6x trailing-twelve-month EBITDA
— Trailing-twelve-month dividend yield is 4.8%, above the current key rate
— EV/EBITDA of 14.8 is almost exactly the three-year average of 14.8, and the portal model implies only 1% upside
Attractiveness
Key figures, USD bn
| Metric | Q2 2025 | Q2 2026 | Change |
|---|---|---|---|
| Revenue | 0.06 | 0.08 | +38.9% |
| EBITDA | 0.07 | 0.08 | +12.5% |
| Operating profit | 0.03 | 0.05 | +81.1% |
| Net profit | 0.03 | 0.04 | +22.9% |
| Operating cash flow | 0.06 | 0.07 | +11.5% |
| EBITDA margin | 123.9% | 100.3% | -23.6 pp |
| Net margin | 54.1% | 47.9% | -6.2 pp |
Second-quarter revenue rose 38.9% year on year to $78.9 million, well ahead of 9.3% in the first quarter
Topaz Energy's second-quarter 2026 revenue was $78.9 million, up 38.9% year on year. This is an acceleration from the first quarter, when growth was 9.3%. The company does not disclose in the provided facts which segment or factor drove this jump, so we limit ourselves to stating: growth accelerated more than fourfold compared with the previous quarter.
For comparison: first-quarter 2026 revenue was $67.1 million, and second-quarter 2025 revenue was $56.8 million. Thus, sequential growth to the first quarter was about 17.6%. This indicates that the acceleration is not solely due to a low base last year.
Accelerating revenue is the main positive of the report. However, without understanding the sources of this growth (organic or one-off), it is difficult to assess its sustainability. In the next report, it is worth watching whether double-digit growth persists.
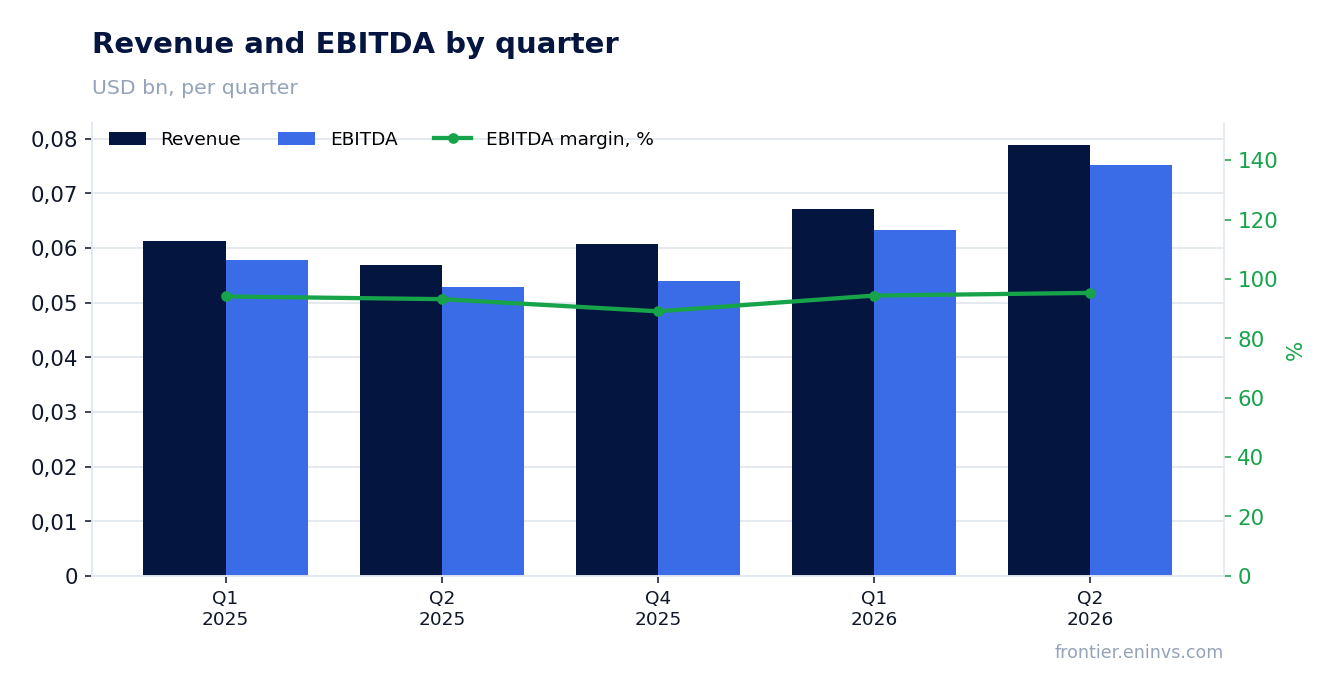
EBITDA added 12.5% year on year, but its margin fell to 100.3% from 123.9% a year earlier
Second-quarter 2026 EBITDA was $75.1 million, up 12.5% year on year. However, the EBITDA margin fell to 100.3% from 123.9% a year earlier. This means revenue growth outpaced EBITDA growth, i.e., costs rose faster than revenue.
A 23.6 percentage point margin decline is significant. It could be due to a change in revenue mix or higher operating expenses. The provided facts do not break down cost lines, so the exact cause cannot be named. Importantly, absolute EBITDA still grew, but its quality deteriorated.
Operating profit for the quarter was $50.5 million, also above last year's level. The ratio of operating profit to EBITDA shows that depreciation and other non-cash items did not change dramatically.
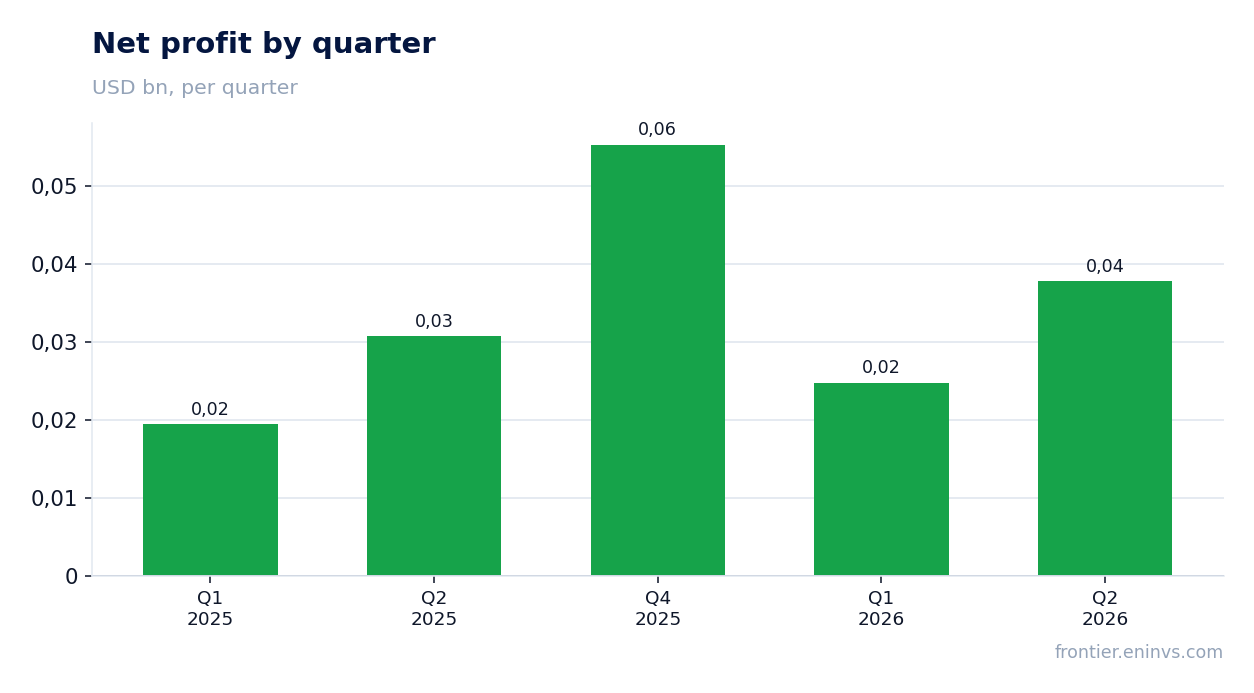
Net profit grew 22.9% year on year to $37.7 million, with its margin down to 47.9% from 54.1%
Second-quarter 2026 net profit was $37.7 million, up 22.9% year on year. The net margin fell to 47.9% from 54.1%. The margin decline is explained by faster growth in expenses, already visible at the EBITDA level.
Nevertheless, net profit is growing faster than EBITDA (22.9% vs. 12.5%), which may indicate a lower tax burden or interest expenses. The facts do not provide data on taxes and interest, so the exact cause cannot be named.
A margin of 47.9% remains high. However, the downward trend in profitability is a warning signal that requires monitoring in the coming quarters.
Operating cash flow for the quarter was $65.1 million, exceeding net profit
Second-quarter 2026 operating cash flow was $65.1 million, above net profit of $37.7 million. This is a positive signal: the company generates cash in excess of accounting profit.
Over the trailing twelve months, operating cash flow was $227.5 million. This is a substantial amount that covers capital expenditures and dividends. The facts do not provide quarterly capex data, so free cash flow cannot be assessed.
The excess of operating cash flow over net profit may be due to depreciation or changes in working capital. In any case, the ability to generate cash flow is a strong point of the report.
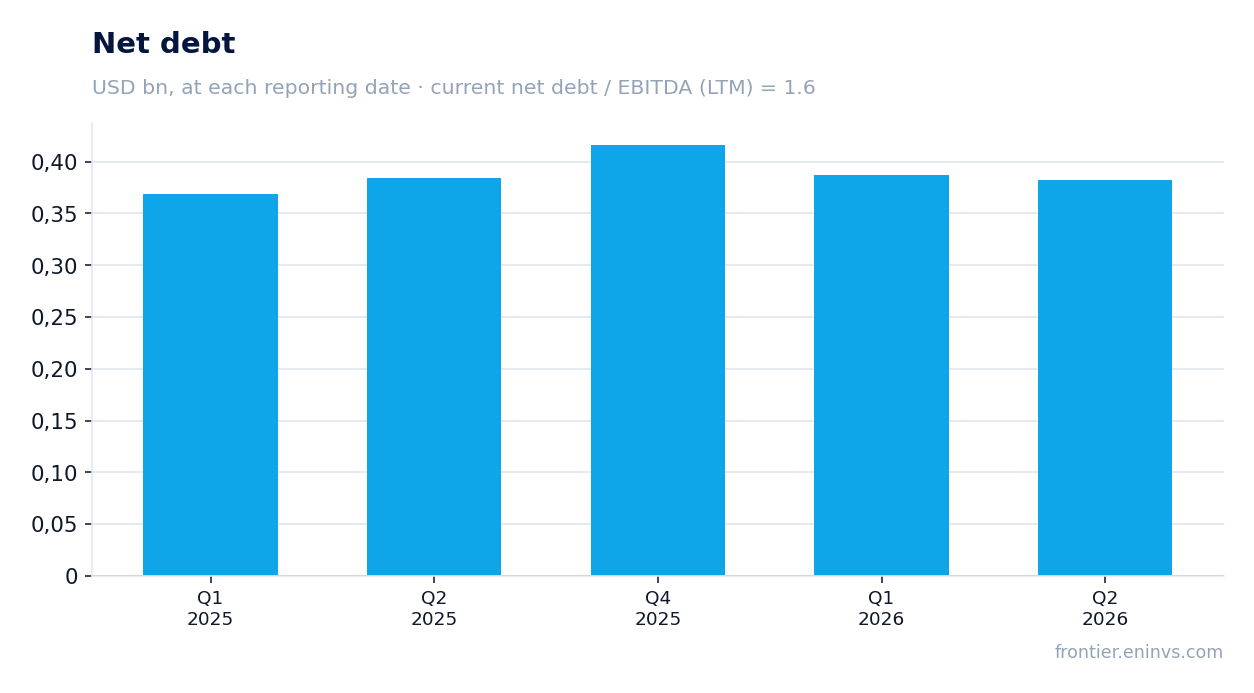
Net debt at end-June 2026 stood at $382.2 million, or 1.6x trailing-twelve-month EBITDA
Topaz Energy's net debt as of June 30, 2026, was $382.2 million. This corresponds to 1.6x trailing-twelve-month EBITDA. The leverage level is moderate but not low.
Since March 31, 2026, net debt has barely changed: $382.2 million versus $386.7 million. Over 12 months, it also remained at around $0.4 billion. This indicates stability in debt policy.
A net debt to EBITDA ratio of 1.6x is a comfortable level for most industries. However, the facts do not provide a previous value for this ratio, so it cannot be claimed that leverage has decreased or increased. Only the current level can be stated.
Trailing-twelve-month dividend yield is 4.8%, above the current key rate
Topaz Energy's trailing-twelve-month dividend yield is 4.8%. This is above the current key rate, making the stock attractive to income-oriented investors.
The facts do not provide data on specific dividend payments for the reporting period, so it cannot be said how much was paid and for which year. However, a yield of 4.8% is a level that can support interest in the stock.
The stability of dividend payments depends on profit and cash flow. Given that trailing-twelve-month operating cash flow was $227.5 million, the company has the resources to maintain dividends.
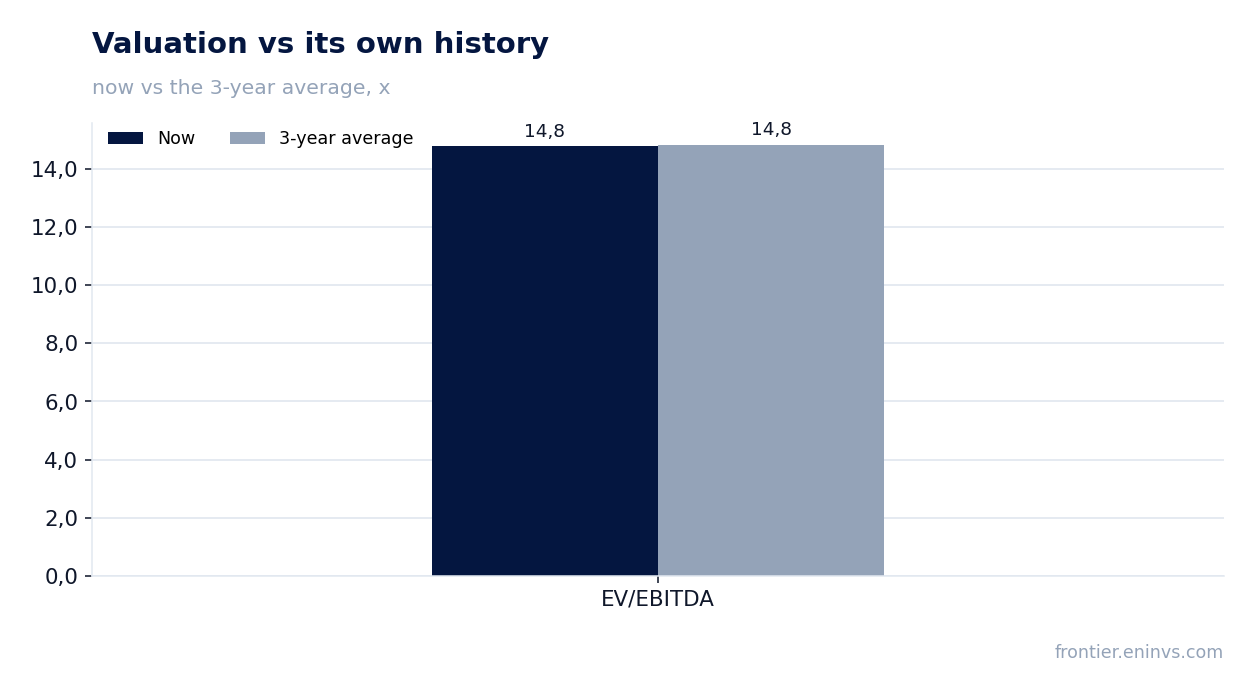
EV/EBITDA of 14.8 is almost exactly the three-year average of 14.8, and the portal model implies only 1% upside
The trailing-twelve-month EV/EBITDA multiple is 14.8. The three-year average for this multiple is also 14.8. Thus, the stock trades exactly at its historical valuation level.
According to the portal model, which re-prices EBITDA at current commodity prices at the target EV/EBITDA, the upside to fair value is +1%. This means the market already prices in current commodity prices and leaves little room for growth.
The trailing-twelve-month P/E is 31.4. This is a high level, reflecting market expectations for future growth. However, at current profit growth rates (22.9% year on year), such a multiple may be justified.
A change in valuation would require either sustained EBITDA growth, lower leverage, or higher dividends. For now, the stock looks fairly valued.
Valuation on the latest reported figures
| Metric | Value |
|---|---|
| Market cap | 3.11 bn USD |
| P/E (LTM) | 31.4 |
| EV/EBITDA (LTM) | 14.8 |
| P/B | 2.80 |
| Net debt / EBITDA (LTM) | 1.60 |
| Operating cash flow (LTM) | 0.23 bn |
| ROE | 14.1% |
| Dividend yield (12m) | 4.8% |
| EV/EBITDA, 3-year average | 14.8 |
Bottom line
Topaz Energy showed strong revenue acceleration in the second quarter of 2026 – up 38.9% year on year, well above 9.3% in the first quarter. However, growth is accompanied by declining profitability: EBITDA margin fell to 100.3% from 123.9%, and net margin to 47.9% from 54.1%. The company generates stable cash flow, and leverage of 1.6x EBITDA remains moderate. A dividend yield of 4.8% is above the key rate, supporting interest in the stock. At the same time, EV/EBITDA of 14.8 matches the three-year average, and the portal model implies only 1% upside, leaving no room for growth. The verdict is neutral: strong operating results are already priced in, and the margin decline requires monitoring.
Open the company's financial profile TPZ →
See also: market overview · valuation map · stock screeners