Topaz Energy: Q3 2026 revenue up 33.9%, but EBITDA margin compressed from 98.6% to 79.0%
Topaz Energy reported Q3 2026 results. Revenue reached $74.271 million, up 33.9% year on year, EBITDA was $58.71 million (+7.4%), and net profit was $22.794 million (+22.9%). Revenue growth decelerated from Q2 (+38.9%), while the EBITDA margin fell to 79.0% from 98.6% a year earlier. The stock trades below its own history on EV/EBITDA (13.6 vs 15.0), and the dividend yield is 4.6%. Given the margin compression and the cautious portal model estimate (upside -48%), the shares look neutral.
Key takeaways
— Q3 2026 revenue grew 33.9% year on year, but the pace decelerated from 38.9% in Q2
— EBITDA margin compressed to 79.0% from 98.6% a year earlier, even as absolute EBITDA rose 7.4%
— Net profit increased 22.9% year on year to $22.794 million, but net margin fell to 30.7% from 33.5%
— Leverage remains moderate: net debt of $350.926 million, or 1.27x LTM EBITDA
— Trailing 12-month dividend yield is 4.58%, above the current key rate
— The stock trades at EV/EBITDA of 13.6, 10% below its own 3-year average of 15.0
— The portal model's fair value implies a -48% downside to the current market price
Attractiveness
Key figures, USD bn
| Metric | Q3 2025 | Q3 2026 | Change |
|---|---|---|---|
| Revenue | 0.06 | 0.07 | +33.9% |
| EBITDA | 0.05 | 0.06 | +7.4% |
| Operating profit | 0.03 | 0.03 | +16.6% |
| Net profit | 0.02 | 0.02 | +22.9% |
| Operating cash flow | 0.06 | 0.07 | +25.6% |
| EBITDA margin | 98.6% | 79.0% | -19.6 pp |
| Net margin | 33.5% | 30.7% | -2.8 pp |
Q3 2026 revenue grew 33.9% year on year, but the pace decelerated from 38.9% in Q2
Topaz Energy's Q3 2026 revenue reached $74.271 million, up 33.9% year on year. Growth remains high, but the pace decelerated: in Q2 revenue grew 38.9% year on year. The 5 percentage point slowdown is the first signal that momentum is waning.
Among 2026 quarters, Q3 was the second-largest by revenue after the peak Q2 ($78.882 million). Sequentially, revenue declined 5.8%, which may reflect seasonality or the exhaustion of one-off factors. The company did not disclose the reasons for the sequential decline in the press release, so we limit ourselves to stating the dynamics.
The next quarter is important for assessing the sustainability of the trend: maintaining growth above 30% year on year would confirm the slowdown was temporary, while a further decline in the pace could indicate market saturation.
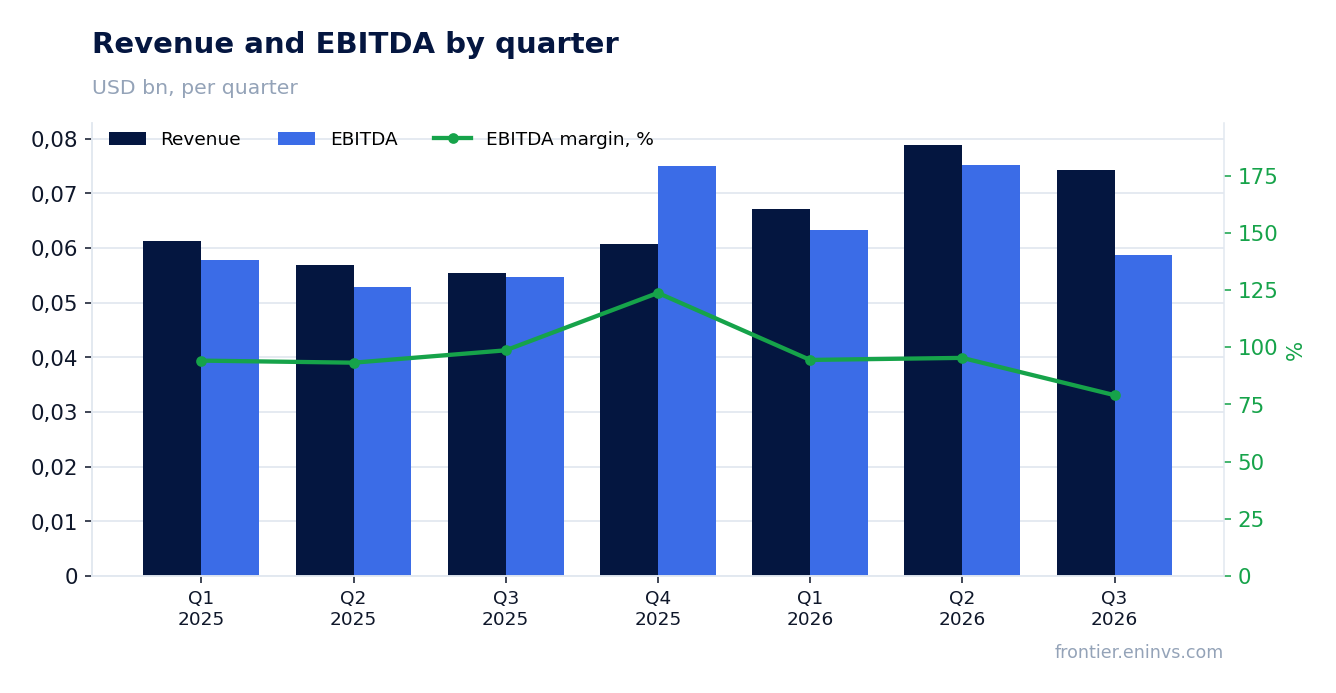
EBITDA margin compressed to 79.0% from 98.6% a year earlier, even as absolute EBITDA rose 7.4%
Q3 2026 EBITDA was $58.71 million, up 7.4% year on year. However, the EBITDA margin fell to 79.0% from 98.6% in Q3 2025. The nearly 20 percentage point compression is the most notable change in the report.
The reason for such a high base a year earlier is not disclosed in the press release. It is possible that in Q3 2025 the company received a one-off income or incurred minimal variable costs, which ensured a margin close to 100%. In the current quarter, the cost structure returned to a more normal level, leading to the margin decline.
Operating profit in Q3 2026 was $34.522 million versus $29.601 million a year earlier, up 16.6%. This means the EBITDA margin compression did not lead to a decline in operating profit – the company maintains control over depreciation and other operating expenses.
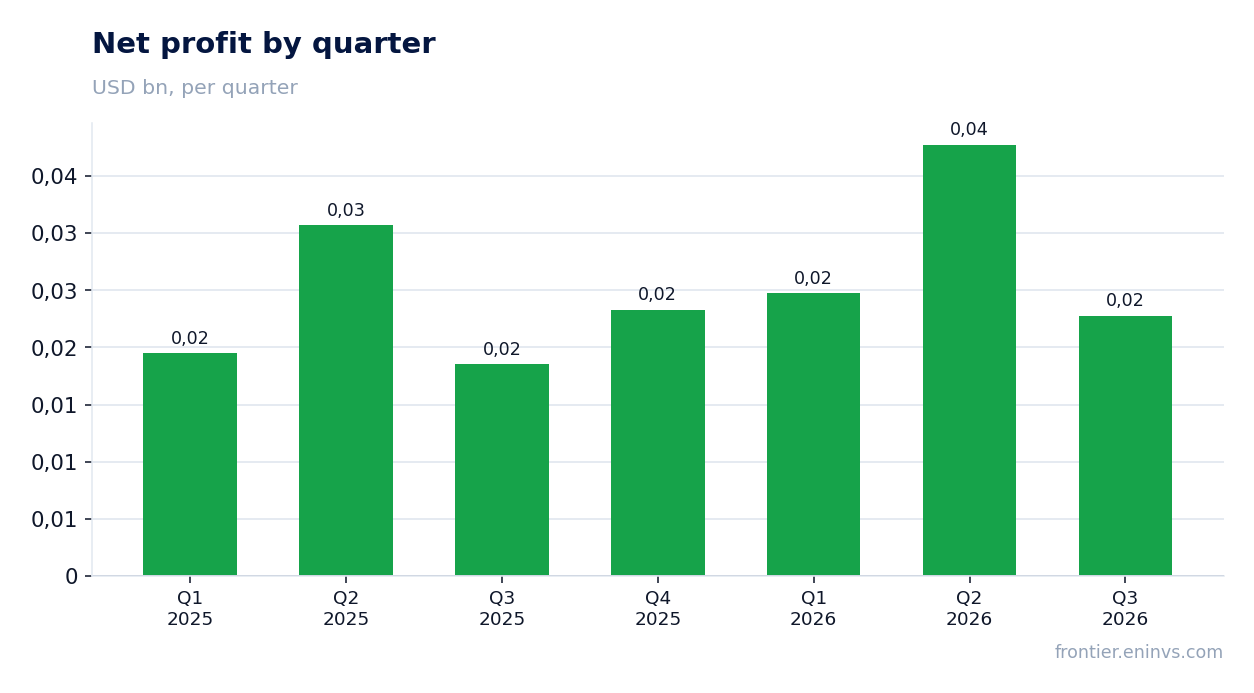
Net profit increased 22.9% year on year to $22.794 million, but net margin fell to 30.7% from 33.5%
Q3 2026 net profit was $22.794 million, up 22.9% year on year. Profit growth outpaced EBITDA growth due to lower interest expenses or other financial costs, although the exact reason is not disclosed.
Net margin fell to 30.7% from 33.5% a year earlier. The 2.8 percentage point decline is due to revenue growing faster than net profit, reflecting a higher share of costs in revenue.
Over the last 12 months, net profit was $140.6 million. This is the level the company earned over the year, and it will be used for dividend calculations and valuation multiples.
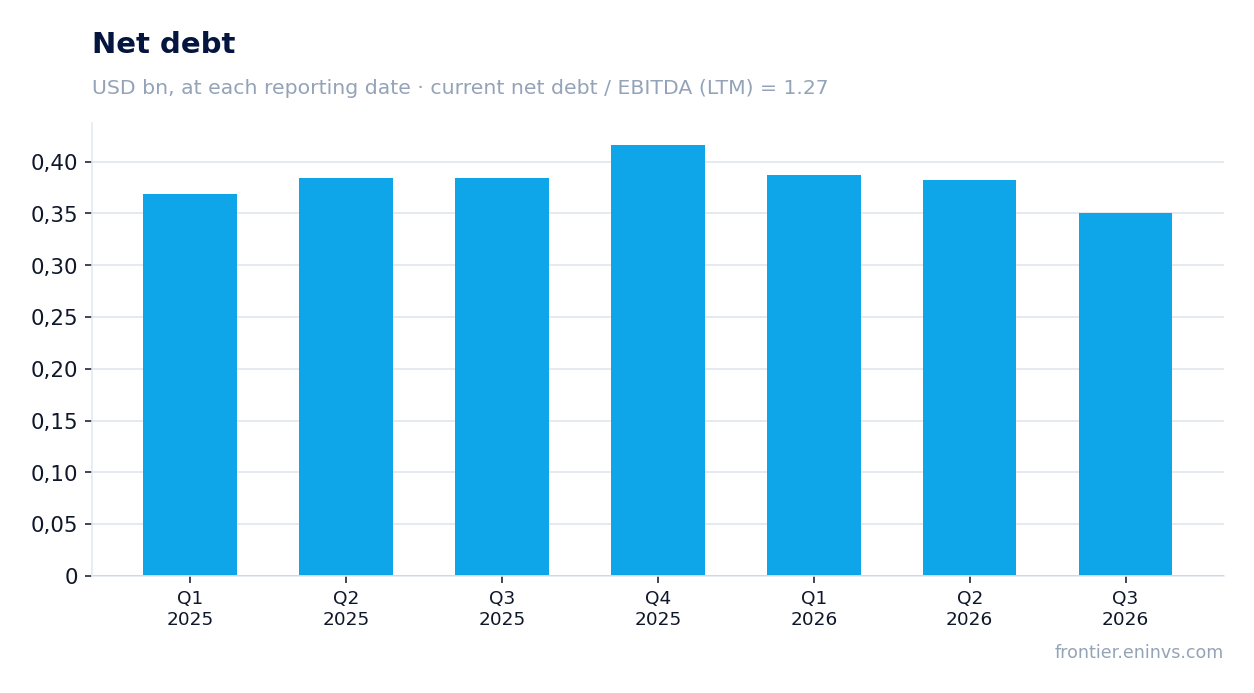
Leverage remains moderate: net debt of $350.926 million, or 1.27x LTM EBITDA
Net debt as of 30 September 2026 was $350.926 million. It decreased by $31.315 million from 30 June 2026 and by $33.344 million from 30 September 2025. The decline in debt alongside EBITDA growth brought the LTM net debt/EBITDA ratio to 1.27.
The 1.27 level is comfortable for a company with high margins. It leaves room for manoeuvre even if EBITDA declines. However, the direction of the ratio change is not disclosed, so we limit ourselves to stating the current level.
Q3 2026 operating cash flow was $71.233 million, above EBITDA for the same period. This means the company generates enough funds to service debt and pay dividends without raising new financing.
Trailing 12-month dividend yield is 4.58%, above the current key rate
Topaz Energy's trailing 12-month dividend yield is 4.58%. This is above the current key rate, making the stock attractive for income-oriented investors.
The company did not disclose in the press release the size of the last dividend paid and the year for which it was paid. However, a 4.58% yield on a market capitalisation of $3.35 billion implies annual payments of about $153 million, which is approximately 109% of LTM net profit ($140.6 million).
Our estimate for the current year's dividend assumes a payout ratio of about 100% of net profit. The sustainability of payments depends on the company's ability to maintain net profit at the achieved level. A decline in EBITDA margin could limit profit growth and, consequently, dividend payments.
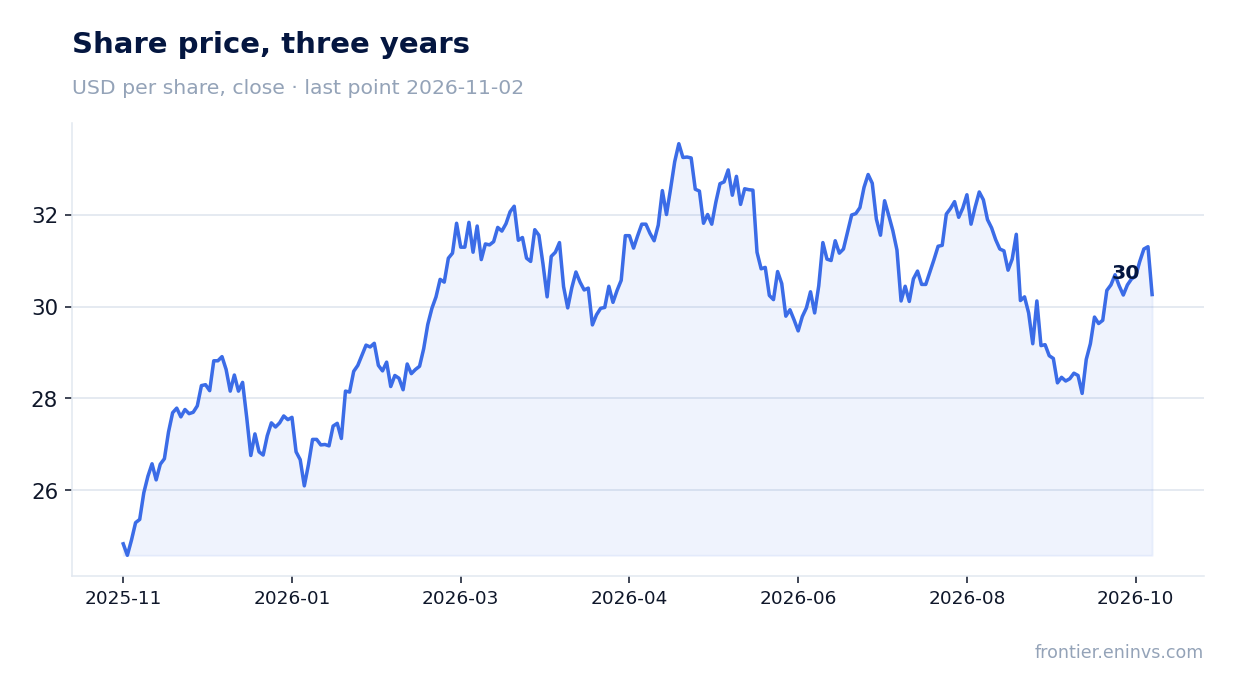
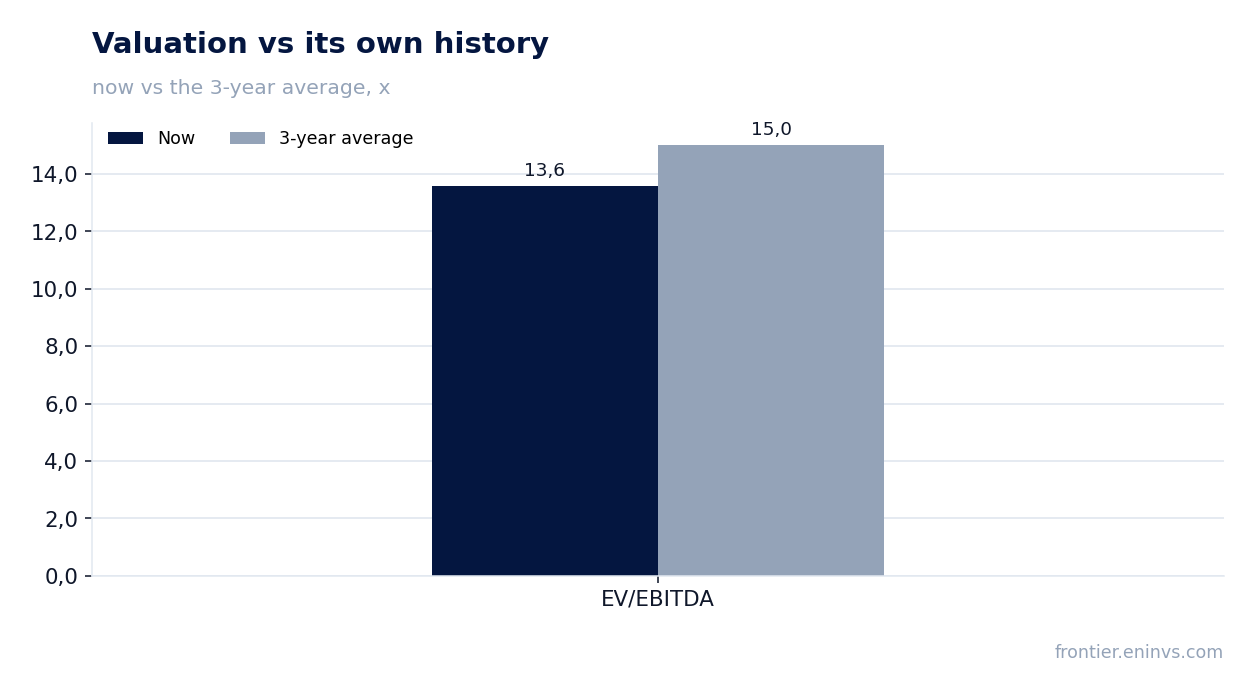
The stock trades at EV/EBITDA of 13.6, 10% below its own 3-year average of 15.0
LTM EV/EBITDA is 13.6, 10% below its own 3-year average of 15.0. This means the stock trades cheaper than usual relative to its history.
LTM P/E is 23.8, corresponding to net profit of $140.6 million and a market capitalisation of $3.35 billion. Return on equity (ROE) is 8.66%, which is low for a company with such a margin but is explained by a significant equity base.
According to the portal model, which re-prices EBITDA at current commodity prices and the target EV/EBITDA, the fair value implies a -48% downside to the current market price. This is our own estimate, not a market consensus.
The portal model's fair value implies a -48% downside to the current market price
Our model re-prices Topaz Energy's EBITDA at current commodity prices and applies a target EV/EBITDA. With the current market capitalisation of $3.35 billion and net debt of $350.926 million, this yields a fair value 48% below the current price.
Such a significant gap is explained by the market likely pricing in higher commodity prices or a more sustainable margin than our model assumes. If the company can keep its EBITDA margin above 79.0% and restore revenue growth, the valuation could be revised upward.
However, at present the model signals that the stock is overvalued relative to fundamentals. This is a key argument for the neutral verdict.
Valuation on the latest reported figures
| Metric | Value |
|---|---|
| Market cap | 3.35 bn USD |
| P/E (LTM) | 23.8 |
| EV/EBITDA (LTM) | 13.6 |
| P/B | 3.01 |
| Net debt / EBITDA (LTM) | 1.27 |
| Operating cash flow (LTM) | 0.25 bn |
| ROE | 8.7% |
| Dividend yield (12m) | 4.6% |
| EV/EBITDA, 3-year average | 15.0 |
Bottom line
Topaz Energy delivered 33.9% revenue growth and 22.9% net profit growth in Q3 2026, but the EBITDA margin compressed to 79.0% from 98.6%. Leverage remains moderate (1.27x EBITDA), and the 4.58% dividend yield is above the key rate. However, decelerating revenue growth and the cautious portal model estimate (-48% upside) balance these positives. Verdict – neutral: the stock trades below its own history on EV/EBITDA, but fundamental risks and model overvaluation prevent it from being called attractive.
Open the company's financial profile TPZ →
See also: market overview · valuation map · stock screeners