TORM: profit nearly sextupled, but the multiple is already above its own history
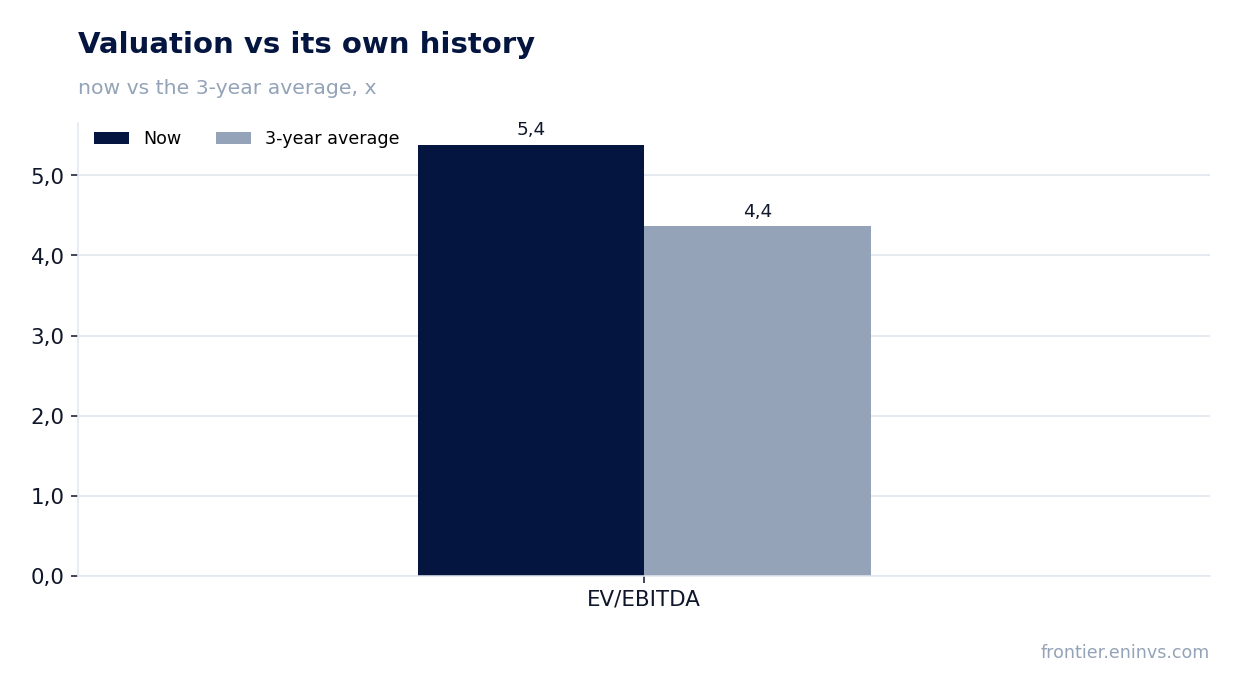
TORM's Q2 2026 results showed revenue of $662.8m – up 110.3% year on year – EBITDA of $417.8m and net profit of $338.3m. The EBITDA margin reached 63.0% versus 41.3% a year earlier, and the net margin 51.0% versus 18.6%. Yet the share trades at EV/EBITDA LTM 5.4 against its own three-year average of 4.4, 23% above its history, and with a dividend yield of 10.6% the valuation looks neutral: the strong report is already in the price.
Key takeaways
— Q2 revenue rose 110.3% year on year to $662.8m, more than double the first quarter
— EBITDA grew 220.6% year on year and the margin rose to 63.0% from 41.3% – profit growth outpaced revenue growth
— Net profit rose 477.3% year on year to $338.3m, with a net margin of 51.0% versus 18.6%
— Leverage of 0.75x EBITDA LTM is comfortable, and net debt fell from $0.9bn on 31 March to $0.7bn on 30 June
— A trailing dividend yield of 10.6% remains the main support for a holder
— EV/EBITDA LTM of 5.4 versus a three-year average of 4.4 – the share is 23% above its own history
Attractiveness
Key figures, USD bn
| Metric | Q2 2025 | Q2 2026 | Change |
|---|---|---|---|
| Revenue | 0.32 | 0.66 | +110.3% |
| EBITDA | 0.13 | 0.42 | +220.6% |
| Operating profit | 0.07 | 0.36 | +413.2% |
| Net profit | 0.06 | 0.34 | +477.3% |
| Operating cash flow | 0.16 | 0.32 | +98.1% |
| EBITDA margin | 41.3% | 63.0% | +21.7 pp |
| Net margin | 18.6% | 51.0% | +32.4 pp |
Q2 revenue rose 110.3% year on year to $662.8m, more than double the first quarter
TORM's Q2 2026 revenue was $662.8m, up 110.3% year on year. For comparison, first-quarter revenue was $402.0m, so the second quarter was 1.6 times larger. That step up stands out sharply against the previous four quarters, when revenue stayed in the $315–403m range.
The acceleration is visible in profit too: EBITDA grew 220.6% year on year and net profit 477.3%. That means revenue growth was accompanied by disproportionately larger profit growth, so the business's margin was substantially higher this quarter than a year earlier.
Over the trailing twelve months revenue was $1,800.0m, and the second quarter alone contributed more than a third of that. Such a contribution from one quarter shows that current dynamics differ markedly from the annual average, and it is these dynamics that drive the year-on-year comparison.
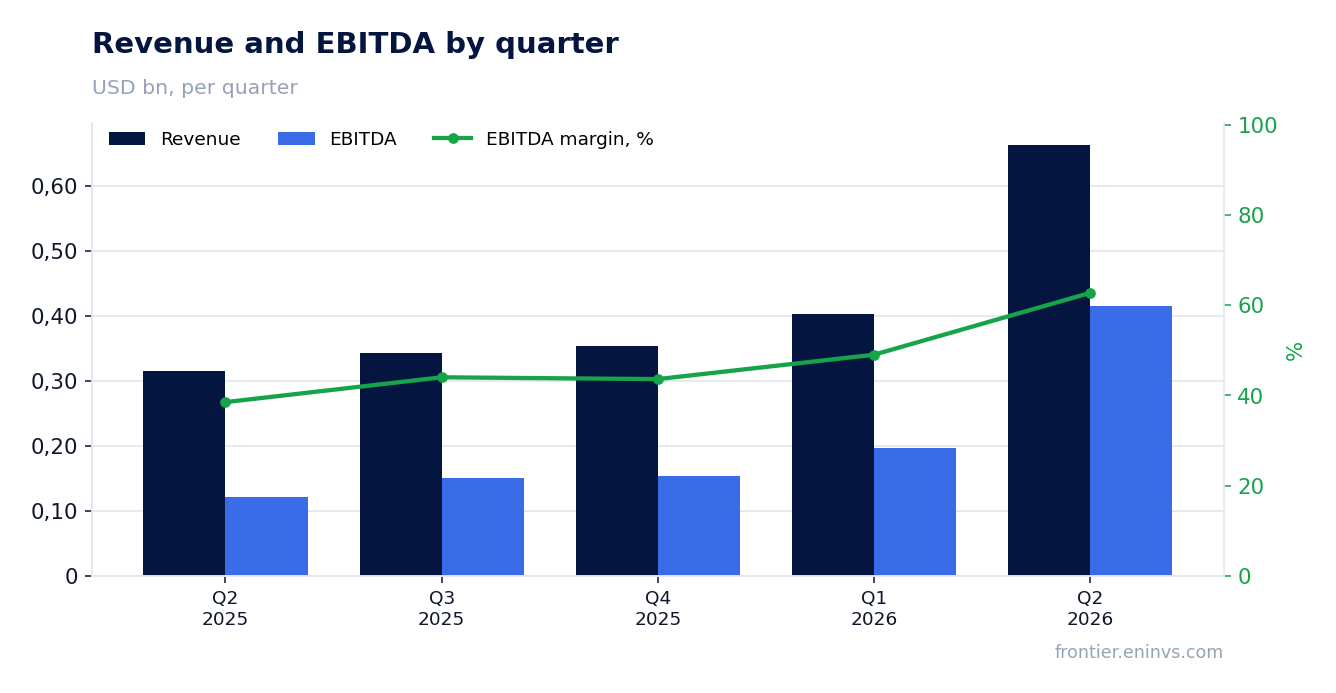
EBITDA grew 220.6% year on year and the margin rose to 63.0% from 41.3% – profit growth outpaced revenue growth
Q2 2026 EBITDA was $417.8m, up 220.6% year on year. The EBITDA margin reached 63.0% versus 41.3% a year earlier – a rise of 21.7 percentage points. This is the key change in the report: profitability at the EBITDA level grew faster than revenue.
Operating profit was $355.1m, also well above the prior-year level of $69.2m. The gap between EBITDA and operating profit is small, which suggests depreciation does not absorb a significant part of the result.
A 21.7 pp margin increase on more than doubled revenue means the company did not just grow volumes but earned a higher return on every dollar of revenue. The facts do not disclose the cause of this shift, but the scale of the change makes it the main event of the quarter.
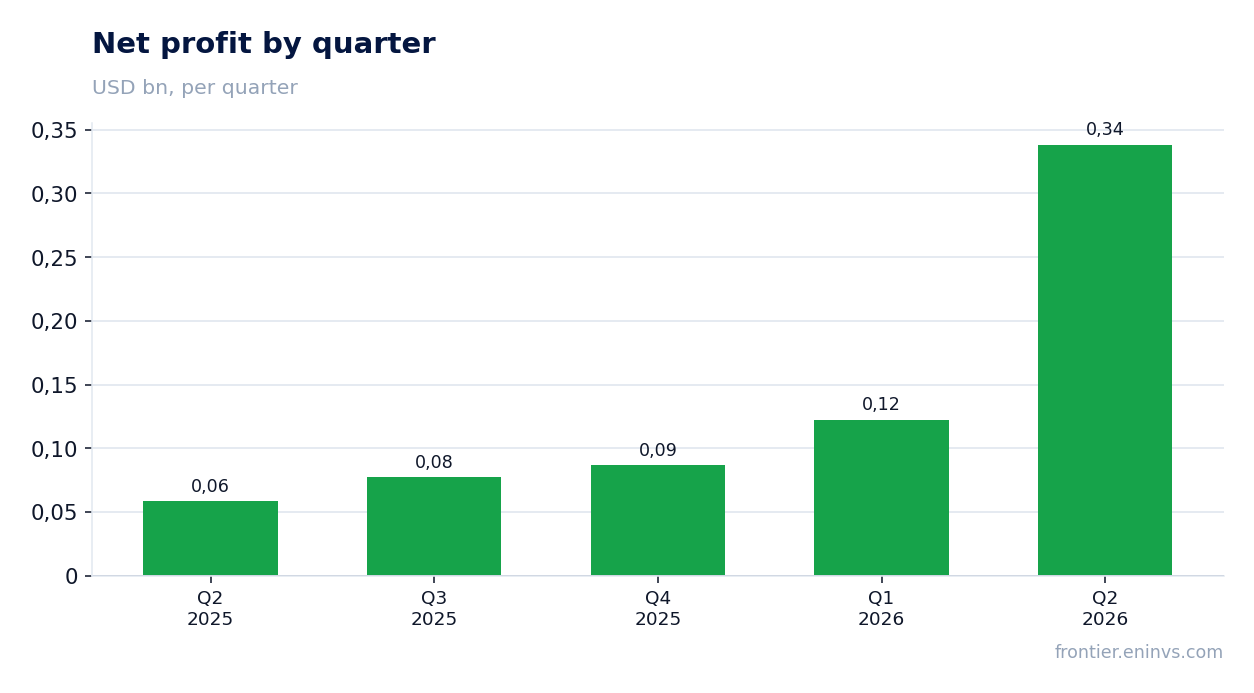
Net profit rose 477.3% year on year to $338.3m, with a net margin of 51.0% versus 18.6%
Q2 2026 net profit was $338.3m, up 477.3% year on year. The net margin reached 51.0% versus 18.6% a year earlier. That means more than half of revenue turned into net profit, an exceptionally high figure for a shipping company.
Over the trailing twelve months net profit was $625.1m. The second quarter alone contributed more than half of that, underscoring its decisive role in the annual result. Quarterly profit is more than double the profit for the whole of the previous year combined.
Return on equity (ROE) stands at 56.1%, a very high level reflecting both strong profit and a relatively small capital base. Such an ROE is sensitive to any decline in profit, so the sustainability of the quarterly result is of primary importance.
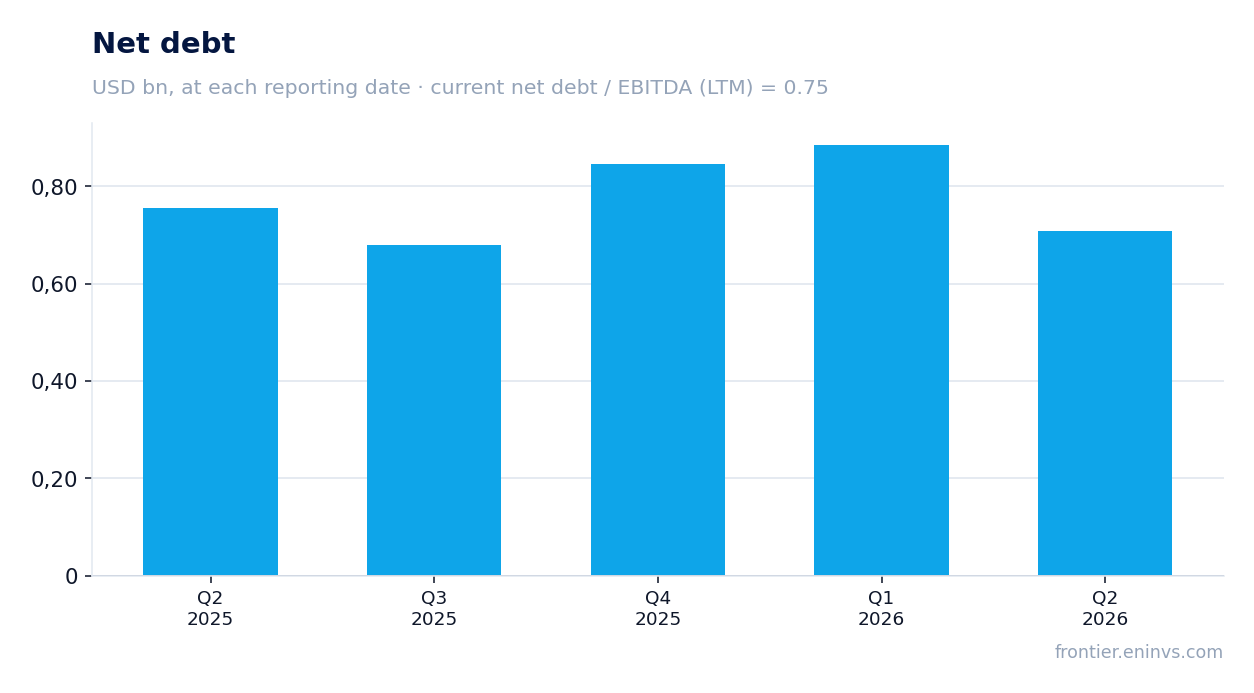
Leverage of 0.75x EBITDA LTM is comfortable, and net debt fell from $0.9bn on 31 March to $0.7bn on 30 June
Net debt at 30 June 2026 was $708.0m, or $0.7bn. The ratio of net debt to trailing-twelve-month EBITDA is 0.75, a low and comfortable level for a shipping company. Such headroom allows the company to withstand market fluctuations without threatening financial stability.
Compared with 31 March 2026, net debt fell from $0.9bn to $0.7bn. Over twelve months, from 30 June 2025, the change was $0.0bn – debt stayed at $0.7bn. The quarterly decline came against strong operating cash flow of $319.5m.
Operating cash flow for the quarter was $319.5m, almost matching net profit. That means profit is backed by real cash rather than accounting accruals. Over the trailing twelve months operating cash flow was $709.9m, further confirming the business's ability to generate cash.
A trailing dividend yield of 10.6% remains the main support for a holder
The trailing twelve-month dividend yield is 10.6%. That is a high level and provides a substantial part of the share's total return. With trailing-twelve-month net profit of $625.1m and a market capitalisation of $4,226.6m, the dividend payout looks covered.
Our estimate of the current-year dividend assumes the payout ratio and profit remain at the trailing-twelve-month level. However, quarterly profit of $338.3m is well above average, and if it proves one-off the dividend base could narrow. The key factor for the payout remains the sustainability of profit rather than one-off items.
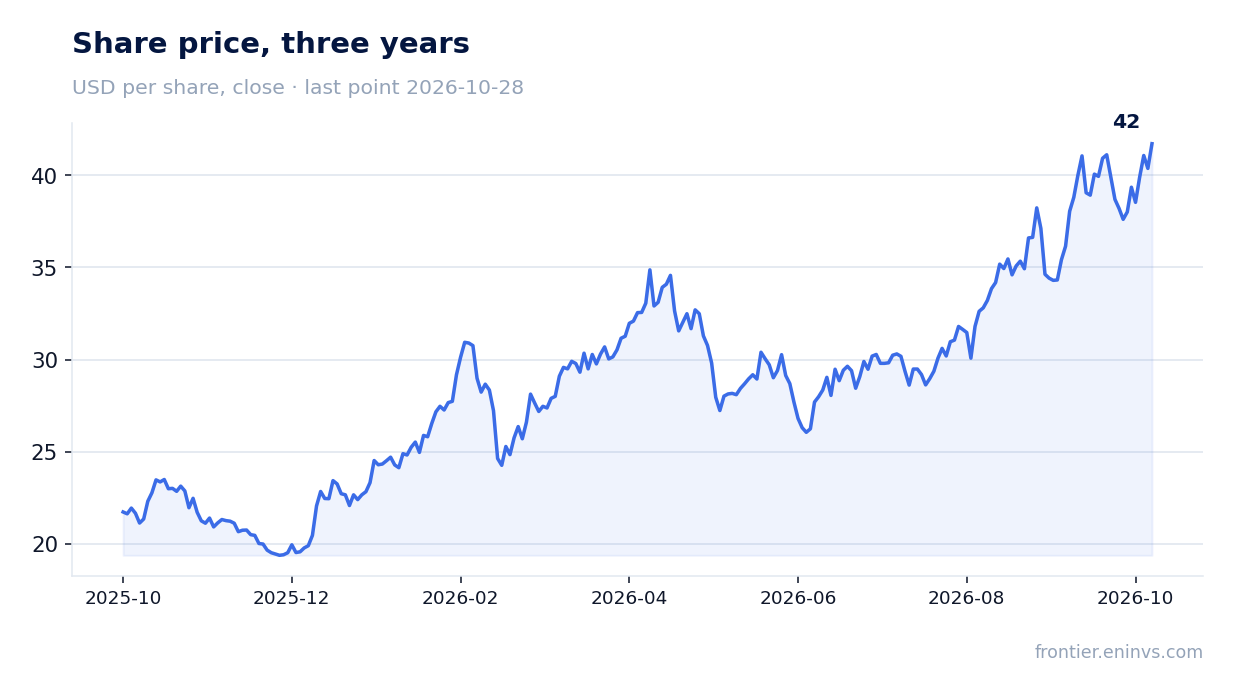
A yield of 10.6% is well above the risk-free rate, making the share attractive to income-oriented investors. Yet with EV/EBITDA above its historical average, the market already prices in a high level of dividends, and any decline in profit could trigger a re-rating.
EV/EBITDA LTM of 5.4 versus a three-year average of 4.4 – the share is 23% above its own history
EV/EBITDA for the trailing twelve months is 5.4 versus a three-year average of 4.4. That means the share trades 23% above its own history on this multiple. P/E LTM is 6.8, also indicating a low valuation of earnings, but relative to history the multiple is already above average.
The rise in the multiple is explained by profit and EBITDA growing faster than the share price. Yet the market has already priced in the strong quarter, and further multiple expansion requires confirmation that profit is sustainable. If profit returns to the levels of previous quarters, the multiple will look stretched.
Comparison with its own history shows the current valuation is not cheap. Further capitalisation growth requires either sustained profit growth or lower rates, and the facts provide no basis for either. The valuation therefore looks balanced, with no obvious cushion.
Valuation on the latest reported figures
| Metric | Value |
|---|---|
| Market cap | 4.23 bn USD |
| P/E (LTM) | 6.8 |
| EV/EBITDA (LTM) | 5.4 |
| P/B | 1.92 |
| Net debt / EBITDA (LTM) | 0.75 |
| Operating cash flow (LTM) | 0.71 bn |
| ROE | 56.1% |
| Dividend yield (12m) | 10.6% |
| EV/EBITDA, 3-year average | 4.4 |
Bottom line
TORM's Q2 2026 report is exceptionally strong: revenue rose 110.3%, EBITDA 220.6%, net profit 477.3%, and the EBITDA margin reached 63.0%. Yet the result looks one-off: quarterly profit is more than double the profit for the whole of the previous year. Leverage is low, a 10.6% dividend yield supports the share, but EV/EBITDA of 5.4 against a historical 4.4 shows the market has already priced in the strong results. The verdict is neutral: the share is fairly valued, but with no margin for error.
Open the company's financial profile TRMD →
See also: market overview · valuation map · stock screeners