Tronox Holdings: TiO2 benchmark up 9.2%, but revenue beat the price only on volumes while debt stays at 19.9x EBITDA
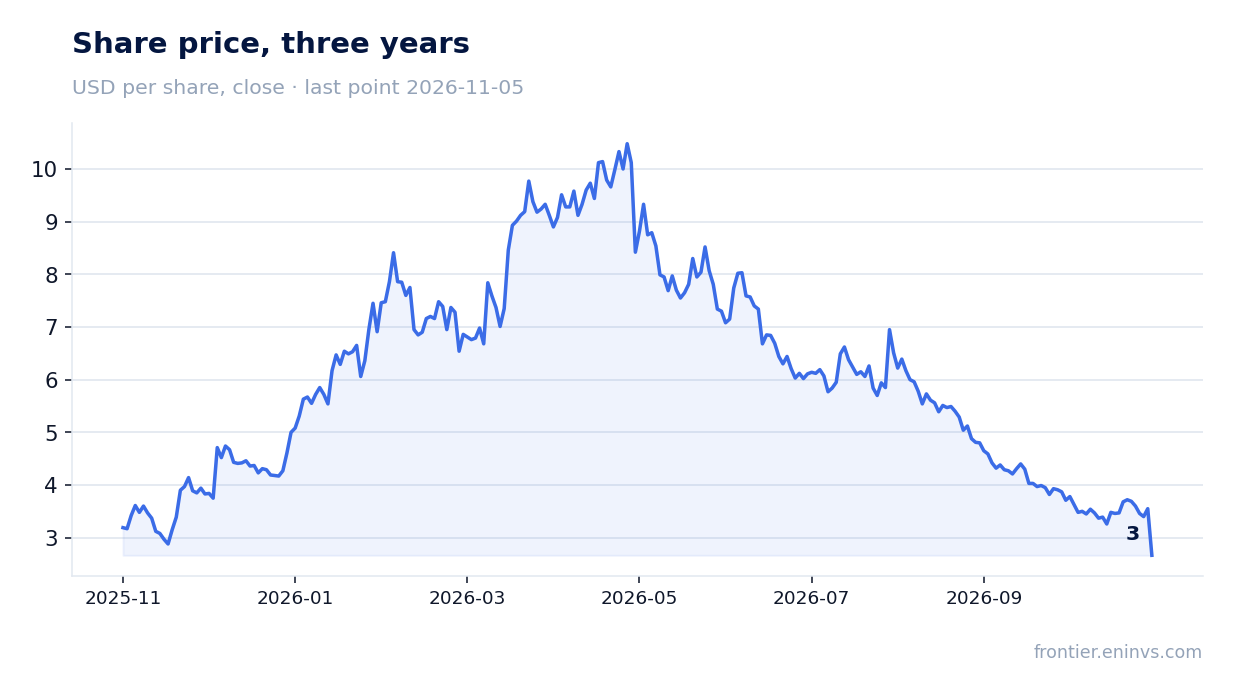
On 5 November Tronox Holdings reported third-quarter 2026 results. The average titanium dioxide price in the period was 14,903 USDCNY against 13,647 a year earlier (+9.2%), while spot is now 13,960, 6.3% below the quarterly average. Revenue reached $827 million (+18.3% YoY), EBITDA $88 million and net loss $55 million. At year-ago volumes and costs, our calculation implies prices should have produced $76.4 million of EBITDA, so the company earned $11.6 million more – the gap came from volumes and a realised price above the benchmark. The share fell 24.9% after the release, and with EV/EBITDA LTM at 22.5 and debt at 19.9x EBITDA the stock looks unattractive.
Key takeaways
— TiO2 price rose 9.2% YoY, but spot is already 6.3% below the quarterly average
— At year-ago prices our calculation implies $76.4 million of EBITDA; the company earned $88 million – volumes and realised price made the difference
— Revenue grew 18.3% at roughly the same pace as the prior quarter, carried by TiO2 and zircon volumes
— EBITDA margin rose to 10.6% from 4.6% on realised pricing, but production and freight costs increased
— Free cash flow for the quarter was $5 million on capital expenditure of $57 million
— Debt at 19.9x EBITDA and EV/EBITDA LTM of 22.5 leave no margin of safety at current prices
— The 7.7% dividend yield rests on payouts not covered by profit
Attractiveness
Key figures, USD bn
| Metric | Q3 2025 | Q3 2026 | Change |
|---|---|---|---|
| Revenue | 0.70 | 0.83 | +18.3% |
| EBITDA | 0.03 | 0.09 | +175.0% |
| Operating profit | -0.04 | 0.01 | to profit |
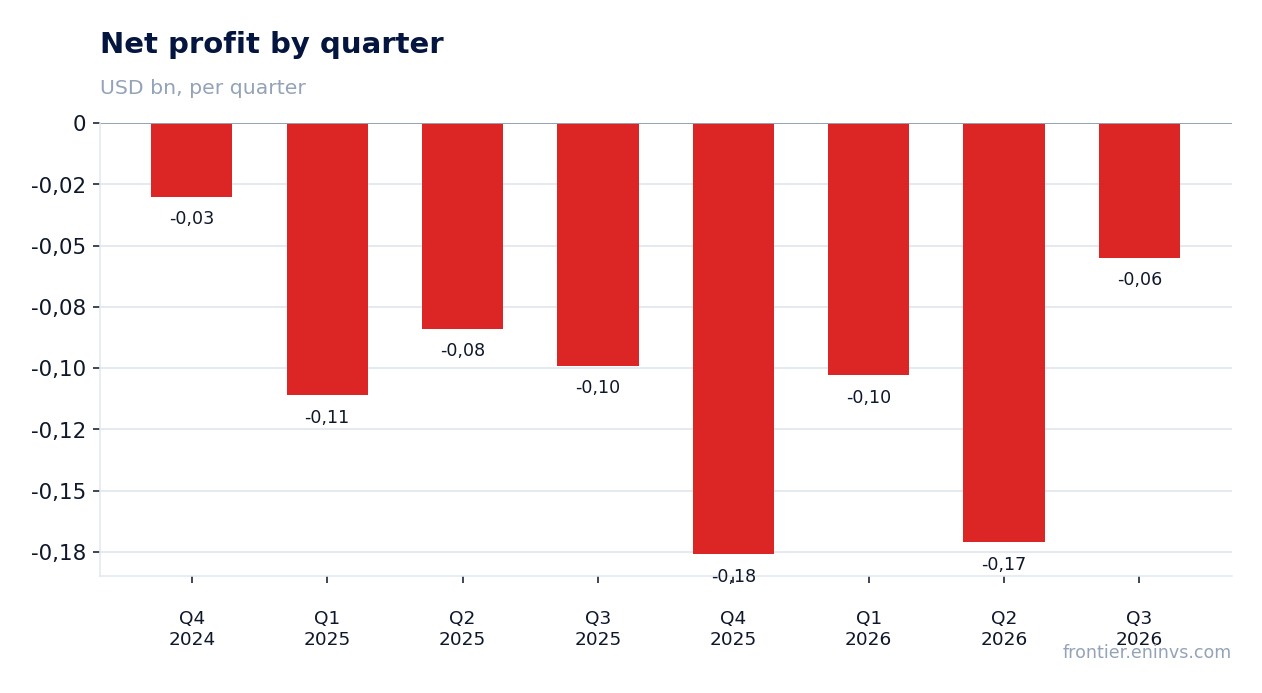
| Net profit | -0.10 | -0.06 | — |
| Operating cash flow | -0.06 | 0.06 | to profit |
| Capex | 0.08 | 0.06 | -28.7% |
| EBITDA margin | 4.6% | 10.6% | +6.0 pp |
| Net margin | -14.2% | -6.7% | +7.5 pp |
TiO2 price rose 9.2% YoY, but spot is already 6.3% below the quarterly average
The average titanium dioxide price in Q3 2026 was 14,903 USDCNY against 13,647 a year earlier – up 9.2%. Sequentially the price fell 10.9%: 16,734 USDCNY in Q2 versus 14,903 in the reported quarter. Spot on 6 November is 13,960, 6.3% below the quarterly average.
For a producer this means the favourable pricing of the quarter is already reversing. The company sells on contracts, so realised prices lag spot, but the next quarter will be measured from a lower base. Management expects Q3 pricing gains to be sustained in Q4, yet spot does not confirm that.
Input costs moved in opposite directions: Henry Hub fell 6.2% YoY to $2.893, while electricity rose 63.3% to $102.8. Power is a material line for chlor-alkali electrolysis, and its rise partly offset the pricing gain.
Commodity prices: period average and now
| Benchmark | Year ago | Q3 2026 | YoY | Spot 2026-11-06 |
|---|---|---|---|---|
| Titanium Dioxide, USDCNY | 13 647 | 14 903 | +9,2% | 13 960 |
| Henry Hub (input cost), USD | 3,08 | 2,89 | -6,2% | 2,99 |
| Electricity Spot (input cost), USD | 62,9 | 102,8 | +63,3% | 63,9 |
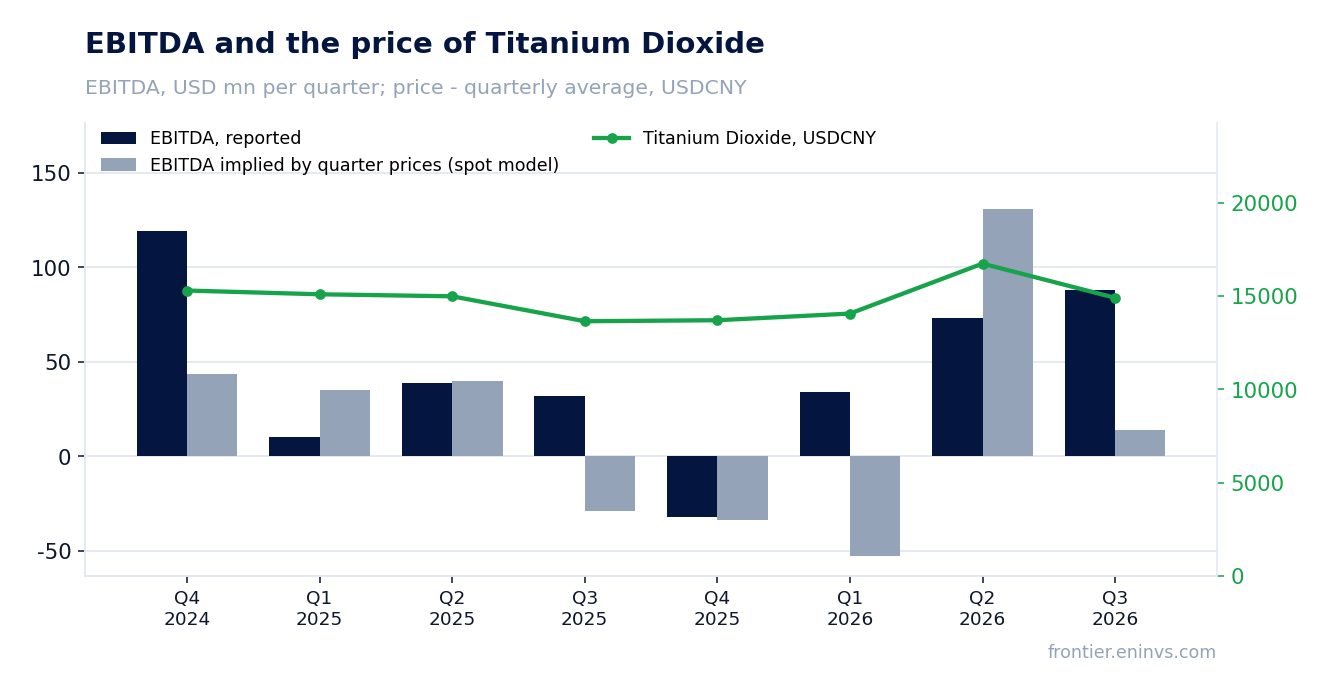
At year-ago prices our calculation implies $76.4 million of EBITDA; the company earned $88 million – volumes and realised price made the difference
At Q3 2025 volumes and non-commodity costs, moving only commodity prices, our calculation gives revenue of $763.4 million and EBITDA of $76.4 million. The company actually reported $827 million of revenue and $88 million of EBITDA – $63.6 million and $11.6 million above the calculation.
The gap is explained by volumes and realised price. The release states TiO2 sales volumes rose 10% and average selling prices including mix rose 9%; zircon volumes rose 49% and prices 9%. The company sold more than a year earlier and at a price above the benchmark.
Sequentially the picture reverses: at Q2 volumes and costs our calculation implies $773.1 million of revenue and negative $39 million of EBITDA, while the actual $827 million and $88 million are $53.9 million and $127 million higher. Here the gap came from a higher realised price and zircon volumes after the Namakwa furnace and West Mine ramp-up.
The portal's spot model, re-priced from the average of the previous four quarters, expected $13.7 million of EBITDA and $786 million of revenue. The actual $88 million and $827 million beat the model, but the deviation in the four prior periods was -44.1% – the model handles one-off quarters poorly.
What the prices implied and what the company earned
| Base (Q3 2025) | Implied at period prices | Reported | Reported vs implied | |
|---|---|---|---|---|
| Revenue, USD mn | 699,0 | 763,4 | 827,0 | +8,3% |
| EBITDA, USD mn | 32,0 | 76,4 | 88,0 | +15,2% |
| EBITDA, portal spot model, USD mn | — | 13,7 | 88,0 | — |
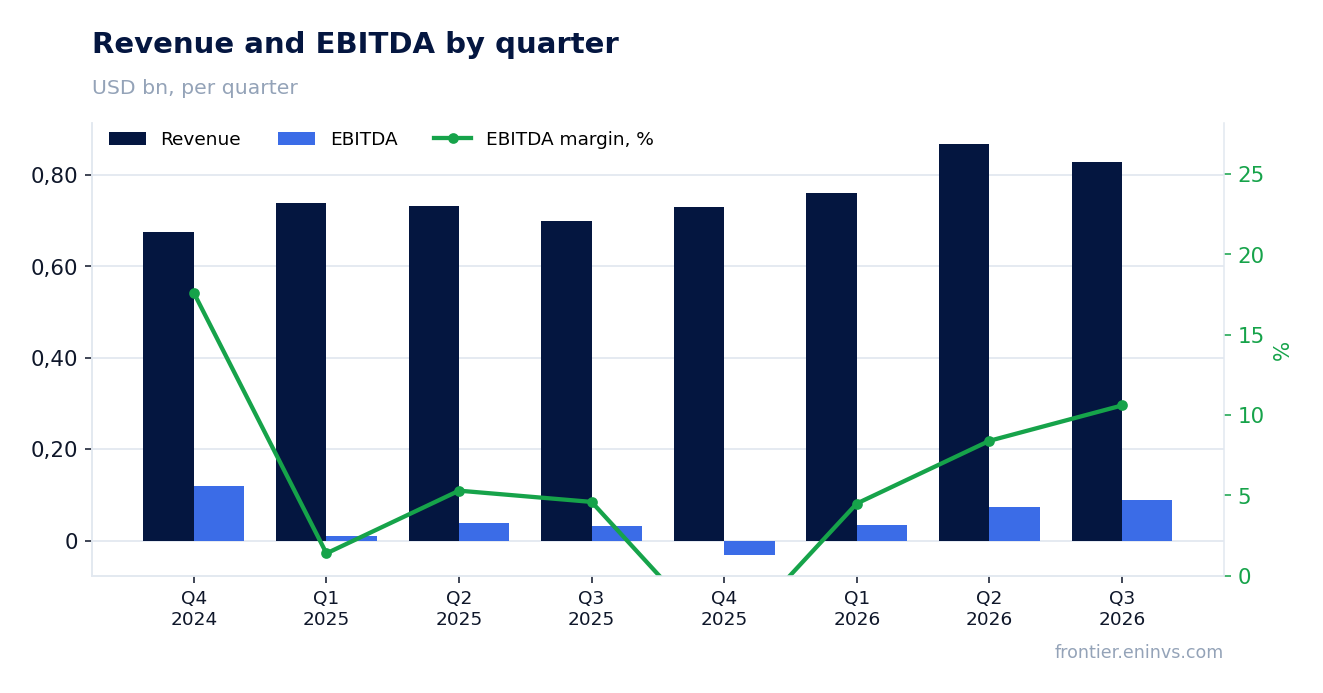
Revenue grew 18.3% at roughly the same pace as the prior quarter, carried by TiO2 and zircon volumes
Q3 revenue was $827 million, up 18.3% YoY. The pace was roughly the same as in Q2, when growth was 18.7%. Sequentially revenue fell 5%: $868 million in Q2 versus $827 million in the reported quarter.
TiO2 revenue was $653 million (+19% YoY), zircon $93 million (+58%) and other products $81 million (-10%). Zircon growth came mainly from volume: sales rose 49% while price rose 9%. That is the result of the Namakwa furnace and West Mine ramp-up management cites.
Sequentially TiO2 fell 7% on an 11% volume decline with a 4% price increase. Zircon fell 4%: volumes down 13%, price up 9%. Other products rose 14% on volumes.
For Q4 the company expects TiO2 volumes to decline sequentially in the high-single to low-double-digit range, mainly on seasonality and weaker demand in Europe and Asia Pacific. Zircon volumes will soften moderately on inventory availability.
EBITDA margin rose to 10.6% from 4.6% on realised pricing, but production and freight costs increased
Q3 EBITDA was $88 million, up 175% YoY. The EBITDA margin was 10.6% against 4.6% a year earlier. The release attributes the increase to higher average selling prices including mix, partly offset by unfavourable FX, higher production costs and higher freight costs.
Operating profit turned positive for the first time in several quarters – $12 million against negative $43 million a year earlier. Depreciation was $76 million, and that is what turns operating profit into EBITDA. Interest, FX and other items below operating income are outside EBITDA and explain the net loss.
The net loss was $55 million against $99 million a year earlier. Interest expense rose to $56 million from $48 million, a heavy burden on $3.2 billion of debt. The net margin improved to -6.7% from -14.2% but remains negative.
One-off items in the quarter were small: $1 million of other items against $2 million a year earlier. Over nine months the company booked $18 million of restructuring, a $20 million gain on the sale of Fuzhou and a $103 million tax valuation allowance. These sit outside EBITDA, except restructuring, which was zero in the reported quarter.
Free cash flow for the quarter was $5 million on capital expenditure of $57 million
Operating cash flow for the quarter was $62 million, capital expenditure $57 million and free cash flow $5 million. Over nine months operating cash flow was $99 million, capex $169 million and free cash flow negative $70 million. The company is cutting planned 2026 capex by $30 million.
The quarterly free cash flow was supported by inventory release: inventories fell $214 million over nine months. That is a one-off release, not sustainable generation. For Q4 the company expects free cash flow of $20–45 million, but a full-year use of $25–50 million on higher raw material prices and weaker sales volumes.
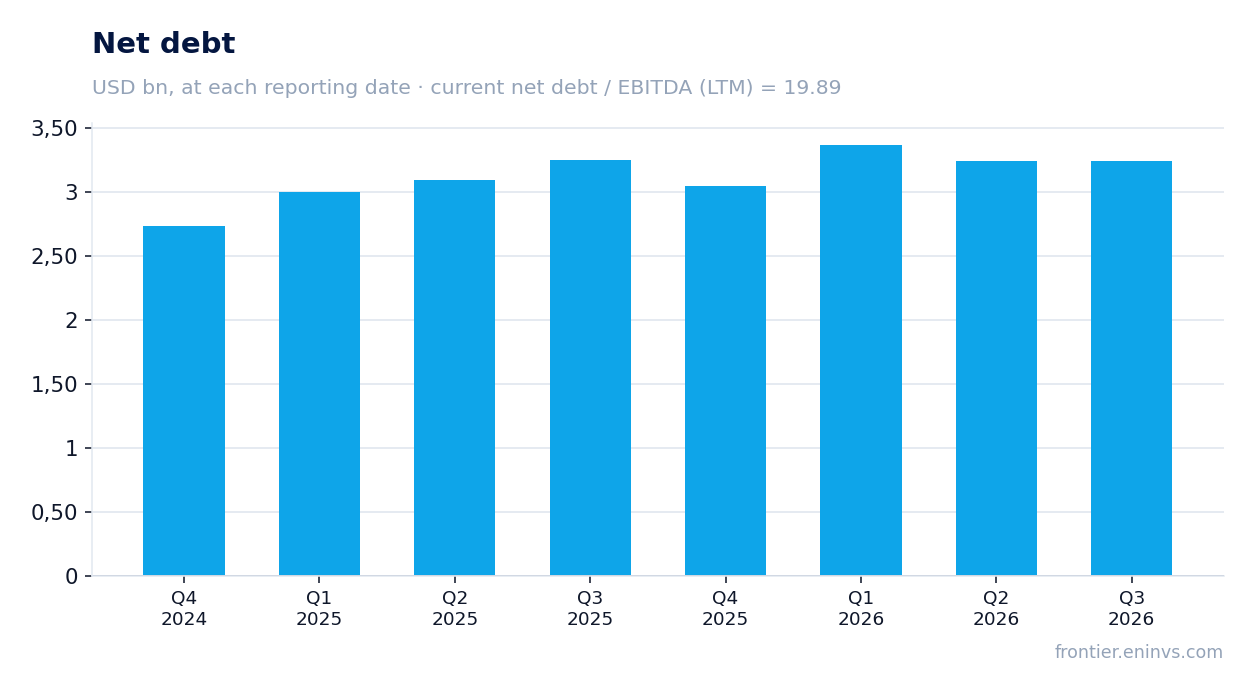
Debt at 30 September 2026 was $3.2 billion, the same as at 30 June 2026 and a year earlier. Net debt to LTM EBITDA is 19.9x. The next significant maturity is not until 2029, and available liquidity is $509 million, including $136 million of cash.
Quarterly interest expense of $56 million exceeds EBITDA less capex. With that burden free cash flow stays thin, and the capex cut is a way to preserve liquidity rather than a sign of investment appeal.
Debt at 19.9x EBITDA and EV/EBITDA LTM of 22.5 leave no margin of safety at current prices
EV/EBITDA LTM is 22.5 on a market capitalisation of $425.6 million and net debt of $3,242 million. That is a high multiple for a commodity chemical producer whose LTM EBITDA is $163 million. The share fell 24.9% after the release and has stayed there through 5 November – $3.55 before publication.
At current prices the portal's spot model puts annual EBITDA at negative $82.2 million against LTM of $163 million. Current prices do not cover the company's fixed costs. That is not a forecast but a sensitivity: below roughly 14,000 USDCNY the economics turn negative.
Net debt to LTM EBITDA is 19.9x. On EBITDA calculated at current prices the leverage becomes untenable. The company says it has covenants only on the revolving credit facility and none on term loans or bonds, but that does not remove the economic risk.
Return on equity is negative at -19.2%. With that return and a multiple above 20, the stock is expensive against its own history even after the post-release fall.
The 7.7% dividend yield rests on payouts not covered by profit
The trailing twelve-month dividend yield is 7.7%. Over nine months of 2026 the company paid $24 million of dividends while posting a net loss of $329 million. Payouts are funded by the balance sheet and working capital release, not by profit.
Our estimate for the 2026 dividend is that the current rate is maintained provided free cash flow stays positive in Q4. But the company expects a full-year free cash flow use of $25–50 million, which puts the payout in question. The key is the TiO2 price: at spot of 13,960 USDCNY there is no profit to cover the dividend.
The 7.7% yield is above the key rate but not covered by profit. For a holder this means the dividend can be cut or suspended if low prices persist. The release announces no new dividend, which is a caution signal.
Valuation on the latest reported figures
| Metric | Value |
|---|---|
| Market cap | 0.43 bn USD |
| EV/EBITDA (LTM) | 22.5 |
| P/B | 0.38 |
| Net debt / EBITDA (LTM) | 19.89 |
| ROE | -19.2% |
| Dividend yield (12m) | 7.7% |
Bottom line
The quarter's strength was 18.3% revenue growth and operating profit recovering to $12 million – the first positive in several quarters. But that result rests on a TiO2 price that has already turned down: spot is 6.3% below the quarterly average. Free cash flow of $5 million and debt at 19.9x EBITDA leave no margin of safety, and the 7.7% dividend yield is not covered by profit. With EV/EBITDA LTM at 22.5 and negative EBITDA at current prices, the stock looks unattractive.
Open the company's financial profile TROX →
See also: market overview · valuation map · stock screeners