TotalEnergies: profit more than doubled, but the margin rests on the oil price, not on volumes
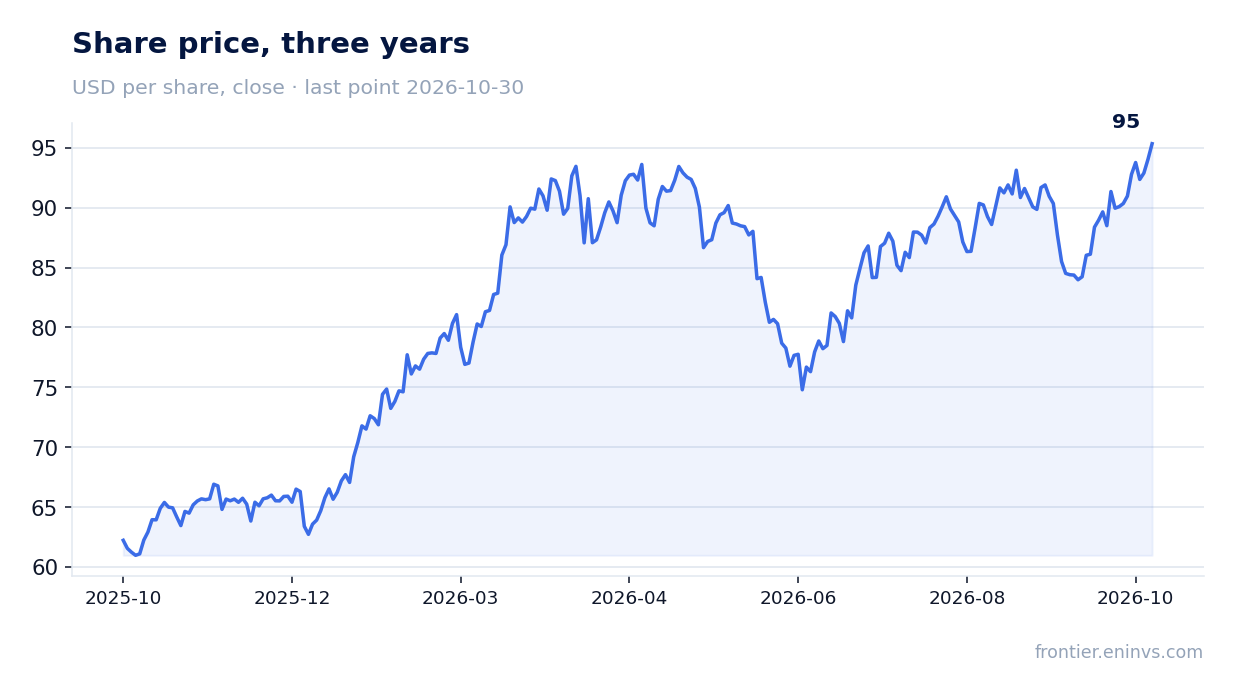
TotalEnergies reported results for the third quarter of 2026. Revenue rose 41.1% year on year to USD 61.9 bn, EBITDA by 103.9% to USD 18.6 bn and net profit by 124.4% to USD 8.3 bn. The EBITDA margin climbed to 30.1% from 20.8% a year earlier, and net debt fell to USD 28.8 bn. The share looks rather attractive: the EV/EBITDA multiple of 4.8 is above its own three-year average of 4.6, but leverage at 0.54 EBITDA and a 3.1% dividend yield leave room, and the portal's model implies 10% upside.
Key takeaways
— Revenue accelerated to +41.1% year on year from +27.8% a quarter earlier, and the growth is price, not volume
— EBITDA doubled while the margin added 9.3 percentage points to 30.1%
— Net profit rose 124.4% to USD 8.3 bn, and part of that gain is not operating
— Free cash flow of USD 10.8 bn in the quarter covers both capex and the dividend
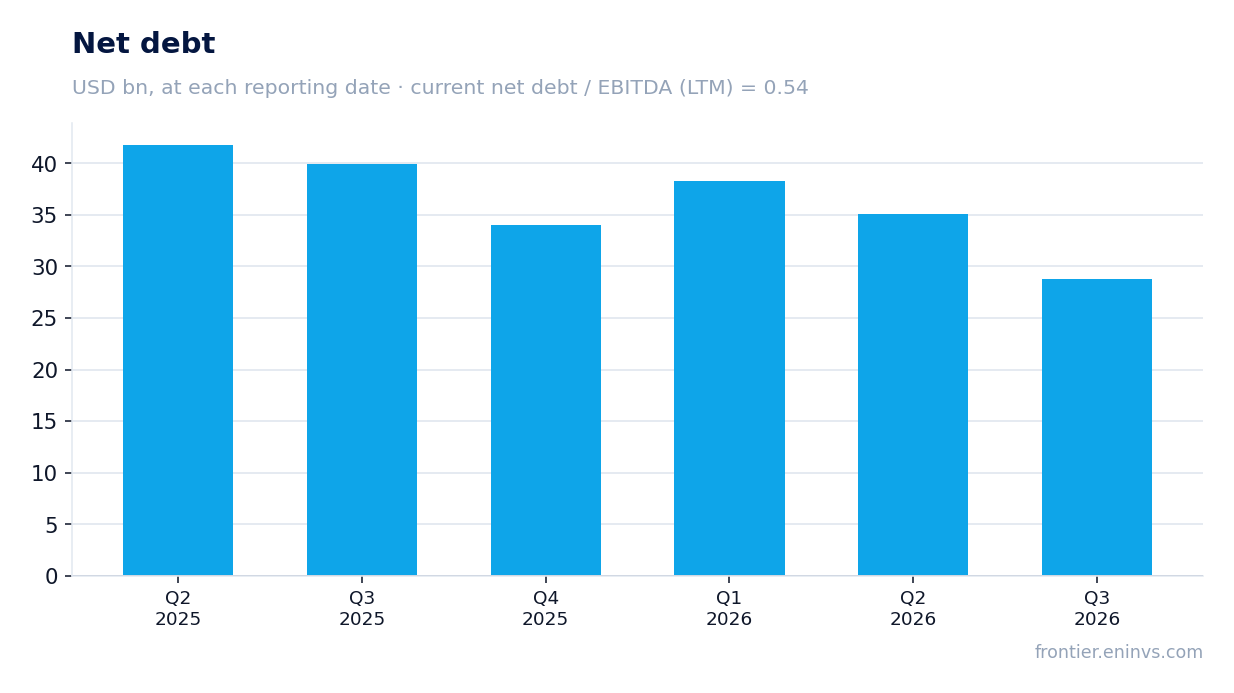
— Net debt fell to USD 28.8 bn, and leverage at 0.54 EBITDA leaves headroom
— The 3.1% dividend yield is modest against what profit delivers, but the payout is sustainable
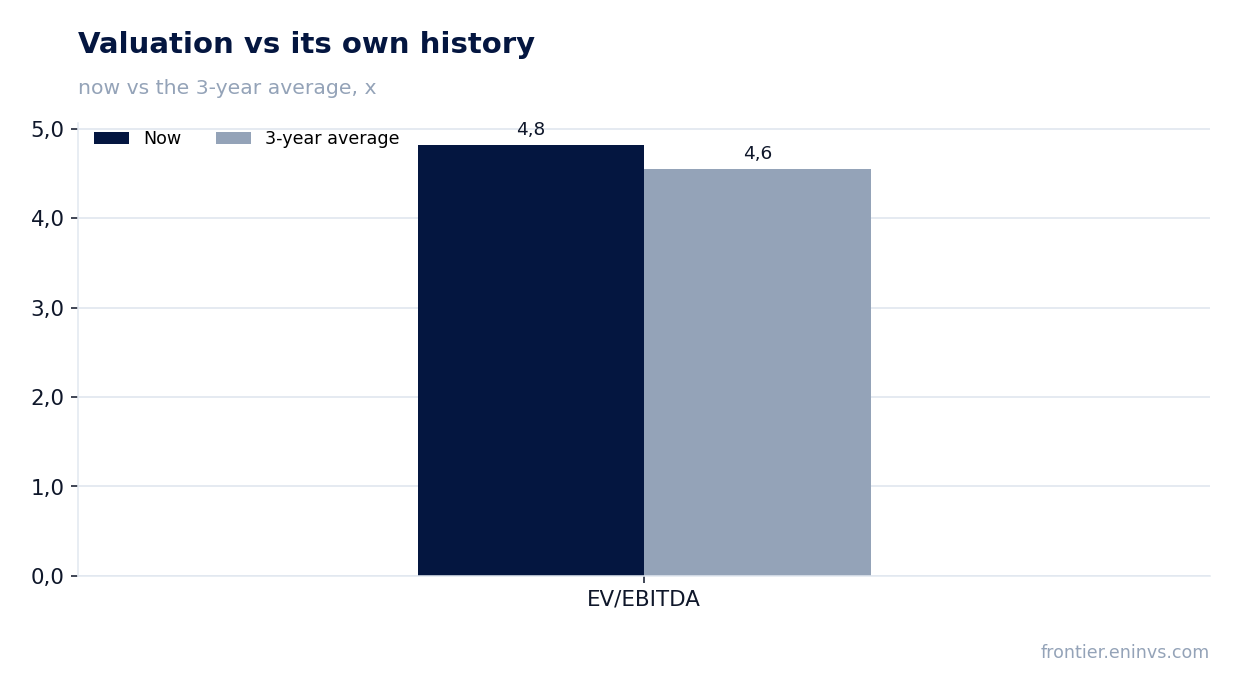
— EV/EBITDA of 4.8 is above its own three-year average of 4.6 – the share is dearer than its history
Attractiveness
Key figures, USD bn
| Metric | Q3 2025 | Q3 2026 | Change |
|---|---|---|---|
| Revenue | 43.8 | 61.9 | +41.1% |
| EBITDA | 9.12 | 18.6 | +103.9% |
| Operating profit | 5.72 | 13.6 | +138.2% |
| Net profit | 3.68 | 8.26 | +124.4% |
| Operating cash flow | 8.35 | 15.4 | +84.3% |
| Capex | 3.81 | 4.56 | +19.7% |
| EBITDA margin | 20.8% | 30.1% | +9.3 pp |
| Net margin | 8.4% | 13.4% | +5.0 pp |
Revenue accelerated to +41.1% year on year from +27.8% a quarter earlier, and the growth is price, not volume
Revenue in the third quarter of 2026 came to USD 61.9 bn, 41.1% more than a year earlier. In the second quarter growth was more modest at 27.8%, so the dynamic accelerated. The pickup came entirely in the second half: revenue was USD 49.5 bn in the first quarter, USD 57.1 bn in the second and USD 61.9 bn in the third.
The acceleration coincided with higher hydrocarbon prices rather than with expanding output. Revenue added USD 4.8 bn over the previous quarter while EBITDA added USD 7.3 bn: operating leverage worked harder than sales volume. For a holder this means the quarter is strong, but its source is the market, not steady business growth.
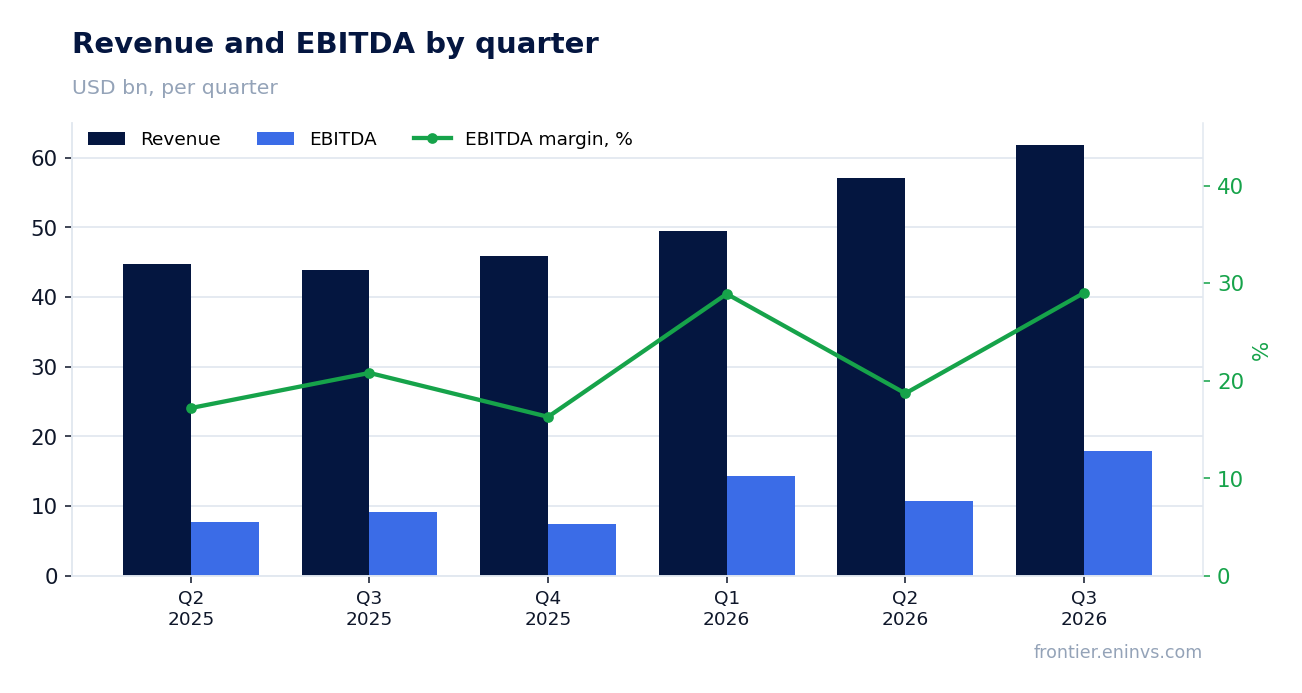
EBITDA doubled while the margin added 9.3 percentage points to 30.1%
EBITDA in the third quarter was USD 18.6 bn against USD 9.1 bn a year earlier – growth of 103.9%. The EBITDA margin rose to 30.1% from 20.8%. Such a margin gain on revenue up 41.1% means costs barely moved with the price: each extra dollar of revenue brought more profit than the previous one.
Operating profit rose to USD 13.6 bn from USD 5.7 bn a year earlier. The gap between EBITDA and operating profit – about USD 5.0 bn – is depreciation, and it is stable, so the improvement comes from operations rather than accounting lines. A 30.1% margin is a level that holds only at high oil and gas prices.
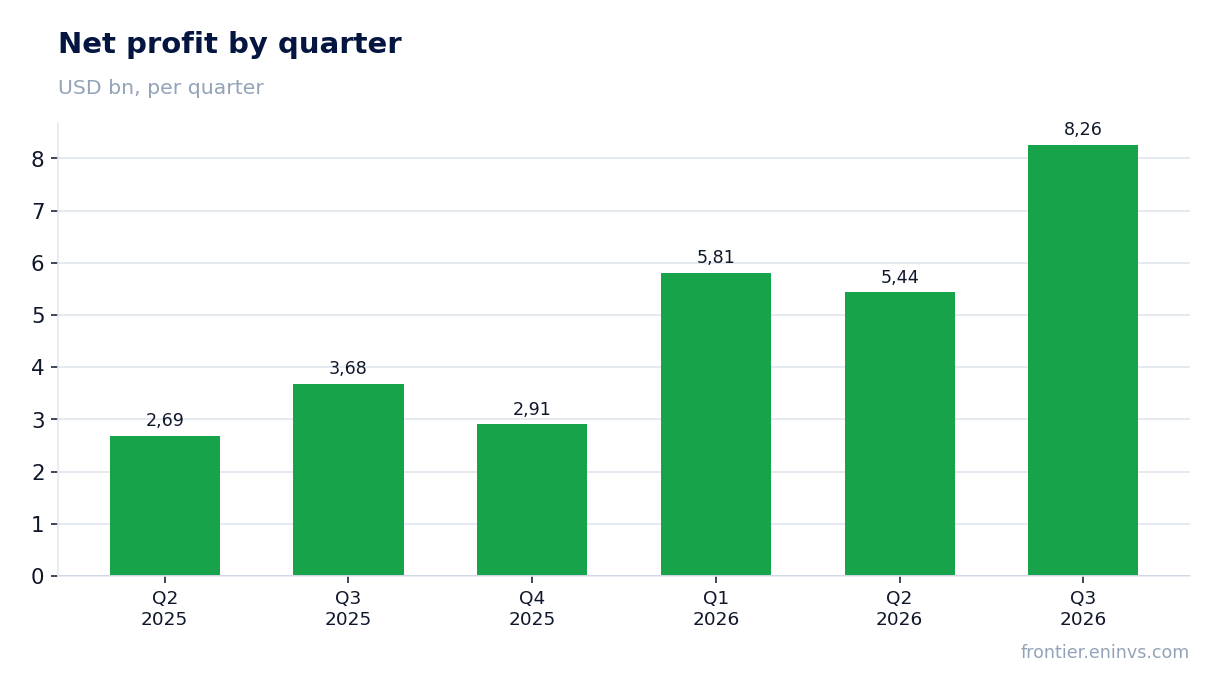
Net profit rose 124.4% to USD 8.3 bn, and part of that gain is not operating
Net profit in the third quarter was USD 8.3 bn against USD 3.7 bn a year earlier. Growth of 124.4% is faster than EBITDA growth of 103.9%, which means that below the operating line profit was supported by items unrelated to production and refining. The net margin rose to 13.4% from 8.4%.
The gap between operating profit of USD 13.6 bn and net profit of USD 8.3 bn – USD 5.3 bn – went to taxes and financial items. Earnings per share and an ROE of 25.3% look strong, but for durability the operating part matters more: it sets the base for the dividend and for the next quarter.
Free cash flow of USD 10.8 bn in the quarter covers both capex and the dividend
Operating cash flow in the third quarter was USD 15.4 bn, capital expenditure USD 4.6 bn. Free cash flow after capex is about USD 10.8 bn, comfortably covering the dividend. Over the last twelve months operating flow was USD 40.1 bn against capex of about USD 17.6 bn – the business generates cash faster than it invests.
Capex of USD 4.6 bn in the quarter is about 7.4% of revenue, a moderate level for the sector. That flow is what lets the company pay the dividend and cut debt at the same time: over the quarter net debt fell from USD 35.0 bn on 30 June to USD 28.8 bn on 30 September.
Net debt fell to USD 28.8 bn, and leverage at 0.54 EBITDA leaves headroom
Net debt at 30 September 2026 was USD 28.8 bn. It fell from USD 35.0 bn on 30 June and from USD 40.0 bn on 30 September 2025 over twelve months. A USD 11.2 bn reduction over the year against LTM profit of USD 22.4 bn is the result of cash flow, not one-off disposals.
The ratio of net debt to EBITDA over the last twelve months is 0.54. That is a low level for an oil and gas company: LTM EBITDA of USD 52.8 bn covers the debt almost twice. Such headroom lets the company keep the dividend and capex even if oil prices fall by a third, without new borrowing.
The 3.1% dividend yield is modest against what profit delivers, but the payout is sustainable
The trailing twelve-month dividend yield is 3.1% on the current price. With LTM profit of USD 22.4 bn and a market cap of USD 214.3 bn, the payout is about 30% – the company gives shareholders a smaller share of profit than it could. Our estimate for the current year's dividend – assuming the payout stays near 30% and profit near the LTM level – implies a yield of 3–3.5%, and it rests on the oil price.
For comparison, the dollar key rate is now below the yield on the share, so the dividend is competitive. More importantly, the payout is covered by free cash flow: USD 10.8 bn in the quarter against a dividend that at a 3.1% yield and a USD 214.3 bn market cap comes to about USD 6.6 bn a year. The payout would shrink if profit fell with the oil price or if the company raised capex.
EV/EBITDA of 4.8 is above its own three-year average of 4.6 – the share is dearer than its history
The trailing twelve-month EV/EBITDA multiple is 4.8 against its own three-year average of 4.6, i.e. 6% above. The share trades dearer than usual, and that is the price for a strong quarter: the market has already priced in high profit. P/E LTM is 9.6, which for an oil and gas company is neither cheap nor expensive.
The portal's model, which re-prices EBITDA at current commodity prices at the target EV/EBITDA, implies 10% upside to fair value. This is our own estimate, not a market consensus. It rests on the current oil price: if it holds, the share is undervalued; if it falls, the discount disappears.
Valuation on the latest reported figures
| Metric | Value |
|---|---|
| Market cap | 214 bn USD |
| P/E (LTM) | 9.6 |
| EV/EBITDA (LTM) | 4.8 |
| P/B | 1.87 |
| Net debt / EBITDA (LTM) | 0.54 |
| Operating cash flow (LTM) | 40.1 bn |
| ROE | 25.3% |
| Dividend yield (12m) | 3.1% |
| EV/EBITDA, 3-year average | 4.6 |
Bottom line
The quarter is strong on every operating line: revenue +41.1%, EBITDA +103.9%, margin 30.1%, free flow USD 10.8 bn. But the gain came from price, not volume, and part of profit below the operating line is not operating. Debt at 0.54 EBITDA and a flow that covers the dividend are the company's real strength, not a one-off. The question for a holder now is price: EV/EBITDA of 4.8 is above its own three-year average of 4.6, and the portal model's 10% upside depends entirely on oil holding. The verdict is rather attractive: the 3.1% dividend and low debt outweigh the premium to history, but a price fall would make the valuation neutral.
Open the company's financial profile TTE →
See also: market overview · valuation map · stock screeners