Tamarack Valley Energy: revenue up 41.1%, but the multiple is already double its own history
Tamarack Valley Energy's Q3 2026 report showed revenue of 835.6 m, operating profit of 221.5 m and net profit of 144.1 m. Year on year revenue added 41.1%, net profit 198.0%, and the net margin rose to 17.2% from 8.2% a year earlier. At the same time EV/EBITDA over the last twelve months stands at 6.7 against its own three-year average of 2.5, while the portal model implies minus 18% to fair value. The share looks rather unattractive at the current level: the growth is there, but it has already been paid for in the multiple.
Key takeaways
— Q3 revenue grew 41.1% year on year, but the pace slowed from 45.4% in Q2
— Net profit nearly tripled, with the margin rising to 17.2% from 8.2%
— Operating cash flow of 216.6 m is 3.9 times smaller than quarterly revenue
— Debt of 500.4 m equals only 0.64 of LTM EBITDA
— Dividend yield of 1.19% lags the key rate
— EV/EBITDA of 6.7 is 166% above its own three-year average of 2.5
— The portal model implies minus 18% to fair value
Attractiveness
Key figures, USD bn
| Metric | Q3 2025 | Q3 2026 | Change |
|---|---|---|---|
| Revenue | 0.59 | 0.84 | +41.1% |
| Operating profit | 0.07 | 0.22 | +233.0% |
| Net profit | 0.05 | 0.14 | +198.0% |
| Operating cash flow | 0.11 | 0.22 | +104.6% |
| Net margin | 8.2% | 17.2% | +9.0 pp |
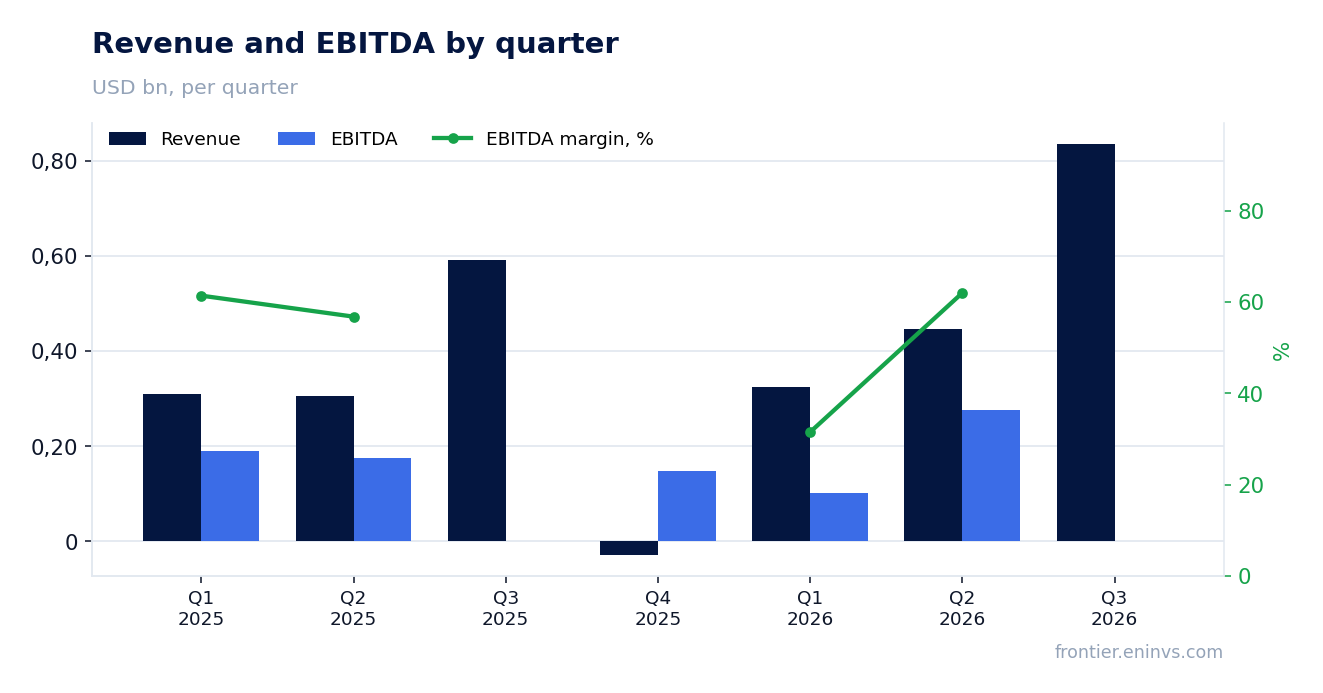
Q3 revenue grew 41.1% year on year, but the pace slowed from 45.4% in Q2
Q3 2026 revenue came in at 835.6 m, up 41.1% from the same quarter a year earlier. That is a strong absolute result: the quarter was the best in the company's presented history. However, compared with Q2 2026, when growth was 45.4%, the pace slowed.
The year-on-year deceleration from 45.4% to 41.1% means the comparison base is rising and incremental growth is harder to come by. In absolute terms, Q2 revenue was 445.5 m and Q3 was 835.6 m, so the sequential increase was nearly twofold. But year on year the dynamics are no longer accelerating, and that is what matters for assessing the durability of the trend.
The company does not disclose in the provided facts which factor – prices, volumes or exchange rate – made the main contribution. So we limit ourselves to stating: revenue is growing fast, but the pace of that growth is slowing. For an investor, this signals that the peak of the annual increase may already be behind us.
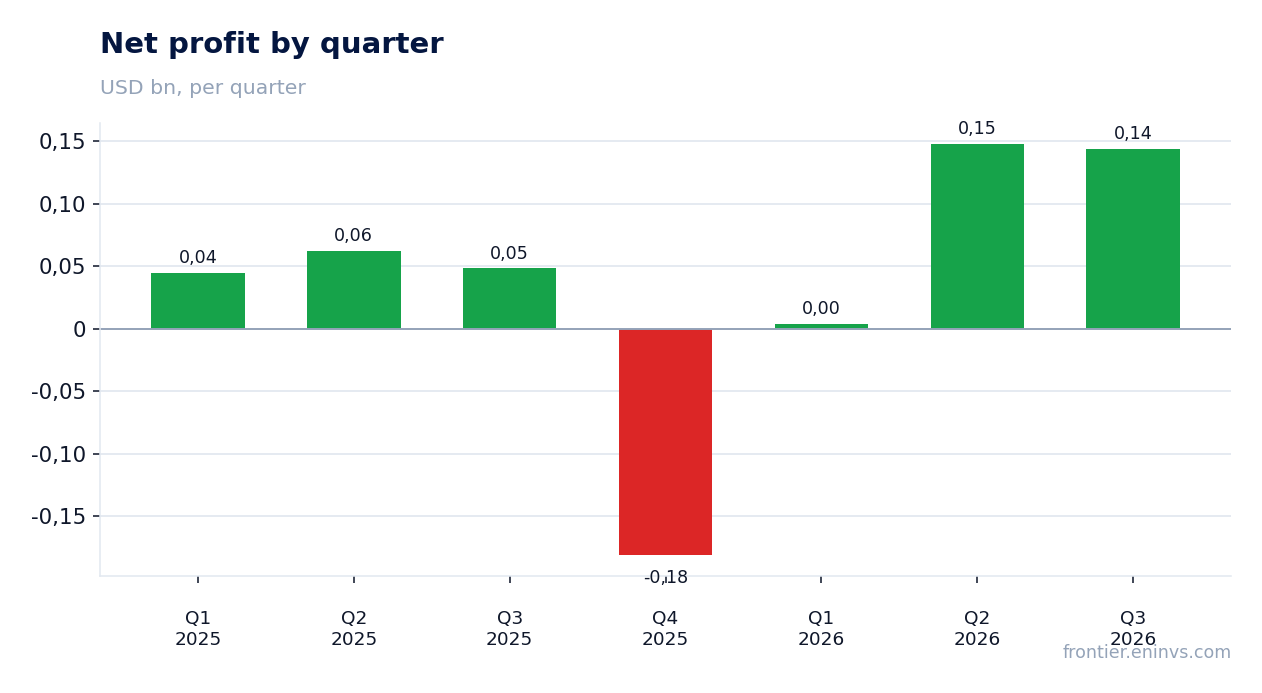
Net profit nearly tripled, with the margin rising to 17.2% from 8.2%
Q3 2026 net profit was 144.1 m, up 198.0% from a year earlier. The net margin rose to 17.2% from 8.2% in Q3 2025. This means the company is not just growing turnover but is retaining substantially more from every dollar of revenue.
Operating profit for the quarter was 221.5 m. The ratio of operating to net profit shows that taxes and interest consume about a third of the operating result. At the same time, Q2 2026 net profit was 147.9 m, so in Q3 it declined slightly sequentially despite revenue growth.
The margin improvement from 8.2% to 17.2% is the key positive of the report. It suggests the company either cut unit costs or benefited from pricing. Without additional data from the report, the exact cause cannot be named, but the fact of margin improvement itself is important for assessing earnings quality.
Operating cash flow of 216.6 m is 3.9 times smaller than quarterly revenue
Q3 2026 operating cash flow was 216.6 m. That is only slightly below net profit for the same period (144.1 m) but substantially below revenue. The revenue-to-operating-cash-flow ratio is 3.9 times, indicating a capital-intensive business or a significant working capital outflow.
For comparison: in Q2 2026 operating cash flow was 225.3 m, in Q1 it was 133.3 m. So in Q3 it even declined slightly sequentially, even though revenue nearly doubled. This divergence between revenue growth and cash flow dynamics is an important signal.
The company does not disclose the structure of capital expenditure in the facts, so it is impossible to say how much of operating cash flow went into investment. But the conversion of revenue into cash remains modest. For a shareholder, this means profit growth does not necessarily translate into free cash flow.
Debt of 500.4 m equals only 0.64 of LTM EBITDA
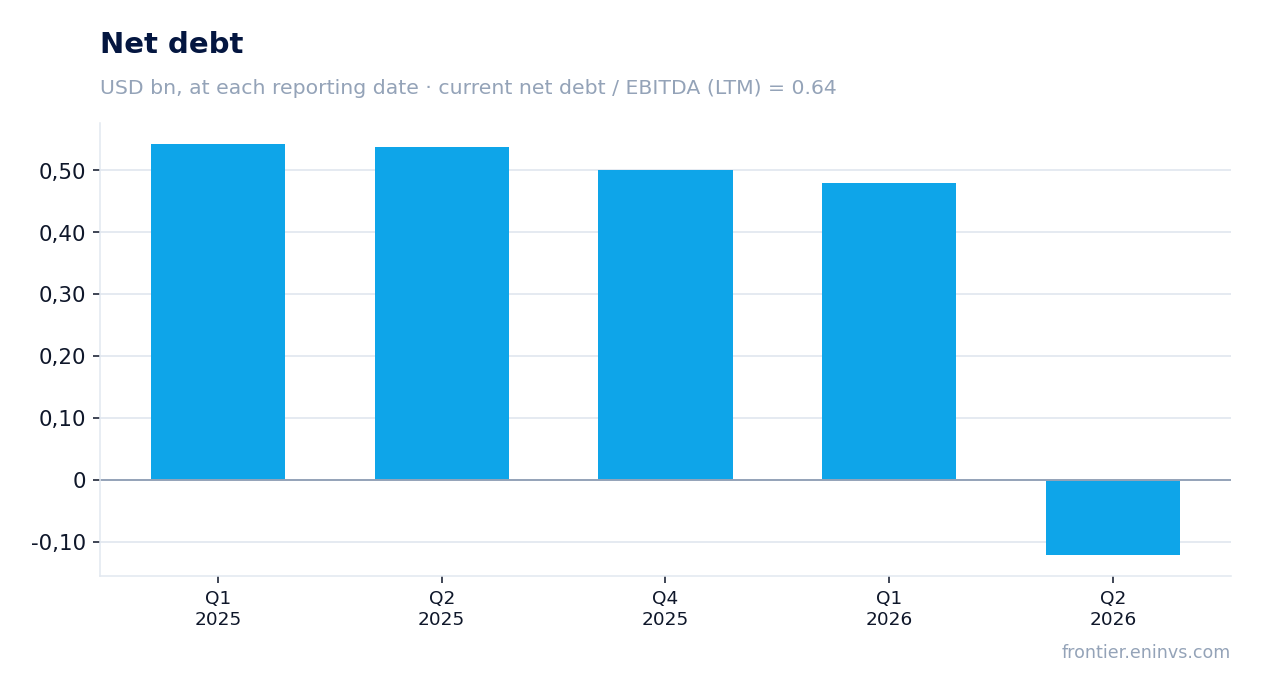
Net debt at the latest reporting date is 500.4 m. With LTM EBITDA of 782.1 m, the debt-to-EBITDA ratio is 0.64. That is a low leverage level: the company can service its debt without strain even if commodity prices fall substantially.
It is important to note that the facts do not contain a previous value for this ratio, so it cannot be claimed that leverage rose or fell. We can only state the current level. The absolute debt of 500.4 m is comparable to quarterly revenue, which looks comfortable for a capital-intensive business.
Low leverage is a safety cushion, but it does not remove the question of return on capital. With a market capitalisation of 4,753.6 m and EV/EBITDA of 6.7, the market values the company well above what its own debt profile implies. This creates an asymmetry: the debt is safe, but the share is no longer cheap.
Dividend yield of 1.19% lags the key rate
The trailing twelve-month dividend yield is 1.19%. That is a modest level, well below the current key rate. For an income-oriented investor, such a yield is unlikely to compensate for the risks of a commodity business.
The company does not disclose in the facts the size of the last dividend or the year for which it was paid. So we cannot assess what share of profit the company allocates to payouts. However, with Q3 net profit of 144.1 m and a market capitalisation of 4,753.6 m, even a generous payout would not deliver a high yield.
Our benchmark for a fair yield for such a company is no lower than the key rate. The current 1.19% does not meet that condition. If the company does not increase its payout ratio or grow profit, the dividend will remain a weak argument for buying the shares.
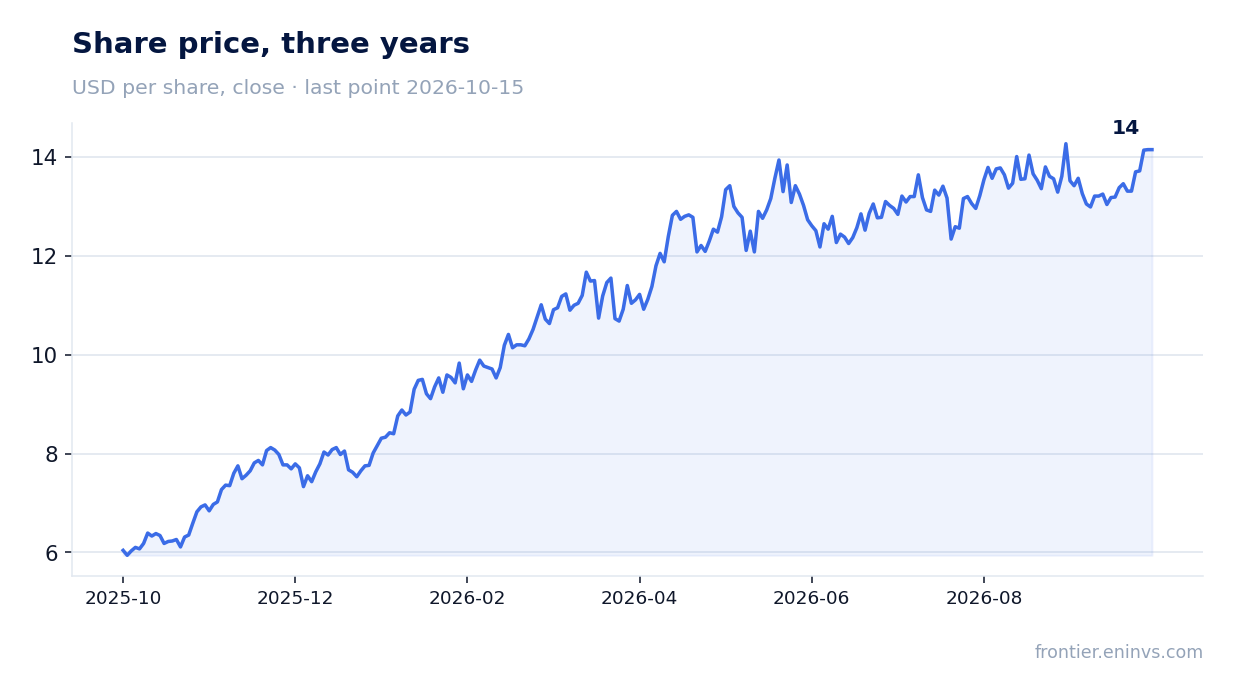
EV/EBITDA of 6.7 is 166% above its own three-year average of 2.5
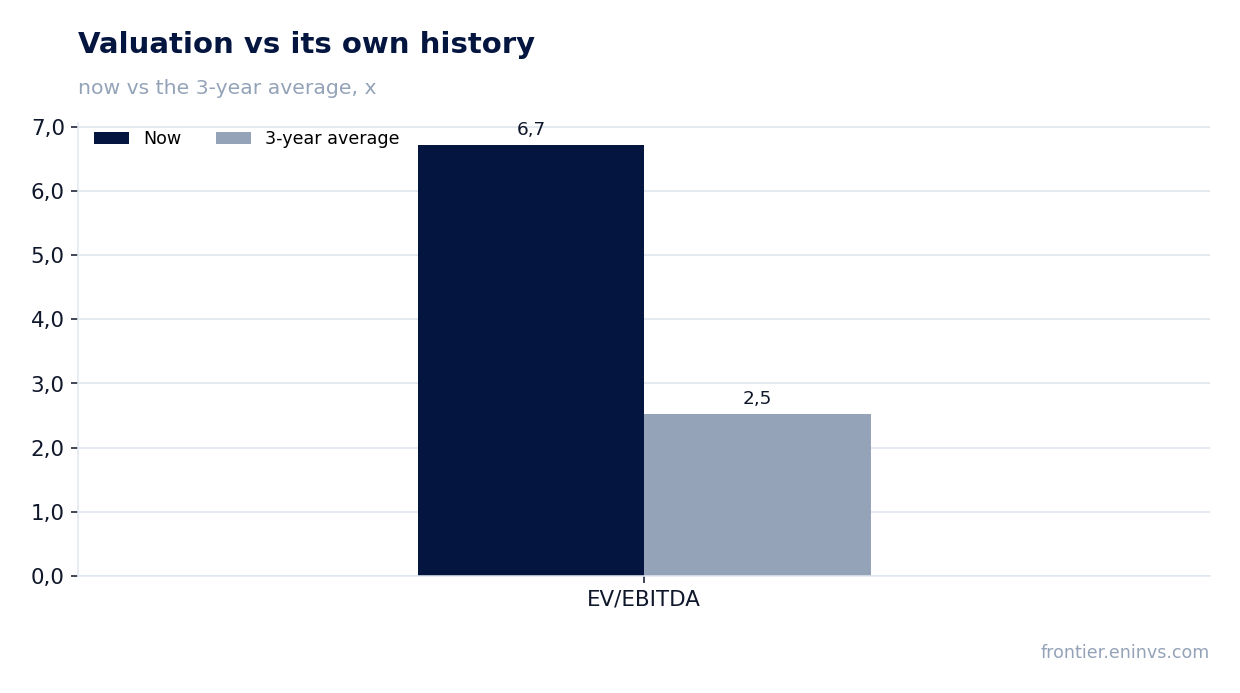
LTM EV/EBITDA is 6.7. That is 166% above its own three-year average of 2.5. In other words, the market currently values the company nearly three times more expensive than its average over the past three years on this multiple.
Such a divergence is a key argument against buying at the current level. Even if profit continues to grow, a significant part of future growth is already priced in. For the multiple to return to its historical average, either the share price would need to fall sharply or EBITDA would need to multiply.
Comparison with its own history is valid because we do not use sector averages, which are not in the facts. The three-year average of 2.5 is the benchmark the market applied in the past. The current 6.7 suggests investors expect high commodity prices to persist or further production growth.
The portal model implies minus 18% to fair value
According to the portal model, which re-prices EBITDA at current commodity prices and a target EV/EBITDA, the fair value of the share is 18% below the current market price. This is our own estimate, not a market consensus or a target price.
The negative 18% potential is consistent with the conclusion that the stock is overvalued on the multiple. The market is pricing in a more optimistic scenario for prices or volumes than our model assumes. If commodity prices do not meet these expectations, the share could correct toward fair value.
For an investor, this means the current price offers no margin of safety. Even if current profit is maintained, the share's return will be limited. A purchase only makes sense if one believes in substantial EBITDA growth above current expectations.
Valuation on the latest reported figures
| Metric | Value |
|---|---|
| Market cap | 4.75 bn USD |
| EV/EBITDA (LTM) | 6.7 |
| P/B | 3.57 |
| Net debt / EBITDA (LTM) | 0.64 |
| ROE | 16.1% |
| Dividend yield (12m) | 1.2% |
| EV/EBITDA, 3-year average | 2.5 |
Bottom line
Bottom line: Tamarack Valley Energy's Q3 2026 report showed strong absolute results – revenue of 835.6 m, net profit of 144.1 m, margin of 17.2%. However, annual growth slowed from 45.4% to 41.1%, and operating cash flow remains modest relative to revenue. Leverage is low at 0.64 EBITDA, but a dividend yield of 1.19% does not compensate for the risks. The main problem is valuation: EV/EBITDA of 6.7 is nearly three times its own three-year average of 2.5, and the portal model implies minus 18% to fair value. Verdict: the share is rather unattractive at the current level.
Open the company's financial profile TVE →
See also: market overview · valuation map · stock screeners