UFP Industries: revenue accelerated to +11.1%, but $19 million of freight ate almost all the profit
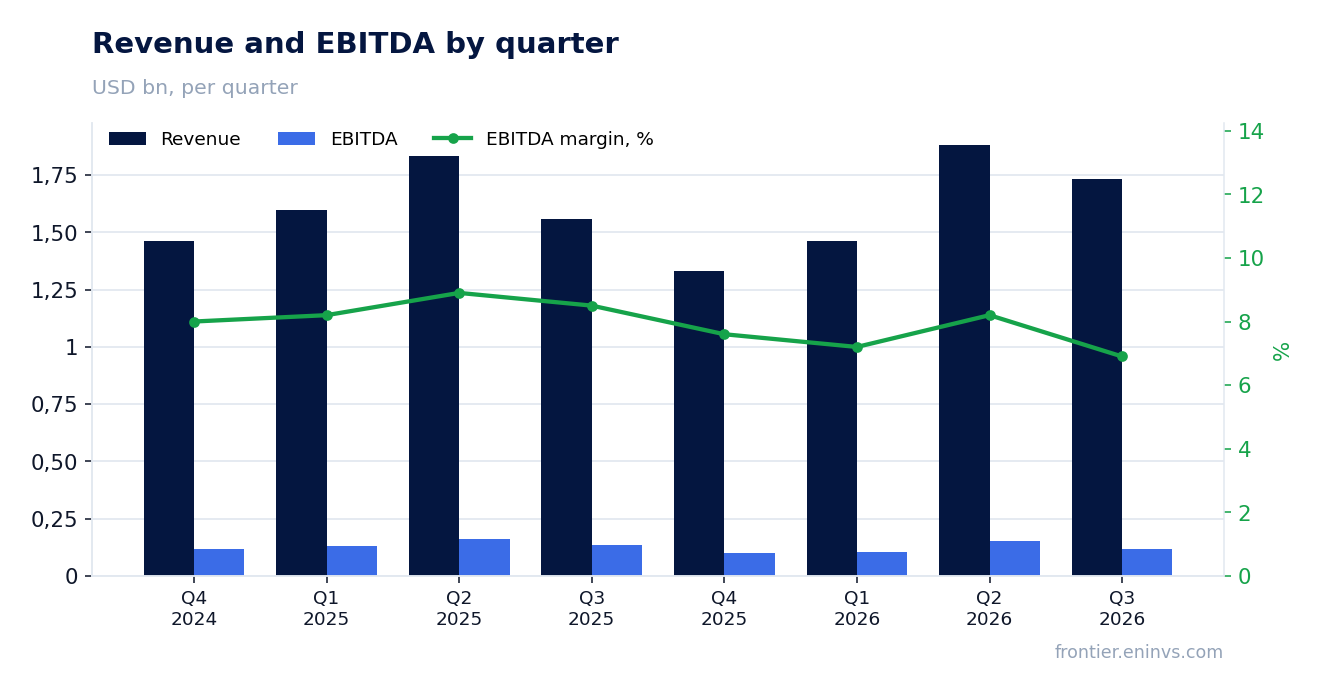
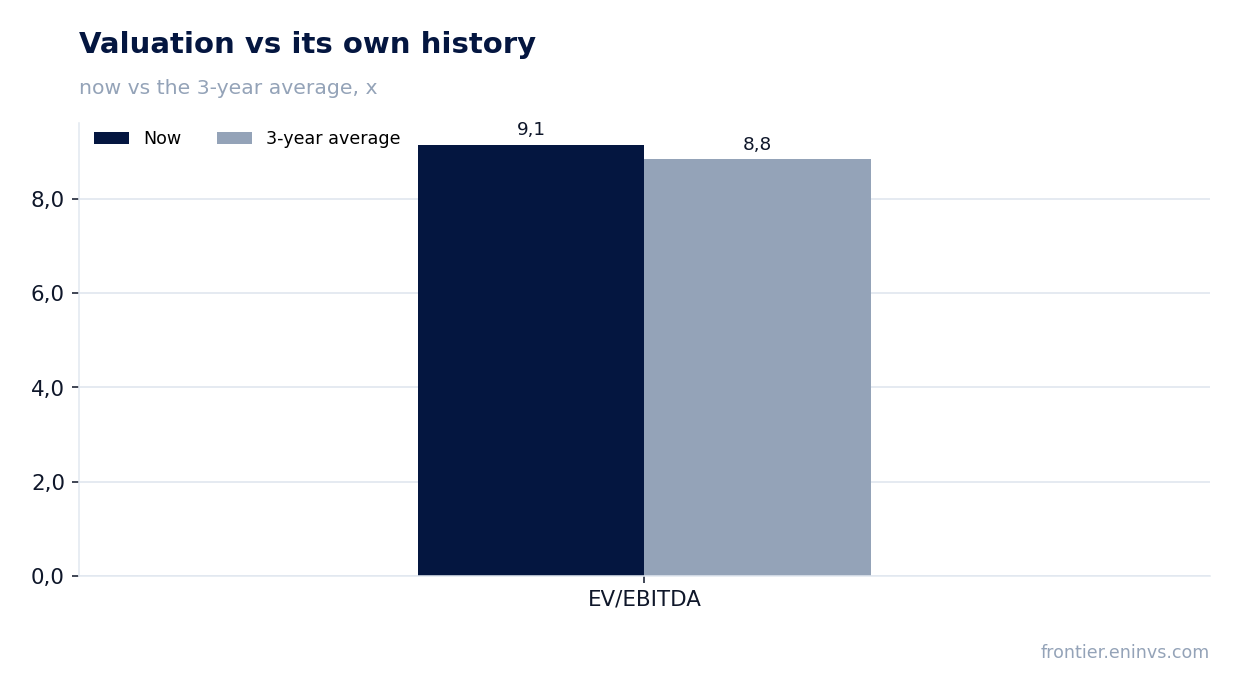
On October 28 UFP Industries reported third-quarter 2026 results: revenue of $1,732.8 million (+11.1% YoY), adjusted EBITDA of $119.3 million (−10.5%), net profit of $58.0 million (−20.1%). Top-line growth accelerated from +2.6% in the second quarter, but the EBITDA margin compressed from 8.5% to 6.9% as $19 million of higher freight and lumber costs absorbed the volume effect. With EV/EBITDA at 9.1 versus its own three-year average of 8.8 and the portal model showing −73% upside, the share looks unattractive at the current price.
Key takeaways
— Revenue rose 11.1% to $1,732.8 million, and nearly half of the gain came from prices rather than volumes
— Organic units added 4%, and growth rests on four business units rather than the whole portfolio
— Freight costs rose $19 million and alone took 1.3 percentage points of margin
— The EBITDA margin compressed from 8.5% to 6.9%, with packaging hit hardest
— Net profit fell 20.1% to $58.0 million despite revenue growth
— Leverage is negative: net debt of −$557.4 million and net debt/EBITDA LTM of −1.26
— The dividend was raised 3% to $0.36 per share, but the 1.8% yield does not catch the risk-free rate
— EV/EBITDA of 9.1 is in line with its own three-year average of 8.8, while the portal model shows −73%
Attractiveness
Key figures, USD bn
| Metric | Q3 2025 | Q3 2026 | Change |
|---|---|---|---|
| Revenue | 1.56 | 1.73 | +11.1% |
| EBITDA | 0.13 | 0.12 | -10.5% |
| Operating profit | 0.09 | 0.07 | -24.3% |
| Net profit | 0.07 | 0.06 | -20.1% |
| Operating cash flow | 0.28 | — | — |
| Capex | 0.08 | — | — |
| EBITDA margin | 8.5% | 6.9% | -1.6 pp |
| Net margin | 4.6% | 3.3% | -1.3 pp |
Revenue rose 11.1% to $1,732.8 million, and nearly half of the gain came from prices rather than volumes
Third-quarter 2026 revenue was $1,732.8 million versus $1,559.6 million a year earlier, up 11.1%. That is an acceleration from the second quarter, when revenue added 2.6%: the company has exited the decline that ran from Q4 2024 through Q1 2026.
The press release breaks the gain down as 4% organic units, 2% acquisitions and 5% selling prices. Nearly half of the revenue growth therefore came from price increases rather than physical demand. Organic growth of 4% is a recovery from zero a year earlier, but it is still short of pre-crisis rates.
The segments are uneven. Retail added 6.8% to $634.5 million, Packaging 18.0% to $465.8 million, Construction 11.3% to $552.4 million. Within Retail, Deckorators grew 21% in organic units while ProWood declined 4% on weak consumer sentiment. In Packaging, Structural Packaging added 14% while PalletOne managed only 1% organically.
Organic units added 4%, and growth rests on four business units rather than the whole portfolio
Organic growth of 4% came from four units: Site Built (+12%), Commercial (+20%), Structural Packaging (+14%) and Deckorators (+21%). The rest either stagnated or fell: Factory Built lost 10% on the exit from low-margin commodity sales, ProWood fell 4%, and UFP Edge was flat.
That skew means overall growth rests on a few points rather than a broad demand recovery. In Construction, Site Built's 12% gain partly offset Factory Built's decline, but the segment's overall organic growth was only 4%. In Retail, flat ProWood and stagnant Edge outweighed Deckorators' success.
New products rose to 8.7% of sales from 6.8% a year earlier – one of the few metrics that improved. The company attributes this to Deckorators, Structural Packaging and Construction value-added. But new products are not yet a sufficient counterweight to weakness in the core markets.
Freight costs rose $19 million and alone took 1.3 percentage points of margin
Transportation costs, net of fuel surcharges and price adjustments, rose $19 million, or 1.3% of sales, year over year. Spot rates excluding fuel rose 30% during the quarter before stabilising at an elevated level. The cause is tightening carrier capacity as smaller players exited the market.
That sum is almost equal to the entire quarterly operating profit of $70.2 million. Without the freight increase, profit would have been materially higher, and it was transport, not volumes or prices, that determined the weak result. The company names freight and lumber as the main reasons for the profit decline.
The segment breakdown confirms it: in Retail, freight added $8 million of costs; in Packaging, transport and material costs rose in every unit. In Construction, freight pressure combined with competitive pricing at Site Built. The company has no single offsetting mechanism: it passes some costs into prices, but not all.
The EBITDA margin compressed from 8.5% to 6.9%, with packaging hit hardest
Adjusted EBITDA was $119.3 million, or 6.9% of sales, versus $140.0 million and 8.5% a year earlier. A 10.5% decline alongside 11.1% revenue growth is the classic gap where costs outrun sales. Gross profit fell to $244.9 million from $262.7 million, and gross margin to 14.1% from 16.8%.
Among segments, Packaging fell hardest: EBITDA of $27.3 million, −20.5%, margin 5.8% versus 8.7%. The cause is higher transport and material costs in every unit. Retail posted EBITDA of $34.1 million, −14.7%, margin 5.4% versus 6.7%. Construction – $37.7 million, −10.0%, margin 6.8% versus 8.4%.
The margin decline was uneven: Construction suffered least thanks to improved gross profit at Commercial and Concrete Forming. But the overall result is the same – the company could not hold profitability while revenue grew. That is the report's central contradiction: sales rise, profitability falls.
Net profit fell 20.1% to $58.0 million despite revenue growth
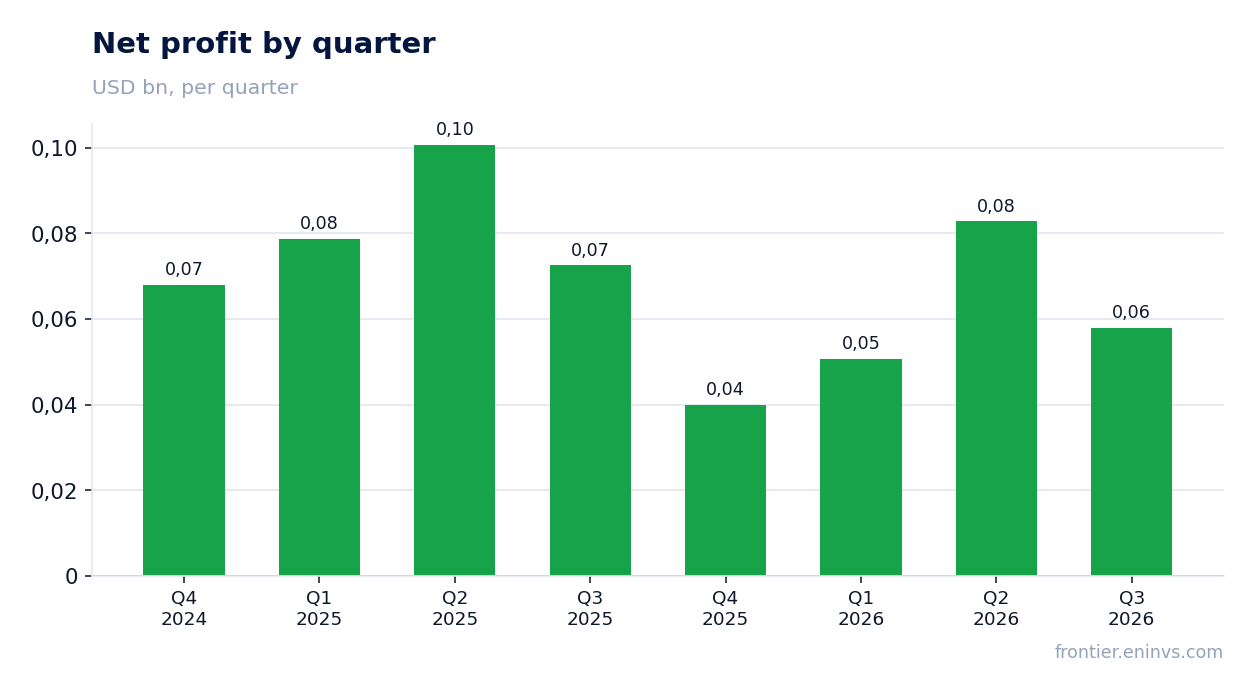
Net profit attributable to controlling interests was $58.0 million versus $75.3 million a year earlier, down 20.1%. Diluted earnings per share were $1.05 versus $1.29. Net margin compressed to 3.3% from 4.6%.
Operating profit fell to $70.2 million from $89.5 million, or 21.6%. Interest and other expenses declined to $6.7 million from $9.7 million – the company earns interest income on its cash pile. But that did not offset the operating profit decline.
There are few one-off items distorting the picture: net gain on disposition and impairment of assets was $3.2 million versus a $2.5 million loss a year earlier. So profit fell not because of one-off write-offs but because of fundamental cost pressure. That makes the result more worrying, not less.
Leverage is negative: net debt of −$557.4 million and net debt/EBITDA LTM of −1.26
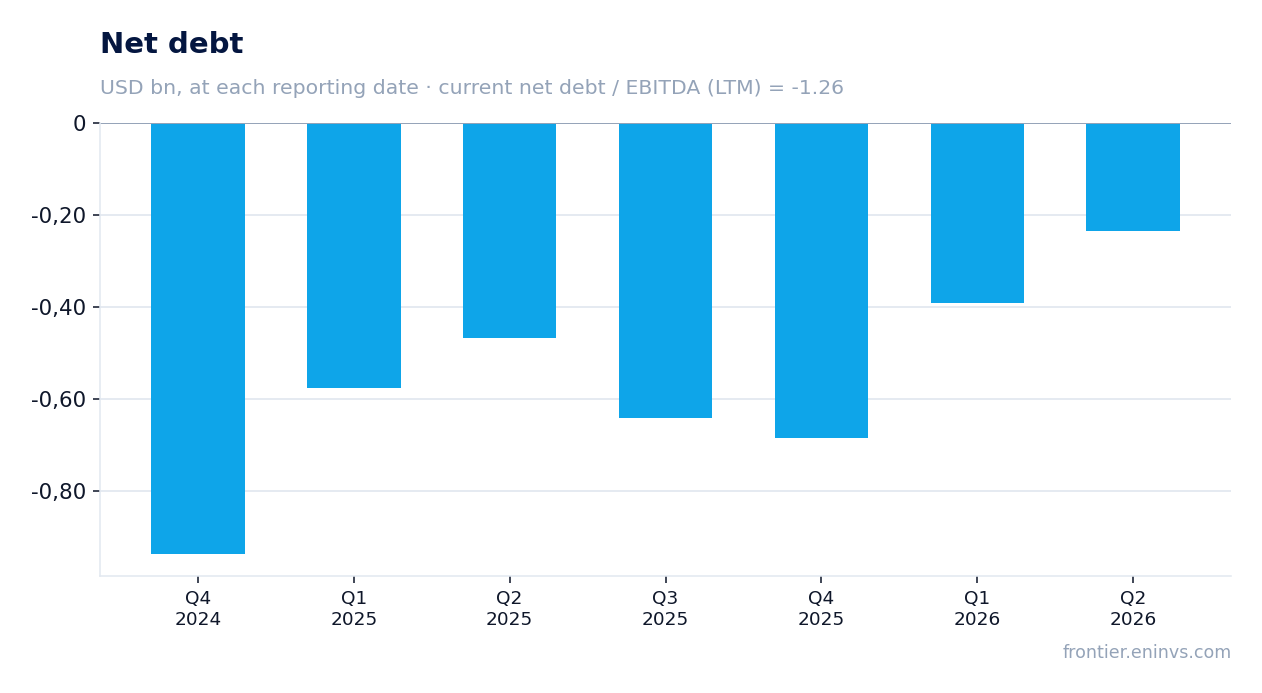
Net debt at the latest annual balance sheet was −$557.4 million, meaning the cash cushion exceeds debt. Net debt to EBITDA over the last twelve months was −1.26. That is a level, not a trend: comparison with a prior period is not available, but a negative value by itself means the company does not depend on borrowed funds.
Liquidity is about $2.0 billion, including more than $677 million of cash and $1.3 billion of available credit lines. In October the company extended its $750 million revolving credit facility to 2031. Operating cash flow for the first nine months of 2026 was $235 million, and free cash flow was $287 million.
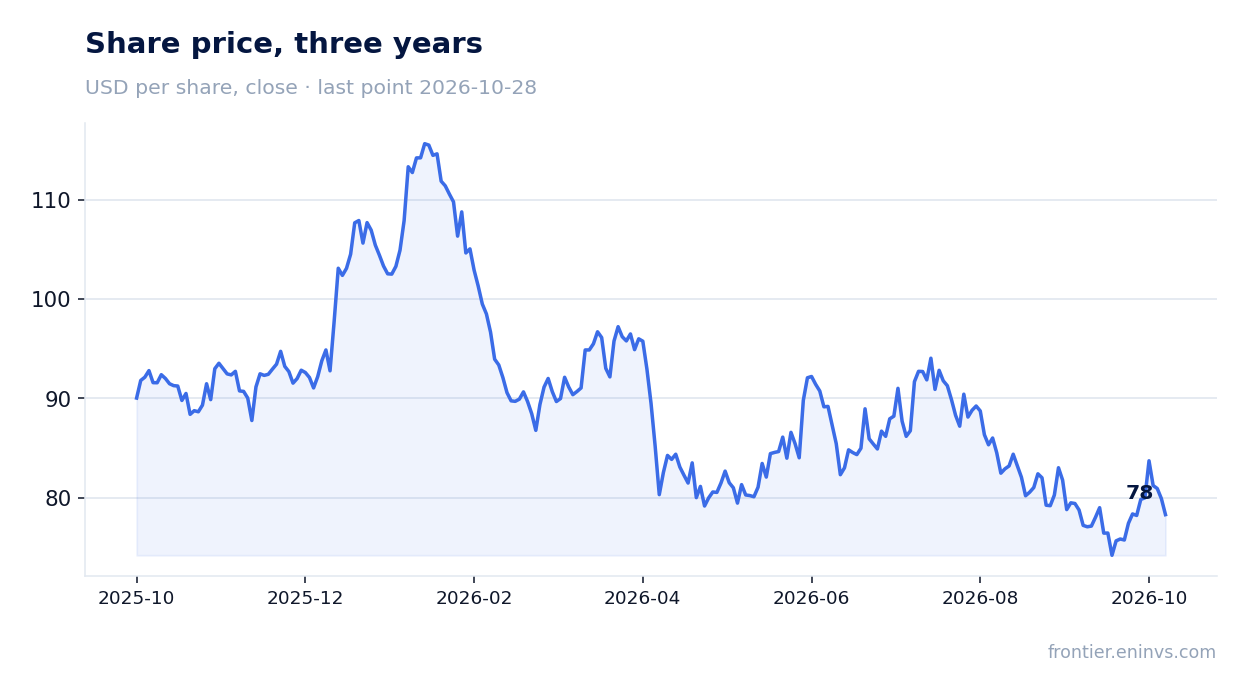
Free cash flow went into buybacks: 2.17 million shares were repurchased in the first nine months for $182.7 million at an average price of $84.24. That is above the current price of $79.92, so the company bought back shares at a higher price than they trade at now. The remaining programme is $198 million through April 2027.
The dividend was raised 3% to $0.36 per share, but the 1.8% yield does not catch the risk-free rate
On October 21 the board declared a quarterly dividend of $0.36 per share, payable December 15, 2026. That is 3% above the 2025 quarterly rate of $0.35. The trailing twelve-month dividend yield is 1.8% at the current price.
Our estimate: at the $0.36 quarterly rate, the annual dividend would be $1.44 per share. This is our calculation from the declared rate, not company guidance. It rests on LTM profit of $231.6 million and free cash flow of $287 million for nine months – the payout ratio remains low, and the company has room to raise payments.
A 1.8% yield is below the risk-free rate, and that is the main argument against the dividend story as a reason to buy the share. The company raised the dividend by only 3% – slower than inflation and slower than revenue growth. For an investor who needs income, this stock does not fit: the payment is small relative to the price, and dividend growth is modest.
EV/EBITDA of 9.1 is in line with its own three-year average of 8.8, while the portal model shows −73%
EV/EBITDA over the last twelve months is 9.1, 4% above its own three-year average of 8.8. That is in line with history, neither cheaper nor dearer. P/E LTM is 19.9, market capitalisation $4,616.4 million, and ROE 10.8%.
The portal model re-prices EBITDA at current commodity prices at the target EV/EBITDA and, against market capitalisation, shows −73% upside. This is our own estimate, not market consensus and not a target price. It means that at current lumber prices and current margins the share is worth materially less than its cash flow justifies.
The market reacted to the report with a decline: the share lost 2.0% on the publication day and has stayed there since. The closing price before the report was $79.92. The reaction was restrained but reflects disappointment: revenue growth did not translate into profit growth, and investors saw it.
Valuation on the latest reported figures
| Metric | Value |
|---|---|
| Market cap | 4.62 bn USD |
| P/E (LTM) | 19.9 |
| EV/EBITDA (LTM) | 9.1 |
| P/B | 1.51 |
| Net debt / EBITDA (LTM) | -1.26 |
| ROE | 10.8% |
| Dividend yield (12m) | 1.8% |
| EV/EBITDA, 3-year average | 8.8 |
Bottom line
The report's strength is revenue: +11.1% with acceleration from the second quarter and 4% organic volume growth. The weakness is profit: EBITDA −10.5%, net profit −20.1%, margin compressed from 8.5% to 6.9%. $19 million of freight and lumber costs absorbed the volume effect, and the company has not yet found a full offset. Leverage is negative and the dividend is growing, but the 1.8% yield does not catch the risk-free rate. With EV/EBITDA at 9.1 in line with its own history and the portal model at −73%, the share looks unattractive at the current price.
Open the company's financial profile UFPI →
See also: market overview · valuation map · stock screeners