US Energy: revenue grows year over year for the first time in a year, but the quarter is still about construction, not production
Contents
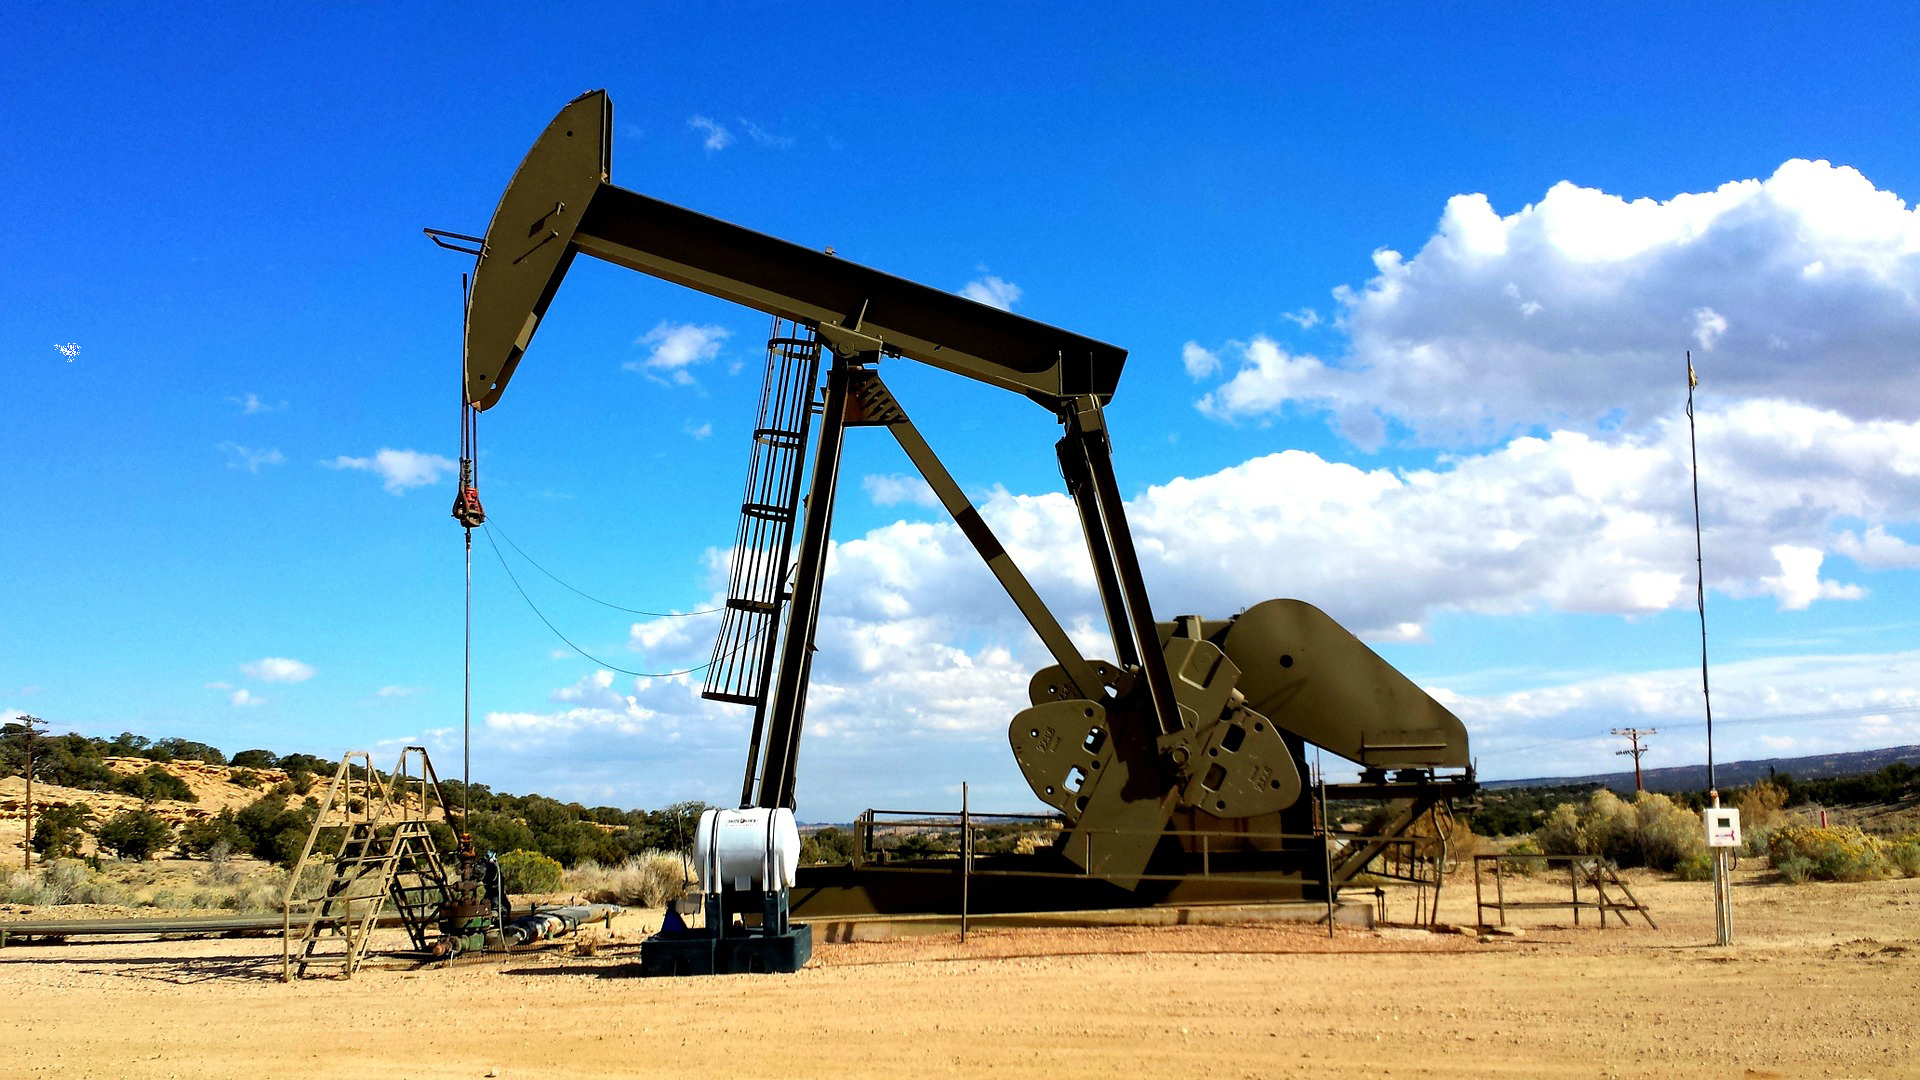
On 11 August US Energy reported results for the second quarter of 2026. Revenue came in at $2.134 million, up 5.2% year over year after a 26.9% decline the quarter before, while EBITDA remained negative at -$1.793 million and the net loss was $2.279 million. The loss halved, but it still reflects a company under construction rather than an operating business; with a market cap of $77.4 million and negative equity, the share does not look attractive on earnings, and the verdict is unattractive.
Key takeaways
— Revenue grew 5.2% year over year for the first time in a year, but that is a low-base effect after a 66.5% decline
— EBITDA loss narrowed to $1.793 million, and almost all of it is construction spending, not production
— The net loss of $2.279 million halved, but a year earlier it included a $2.8 million impairment
— The company spent $9.6 million on the project in the half-year and lives on cash and a credit line, not operating cash flow
— Debt rose to $4.5 million, but a net cash position of $1.291 million still lets it fund construction
— The share rose 18.2% on the report day and 21.9% since publication, though nothing changed fundamentally
— Valuation on earnings is impossible – the company is loss-making, and at a $77.4 million market cap the market is paying for a future helium project
Attractiveness
Key figures, USD bn
| Metric | Q2 2025 | Q2 2026 | Change |
|---|---|---|---|
| Revenue | 0.00 | 0.00 | +5.2% |
| EBITDA | -0.01 | -0.00 | — |
| Operating profit | -0.01 | -0.00 | — |
| Net profit | -0.01 | -0.00 | — |
| Operating cash flow | -0.00 | -0.00 | — |
| Capex | 0.00 | 0.00 | — |
| EBITDA margin | -252.5% | -84.0% | +168.5 pp |
| Net margin | -298.7% | -106.8% | +191.9 pp |
Revenue grew 5.2% year over year for the first time in a year, but that is a low-base effect after a 66.5% decline
In the second quarter of 2026 revenue was $2.134 million, up 5.2% year over year. This is the first acceleration after four quarters of decline: revenue fell 59.3% in Q1 2025, 66.5% in Q2, 64.9% in Q3 and 26.9% in Q1 2026. The switch to positive means the comparison base became low, not that the business returned to growth.
In the release the company attributes the dynamics to the completion of its mature oil asset divestiture programme: divestitures and natural production decline accounted for substantially all of the quarter-over-quarter variance. Production in Q2 was 33,747 barrels of oil equivalent versus 48,816 a year earlier, a decline of about a third. Revenue grew only because the average realised price rose to $63.24 per BOE from $41.54 a year earlier.
For an investor this means the top line no longer reflects the future business. The company is selling its oil base to fund the helium project, and until the project delivers first gas, revenue will swing with oil prices and remaining production. First helium revenue is expected only in the first quarter of 2027, according to management.
Revenue and EBITDA by quarter
| Period | Measure | bn USD |
|---|---|---|
| Q2 2024 | Revenue | 0.006046 |
| Q3 2024 | Revenue | 0.004957 |
| Q1 2025 | Revenue | 0.002193 |
| Q2 2025 | Revenue | 0.002028 |
| Q3 2025 | Revenue | 0.001738 |
| Q4 2025 | Revenue | 0.0013939999999999998 |
| Q1 2026 | Revenue | 0.0016040000000000002 |
| Q2 2026 | Revenue | 0.002134 |
| Q2 2024 | EBITDA | 0.00044900000000000007 |
| Q3 2024 | EBITDA | −0.00212 |
| Q1 2025 | EBITDA | −0.0019690000000000003 |
| Q2 2025 | EBITDA | −0.005121 |
| Q3 2025 | EBITDA | −0.002563 |
| Q4 2025 | EBITDA | −0.001099 |
| Q1 2026 | EBITDA | −0.002585 |
| Q2 2026 | EBITDA | −0.0017929999999999997 |
EBITDA margin
| Period | Measure | % |
|---|---|---|
| Q2 2024 | EBITDA margin | 7.4 |
| Q3 2024 | EBITDA margin | −42.8 |
| Q1 2025 | EBITDA margin | −89.8 |
| Q2 2025 | EBITDA margin | −252.5 |
| Q3 2025 | EBITDA margin | −147.5 |
| Q4 2025 | EBITDA margin | −78.8 |
| Q1 2026 | EBITDA margin | −161.2 |
| Q2 2026 | EBITDA margin | −84.0 |
EBITDA loss narrowed to $1.793 million, and almost all of it is construction spending, not production
EBITDA in Q2 2026 was -$1.793 million versus -$5.121 million a year earlier. The EBITDA margin improved from -252.5% to -84.0% – the loss became smaller relative to revenue but remains deeply negative. The operating loss narrowed to $2.385 million from $6.239 million a year earlier.
The main driver of the improvement is not revenue growth but cost reduction. Lease operating expense fell to $995 thousand from $1,520 thousand, depreciation to $591 thousand from $1,118 thousand, and a year earlier the report included a $2,760 thousand impairment of oil and gas properties. At the same time general and administrative expenses rose to $2,647 thousand from $2,246 thousand: the company is paying for legal, technical and advisory work on the project, the EPC contract and the helium offtake agreement.
The company's own adjusted EBITDA was -$0.9 million versus -$1.3 million a year earlier. The gap to reported EBITDA is non-cash items: stock-based compensation of $845 thousand and a $52 thousand loss on marketable securities. The point is the same: even excluding non-cash charges, the company spends more than it earns, and the gap is covered by cash and the credit facility.
Net profit by quarter
| Period | Measure | bn USD |
|---|---|---|
| Q2 2024 | Net profit | −0.001974 |
| Q3 2024 | Net profit | −0.002247 |
| Q1 2025 | Net profit | −0.003111 |
| Q2 2025 | Net profit | −0.006058 |
| Q3 2025 | Net profit | −0.0033410000000000002 |
| Q4 2025 | Net profit | −0.0018640000000000002 |
| Q1 2026 | Net profit | −0.003185 |
| Q2 2026 | Net profit | −0.0022789999999999998 |
The net loss of $2.279 million halved, but a year earlier it included a $2.8 million impairment
The net loss in Q2 2026 was $2.279 million versus $6.058 million a year earlier. The net margin improved from -298.7% to -106.8%. At first glance this is a strong improvement, but half of it is explained by a $2,760 thousand impairment of oil and gas properties in the prior-year report that is absent now.
Excluding that impairment from the comparison base, the loss narrowed much more modestly. Lower lease expense and depreciation also helped, as did a $167 thousand gain on commodity derivatives. Interest expense fell to $10 thousand from $47 thousand as the company repaid part of its debt.
Per share the loss was $0.04 versus $0.19 a year earlier, but the share count rose to 52.4 million from 32.7 million after the March 2026 offering. So the per-share loss narrowed not only because the loss was smaller but because earnings are spread over more shares. For the shareholder this is dilution that has already happened.
Net debt
at each reporting date
| Period | Measure | bn USD |
|---|---|---|
| Q2 2024 | Net debt | 0.0048070000000000005 |
| Q3 2024 | Net debt | −0.000603 |
| Q1 2025 | Net debt | −0.010003 |
| Q2 2025 | Net debt | −0.006423 |
| Q3 2025 | Net debt | −0.00126 |
| Q4 2025 | Net debt | 0.002281 |
| Q1 2026 | Net debt | −0.007905 |
| Q2 2026 | Net debt | −0.001291000000000001 |
The company spent $9.6 million on the project in the half-year and lives on cash and a credit line, not operating cash flow
Operating cash flow in Q2 2026 was negative at -$0.8 million, and over the trailing twelve months it was -$4.3 million. This is not a one-off: the company has spent more on operations than it earned for several quarters. In the first half of 2026 operating cash flow was -$3.252 million per the cash flow statement.
Investment is rising. In the first half of 2026 the company spent $9.6 million on industrial gas capital expenditures versus $2.5 million a year earlier, and $9.7 million in total on the Big Sky project in the half-year. In Q2 capex was modest at $0.1 million, but only because most of it fell in Q1. Construction is funded not from operating cash flow but from the equity offering and the credit line.
In March 2026 the company raised $8.086 million in an underwritten offering and another $9.103 million under a committed equity facility. That money keeps construction going. Without it, negative operating cash flow would mean the company is eating its cash balance. There is cash – $5.987 million at the end of June – but it is shrinking, and the next report will show whether it lasts until first gas.
Debt rose to $4.5 million, but a net cash position of $1.291 million still lets it fund construction
As of 30 June 2026 net debt was negative at -$1.291 million, meaning cash exceeded debt. That is better than a quarter earlier, when net debt was -$7.905 million, and better than a year earlier at -$6.423 million. The improvement comes from the equity offering and the committed equity facility, which replenished cash faster than capex grew.
Debt itself rose: the credit facility increased to $4.5 million from $2.5 million at the end of 2025. In April 2026 the company doubled the borrowing base to $20 million, fixed the margin at 200 basis points over the base rate and suspended covenant testing through the end of Q1 2027. That gives flexibility during construction but means debt will keep rising.
After the report, on 4 August 2026, the company drew another $4.0 million, bringing total debt to $8.5 million. Cash on the same date was $4.9 million and available liquidity $16.4 million. So the net cash position at the end of June no longer reflects the current situation: debt is growing faster than cash, and by first gas the company may arrive with net debt rather than net cash.
Share price, three years
close, last point 2026-11-03
| Period | Measure | USD per share |
|---|---|---|
| 2025-11-03 | Closing price | 1.1699999570846558 |
| 2025-11-04 | Closing price | 1.1200000047683716 |
| 2025-11-05 | Closing price | 1.1299999952316284 |
| 2025-11-06 | Closing price | 1.090000033378601 |
| 2025-11-07 | Closing price | 1.059999942779541 |
| 2025-11-10 | Closing price | 1.0800000429153442 |
| 2025-11-11 | Closing price | 1.1299999952316284 |
| 2025-11-12 | Closing price | 1.0499999523162842 |
| 2025-11-13 | Closing price | 1.0499999523162842 |
| 2025-11-14 | Closing price | 1.0499999523162842 |
| 2025-11-17 | Closing price | 1.0299999713897705 |
| 2025-11-18 | Closing price | 1.0700000524520874 |
| 2025-11-19 | Closing price | 1.0 |
| 2025-11-20 | Closing price | 0.9599999785423279 |
| 2025-11-21 | Closing price | 0.9800000190734863 |
| 2025-11-24 | Closing price | 1.0199999809265137 |
| 2025-11-25 | Closing price | 0.9900000095367432 |
| 2025-11-26 | Closing price | 1.0 |
| 2025-11-28 | Closing price | 0.9800000190734863 |
| 2025-12-01 | Closing price | 1.0199999809265137 |
| 2025-12-02 | Closing price | 0.9700000286102295 |
| 2025-12-03 | Closing price | 0.9900000095367432 |
| 2025-12-04 | Closing price | 1.0099999904632568 |
| 2025-12-05 | Closing price | 1.059999942779541 |
| 2025-12-08 | Closing price | 1.0099999904632568 |
| 2025-12-09 | Closing price | 1.0399999618530273 |
| 2025-12-10 | Closing price | 1.0199999809265137 |
| 2025-12-11 | Closing price | 0.9900000095367432 |
| 2025-12-12 | Closing price | 0.9800000190734863 |
| 2025-12-15 | Closing price | 0.949999988079071 |
| 2025-12-16 | Closing price | 0.9399999976158142 |
| 2025-12-17 | Closing price | 0.9900000095367432 |
| 2025-12-18 | Closing price | 0.9399999976158142 |
| 2025-12-19 | Closing price | 0.9200000166893005 |
| 2025-12-22 | Closing price | 0.9900000095367432 |
| 2025-12-23 | Closing price | 1.0099999904632568 |
| 2025-12-24 | Closing price | 0.9700000286102295 |
| 2025-12-26 | Closing price | 0.9399999976158142 |
| 2025-12-29 | Closing price | 0.9800000190734863 |
| 2025-12-30 | Closing price | 0.949999988079071 |
| 2025-12-31 | Closing price | 0.9200000166893005 |
| 2026-01-02 | Closing price | 0.9599999785423279 |
| 2026-01-05 | Closing price | 0.9900000095367432 |
| 2026-01-06 | Closing price | 0.9800000190734863 |
| 2026-01-07 | Closing price | 0.9700000286102295 |
| 2026-01-08 | Closing price | 1.0499999523162842 |
| 2026-01-09 | Closing price | 1.0299999713897705 |
| 2026-01-12 | Closing price | 1.0099999904632568 |
| 2026-01-13 | Closing price | 0.9900000095367432 |
| 2026-01-14 | Closing price | 1.059999942779541 |
| 2026-01-15 | Closing price | 1.0099999904632568 |
| 2026-01-16 | Closing price | 1.0399999618530273 |
| 2026-01-20 | Closing price | 1.0099999904632568 |
| 2026-01-21 | Closing price | 0.9900000095367432 |
| 2026-01-22 | Closing price | 1.0 |
| 2026-01-23 | Closing price | 1.0 |
| 2026-01-26 | Closing price | 0.9800000190734863 |
| 2026-01-27 | Closing price | 1.0 |
| 2026-01-28 | Closing price | 1.1299999952316284 |
| 2026-01-29 | Closing price | 1.149999976158142 |
| 2026-01-30 | Closing price | 1.0800000429153442 |
| 2026-02-02 | Closing price | 1.0 |
| 2026-02-03 | Closing price | 1.0399999618530273 |
| 2026-02-04 | Closing price | 1.059999942779541 |
| 2026-02-05 | Closing price | 1.0099999904632568 |
| 2026-02-06 | Closing price | 1.0700000524520874 |
| 2026-02-09 | Closing price | 1.059999942779541 |
| 2026-02-10 | Closing price | 1.0199999809265137 |
| 2026-02-11 | Closing price | 1.0099999904632568 |
| 2026-02-12 | Closing price | 0.9599999785423279 |
| 2026-02-13 | Closing price | 1.0 |
| 2026-02-17 | Closing price | 0.9700000286102295 |
| 2026-02-18 | Closing price | 1.0399999618530273 |
| 2026-02-19 | Closing price | 1.0499999523162842 |
| 2026-02-20 | Closing price | 1.0199999809265137 |
| 2026-02-23 | Closing price | 1.0099999904632568 |
| 2026-02-24 | Closing price | 0.9900000095367432 |
| 2026-02-25 | Closing price | 1.0299999713897705 |
| 2026-02-26 | Closing price | 1.0099999904632568 |
| 2026-02-27 | Closing price | 1.0700000524520874 |
| 2026-03-02 | Closing price | 1.149999976158142 |
| 2026-03-03 | Closing price | 1.4299999475479126 |
| 2026-03-04 | Closing price | 1.1100000143051147 |
| 2026-03-05 | Closing price | 1.149999976158142 |
| 2026-03-06 | Closing price | 1.149999976158142 |
| 2026-03-09 | Closing price | 1.0499999523162842 |
| 2026-03-10 | Closing price | 1.0800000429153442 |
| 2026-03-11 | Closing price | 1.0499999523162842 |
| 2026-03-12 | Closing price | 1.0499999523162842 |
| 2026-03-13 | Closing price | 1.059999942779541 |
| 2026-03-16 | Closing price | 1.0499999523162842 |
| 2026-03-17 | Closing price | 1.0099999904632568 |
| 2026-03-18 | Closing price | 1.0199999809265137 |
| 2026-03-19 | Closing price | 1.0199999809265137 |
| 2026-03-20 | Closing price | 0.9900000095367432 |
| 2026-03-23 | Closing price | 0.9599999785423279 |
| 2026-03-24 | Closing price | 1.0 |
| 2026-03-25 | Closing price | 1.0199999809265137 |
| 2026-03-26 | Closing price | 1.0099999904632568 |
| 2026-03-27 | Closing price | 1.0299999713897705 |
| 2026-03-30 | Closing price | 0.949999988079071 |
| 2026-03-31 | Closing price | 0.8799999952316284 |
| 2026-04-01 | Closing price | 0.8799999952316284 |
| 2026-04-02 | Closing price | 0.8500000238418579 |
| 2026-04-06 | Closing price | 0.8700000047683716 |
| 2026-04-07 | Closing price | 0.8799999952316284 |
| 2026-04-08 | Closing price | 0.7599999904632568 |
| 2026-04-09 | Closing price | 0.7300000190734863 |
| 2026-04-10 | Closing price | 0.6899999976158142 |
| 2026-04-13 | Closing price | 0.75 |
| 2026-04-14 | Closing price | 0.7300000190734863 |
| 2026-04-15 | Closing price | 0.75 |
| 2026-04-16 | Closing price | 0.7699999809265137 |
| 2026-04-17 | Closing price | 0.7099999785423279 |
| 2026-04-20 | Closing price | 0.7599999904632568 |
| 2026-04-21 | Closing price | 0.8199999928474426 |
| 2026-04-22 | Closing price | 0.8299999833106995 |
| 2026-04-23 | Closing price | 0.8999999761581421 |
| 2026-04-24 | Closing price | 0.9300000071525574 |
| 2026-04-27 | Closing price | 1.059999942779541 |
| 2026-04-28 | Closing price | 1.0299999713897705 |
| 2026-04-29 | Closing price | 1.100000023841858 |
| 2026-04-30 | Closing price | 1.090000033378601 |
| 2026-05-01 | Closing price | 1.1299999952316284 |
| 2026-05-04 | Closing price | 1.1299999952316284 |
| 2026-05-05 | Closing price | 1.1100000143051147 |
| 2026-05-06 | Closing price | 1.0099999904632568 |
| 2026-05-07 | Closing price | 0.9700000286102295 |
| 2026-05-08 | Closing price | 0.949999988079071 |
| 2026-05-11 | Closing price | 0.9300000071525574 |
| 2026-05-12 | Closing price | 0.9300000071525574 |
| 2026-05-13 | Closing price | 0.8999999761581421 |
| 2026-05-14 | Closing price | 0.9399999976158142 |
| 2026-05-15 | Closing price | 0.9700000286102295 |
| 2026-05-18 | Closing price | 0.949999988079071 |
| 2026-05-19 | Closing price | 0.9100000262260437 |
| 2026-05-20 | Closing price | 0.8999999761581421 |
| 2026-05-21 | Closing price | 0.8799999952316284 |
| 2026-05-22 | Closing price | 0.9700000286102295 |
| 2026-05-26 | Closing price | 0.9700000286102295 |
| 2026-05-27 | Closing price | 0.949999988079071 |
| 2026-05-28 | Closing price | 1.0199999809265137 |
| 2026-05-29 | Closing price | 1.0 |
| 2026-06-01 | Closing price | 1.0700000524520874 |
| 2026-06-02 | Closing price | 1.0800000429153442 |
| 2026-06-03 | Closing price | 1.059999942779541 |
| 2026-06-04 | Closing price | 1.090000033378601 |
| 2026-06-05 | Closing price | 0.9900000095367432 |
| 2026-06-08 | Closing price | 0.9900000095367432 |
| 2026-06-09 | Closing price | 1.0199999809265137 |
| 2026-06-10 | Closing price | 1.1100000143051147 |
| 2026-06-11 | Closing price | 1.059999942779541 |
| 2026-06-12 | Closing price | 1.0299999713897705 |
| 2026-06-15 | Closing price | 1.0199999809265137 |
| 2026-06-16 | Closing price | 1.0199999809265137 |
| 2026-06-17 | Closing price | 1.090000033378601 |
| 2026-06-18 | Closing price | 1.0199999809265137 |
| 2026-06-22 | Closing price | 1.0399999618530273 |
| 2026-06-23 | Closing price | 1.059999942779541 |
| 2026-06-24 | Closing price | 1.0 |
| 2026-06-25 | Closing price | 1.059999942779541 |
| 2026-06-26 | Closing price | 1.059999942779541 |
| 2026-06-29 | Closing price | 1.0700000524520874 |
| 2026-06-30 | Closing price | 1.100000023841858 |
| 2026-07-01 | Closing price | 1.0800000429153442 |
| 2026-07-02 | Closing price | 1.100000023841858 |
| 2026-07-06 | Closing price | 1.1200000047683716 |
| 2026-07-07 | Closing price | 1.1299999952316284 |
| 2026-07-08 | Closing price | 1.1100000143051147 |
| 2026-07-09 | Closing price | 1.1200000047683716 |
| 2026-07-10 | Closing price | 1.1299999952316284 |
| 2026-07-13 | Closing price | 1.2000000476837158 |
| 2026-07-14 | Closing price | 1.190000057220459 |
| 2026-07-15 | Closing price | 1.25 |
| 2026-07-16 | Closing price | 1.309999942779541 |
| 2026-07-17 | Closing price | 1.399999976158142 |
| 2026-07-20 | Closing price | 1.3700000047683716 |
| 2026-07-21 | Closing price | 1.3700000047683716 |
| 2026-07-22 | Closing price | 1.3600000143051147 |
| 2026-07-23 | Closing price | 1.3600000143051147 |
| 2026-07-24 | Closing price | 1.2799999713897705 |
| 2026-07-27 | Closing price | 1.2000000476837158 |
| 2026-07-28 | Closing price | 1.1100000143051147 |
| 2026-07-29 | Closing price | 1.1200000047683716 |
| 2026-07-30 | Closing price | 1.1200000047683716 |
| 2026-07-31 | Closing price | 1.1399999856948853 |
| 2026-08-03 | Closing price | 1.1299999952316284 |
| 2026-08-04 | Closing price | 1.190000057220459 |
| 2026-08-05 | Closing price | 1.2000000476837158 |
| 2026-08-06 | Closing price | 1.2000000476837158 |
| 2026-08-07 | Closing price | 1.2100000381469727 |
| 2026-08-10 | Closing price | 1.2100000381469727 |
| 2026-08-11 | Closing price | 1.4299999475479126 |
| 2026-08-12 | Closing price | 1.3899999856948853 |
| 2026-08-13 | Closing price | 1.3600000143051147 |
| 2026-08-14 | Closing price | 1.4299999475479126 |
| 2026-08-17 | Closing price | 1.4199999570846558 |
| 2026-08-18 | Closing price | 1.3899999856948853 |
| 2026-08-19 | Closing price | 1.399999976158142 |
| 2026-08-20 | Closing price | 1.399999976158142 |
| 2026-08-21 | Closing price | 1.399999976158142 |
| 2026-08-24 | Closing price | 1.4800000190734863 |
| 2026-08-25 | Closing price | 1.4800000190734863 |
| 2026-08-26 | Closing price | 1.5800000429153442 |
| 2026-08-27 | Closing price | 1.5099999904632568 |
| 2026-08-28 | Closing price | 1.4600000381469727 |
| 2026-08-31 | Closing price | 1.5199999809265137 |
| 2026-09-01 | Closing price | 1.5099999904632568 |
| 2026-09-02 | Closing price | 1.5499999523162842 |
| 2026-09-03 | Closing price | 1.559999942779541 |
| 2026-09-04 | Closing price | 1.5399999618530273 |
| 2026-09-08 | Closing price | 1.5199999809265137 |
| 2026-09-09 | Closing price | 1.600000023841858 |
| 2026-09-10 | Closing price | 1.6299999952316284 |
| 2026-09-11 | Closing price | 1.5700000524520874 |
| 2026-09-14 | Closing price | 1.649999976158142 |
| 2026-09-15 | Closing price | 1.6200000047683716 |
| 2026-09-16 | Closing price | 1.5299999713897705 |
| 2026-09-17 | Closing price | 1.5700000524520874 |
| 2026-09-18 | Closing price | 1.5700000524520874 |
| 2026-09-21 | Closing price | 1.590000033378601 |
| 2026-09-22 | Closing price | 1.5199999809265137 |
| 2026-09-23 | Closing price | 1.4700000286102295 |
| 2026-09-24 | Closing price | 1.5499999523162842 |
| 2026-09-25 | Closing price | 1.440000057220459 |
| 2026-09-28 | Closing price | 1.3799999952316284 |
| 2026-09-29 | Closing price | 1.399999976158142 |
| 2026-09-30 | Closing price | 1.409999966621399 |
| 2026-10-01 | Closing price | 1.4299999475479126 |
| 2026-10-02 | Closing price | 1.4199999570846558 |
| 2026-10-05 | Closing price | 1.4600000381469727 |
| 2026-10-06 | Closing price | 1.4500000476837158 |
| 2026-10-07 | Closing price | 1.4299999475479126 |
| 2026-10-08 | Closing price | 1.4500000476837158 |
| 2026-10-09 | Closing price | 1.4600000381469727 |
| 2026-10-12 | Closing price | 1.4500000476837158 |
| 2026-10-13 | Closing price | 1.4500000476837158 |
| 2026-10-14 | Closing price | 1.409999966621399 |
| 2026-10-15 | Closing price | 1.3899999856948853 |
| 2026-10-16 | Closing price | 1.4199999570846558 |
| 2026-10-19 | Closing price | 1.4600000381469727 |
| 2026-10-20 | Closing price | 1.4500000476837158 |
| 2026-10-21 | Closing price | 1.5 |
| 2026-10-22 | Closing price | 1.5199999809265137 |
| 2026-10-23 | Closing price | 1.5499999523162842 |
| 2026-10-26 | Closing price | 1.559999942779541 |
| 2026-10-27 | Closing price | 1.5800000429153442 |
| 2026-10-28 | Closing price | 1.5700000524520874 |
| 2026-10-29 | Closing price | 1.559999942779541 |
| 2026-10-30 | Closing price | 1.5199999809265137 |
| 2026-11-02 | Closing price | 1.4800000190734863 |
| 2026-11-03 | Closing price | 1.475000023841858 |
The share rose 18.2% on the report day and 21.9% since publication, though nothing changed fundamentally
Before the release the share closed at $1.21 and rose 18.2% on the report day. From publication to 3 November 2026 the gain was 21.9%. The market reacted not to the numbers – they remained loss-making – but to construction progress and the signed helium offtake agreement.
There is genuine cause for optimism in the report: on 27 April 2026 the company signed a five-year, 100% take-or-pay helium agreement with an investment-grade counterparty at a fixed $285 per Mcf at the plant gate. The counterparty handles transport and logistics, and the company receives the full price at the plant. That creates contracted revenue from Q1 2027.
But first gas still requires completing construction, obtaining MRV approvals and commissioning the plant. The company expects approvals in the coming months and commissioning in late 2026. Any delay pushes first revenue back, and the market, judging by the 21.9% gain, has already priced in success. With a $77.4 million market cap and a trailing-twelve-month loss, valuation does not rest on earnings – it rests on expectations.
Valuation on earnings is impossible – the company is loss-making, and at a $77.4 million market cap the market is paying for a future helium project
The company's market cap is $77.4 million with negative equity and a trailing-twelve-month loss. P/E does not apply here, and neither does EV/EBITDA, because EBITDA is negative. The market is valuing not the current business but the future helium project, which will deliver first revenue only in Q1 2027.
Comparison with its own history is impossible: the FACTS contain no historical multiples for the company, and current negative metrics provide no basis for comparison. The only reference point is the share price: $1.21 before the report and a 21.9% gain after. That means the market has already priced in a successful project launch, and any delay will be painful.
For an investor who believes in the helium project, this is a story about execution, not current earnings. For anyone reading the report, the picture is the opposite: a loss, negative operating cash flow, rising debt and shareholder dilution. With a $77.4 million market cap and no earnings, the share does not look attractive at current levels.
Valuation on the latest reported figures
| Metric | Value |
|---|---|
| Market cap | 0.08 bn USD |
| P/B | 3.20 |
| Operating cash flow (LTM) | -0.00 bn |
| ROE | -24.1% |
Bottom line
What was genuinely strong in the report was the narrowing of the loss: EBITDA improved from -$5.121 million to -$1.793 million, and the net loss from $6.058 million to $2.279 million. But half of that improvement is a base effect: a year earlier the report included a $2.8 million impairment that is absent now. The real question for a holder is not how much the loss narrowed but whether cash and the credit line will last until first gas in Q1 2027. With a $77.4 million market cap, negative operating cash flow and rising debt, the share does not look attractive; the verdict is unattractive.