US Energy: revenue accelerated to +12.5%, but the loss widened to $3.5 million
Contents
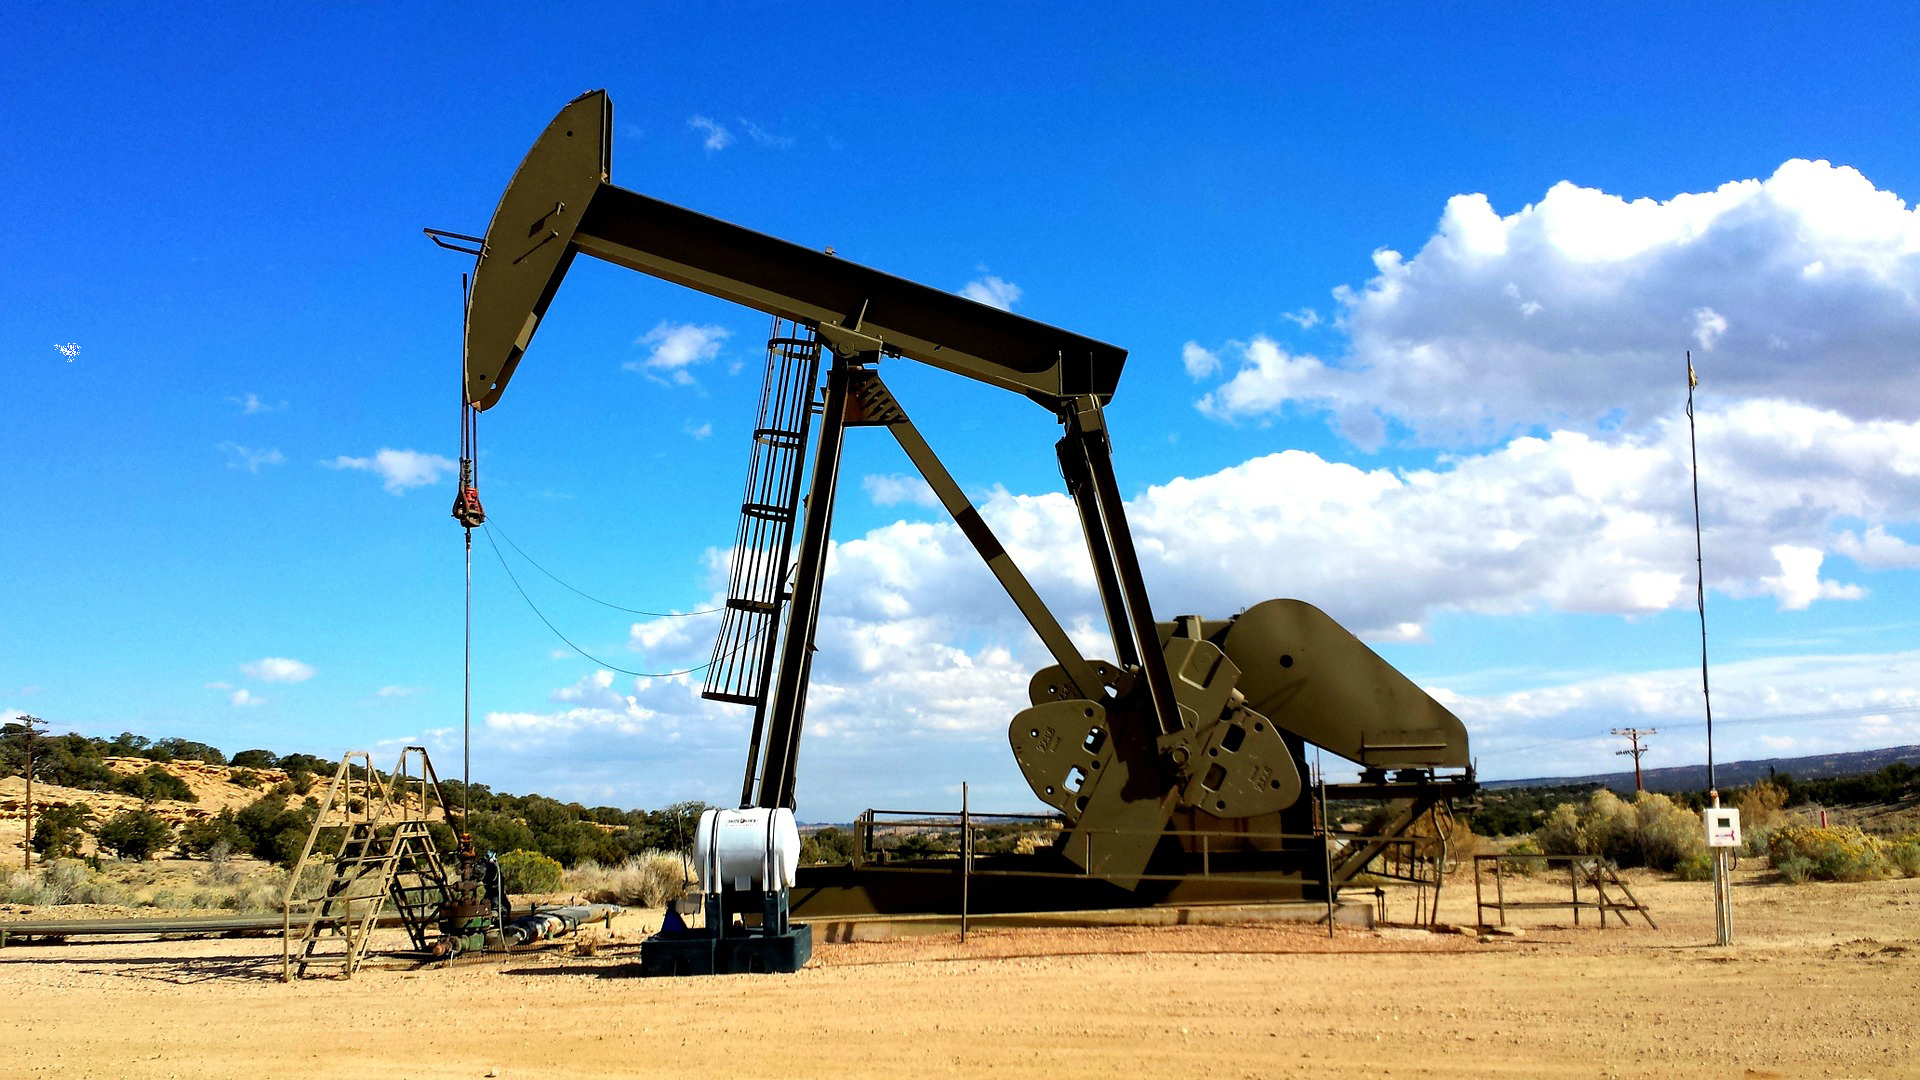
On November 10, US Energy released its third-quarter 2026 results. Revenue came in at $1.955 million, up 12.5% year on year and accelerating from 5.2% in the second quarter, while EBITDA remained negative at -$2.603 million and the net loss widened to $3.496 million from $3.341 million a year earlier. Revenue growth is not converting into profit: the EBITDA loss is holding around $2.6 million, and net debt rose from $2.071 million at the start of the year to $5.844 million. Our conclusion: rather unattractive – with a market capitalisation of $69.8 million and negative EBITDA, the share has no profitable base to stand on. Our view: the share is rather unattractive at the current price.
Our view: is there upside
Our view in numbers
| Metric | Our read |
|---|---|
| Verdict | Rather unattractive |
| Upside on the portal model | no portal model for this share |
| Strongest case for | Revenue accelerated to +12.5% year on year, and the helium contract at a fixed $285 per Mcf for five years on 100% take-or-pay terms provides contracted revenue from first production. |
| Strongest case against | EBITDA is negative at -$2.603 million for the quarter, the net loss widened to $3.496 million, and net debt rose from $2.071 million to $5.844 million against negative operating cash flow. |
| What would change the view | The verdict would move one step up if first output at Big Sky in spring 2027 starts generating revenue and quarterly EBITDA turns positive. |
Key takeaways
— Revenue accelerated to +12.5% on a higher oil price, not on volumes
— The $2.603 million EBITDA loss swallowed the entire revenue increase
— The net loss widened to $3.496 million, and a year earlier it was cushioned by a one-off impairment
— Net debt rose from $2.071 million to $5.844 million against negative operating cash flow
— The $15.17 million of nine-month capex was funded by equity offerings, not by operations
— With a $69.8 million market cap and negative EBITDA, the multiple cannot be computed
Key figures, USD bn
| Metric | Q3 2025 | Q3 2026 | Change |
|---|---|---|---|
| Revenue | 0.00 | 0.00 | +12.5% |
| EBITDA | -0.00 | -0.00 | — |
| Operating profit | -0.00 | -0.00 | — |
| Net profit | -0.00 | -0.00 | — |
| Operating cash flow | -0.00 | -0.00 | — |
| Capex | 0.00 | — | — |
| EBITDA margin | -147.5% | -133.1% | +14.4 pp |
| Net margin | -192.2% | -178.8% | +13.4 pp |
Revenue accelerated to +12.5% on a higher oil price, not on volumes
Third-quarter 2026 revenue was $1.955 million against $1.738 million a year earlier, up 12.5%. That is an acceleration from 5.2% in the second quarter: the company has passed the trough, when revenue in the third quarter of 2025 was shrinking by 64.9%.
The increase came from price, not volume. The average realised price rose to $63.83 per barrel of oil equivalent from $49.20 a year earlier, while production fell to 30,628 barrels of oil equivalent from 35,326. Oil contributed $1.810 million of the $1.955 million in revenue, or 93%.
The company attributes the volume decline to the 2025 sale of its Wyoming and West Texas properties and to natural declines in the remaining assets. The legacy asset monetisation programme funded the pivot to gas, helium and carbon management, but for now it is the oil segment that carries revenue.
Revenue and EBITDA by quarter
| Period | Measure | bn USD |
|---|---|---|
| Q3 2024 | Revenue | 0.004957 |
| Q1 2025 | Revenue | 0.002193 |
| Q2 2025 | Revenue | 0.002028 |
| Q3 2025 | Revenue | 0.001738 |
| Q4 2025 | Revenue | 0.0013939999999999998 |
| Q1 2026 | Revenue | 0.0016040000000000002 |
| Q2 2026 | Revenue | 0.002134 |
| Q3 2026 | Revenue | 0.001955 |
| Q3 2024 | EBITDA | −0.00212 |
| Q1 2025 | EBITDA | −0.0019690000000000003 |
| Q2 2025 | EBITDA | −0.005121 |
| Q3 2025 | EBITDA | −0.002563 |
| Q4 2025 | EBITDA | −0.001099 |
| Q1 2026 | EBITDA | −0.002585 |
| Q2 2026 | EBITDA | −0.0017929999999999997 |
| Q3 2026 | EBITDA | −0.002603 |
EBITDA margin
| Period | Measure | % |
|---|---|---|
| Q3 2024 | EBITDA margin | −42.8 |
| Q1 2025 | EBITDA margin | −89.8 |
| Q2 2025 | EBITDA margin | −252.5 |
| Q3 2025 | EBITDA margin | −147.5 |
| Q4 2025 | EBITDA margin | −78.8 |
| Q1 2026 | EBITDA margin | −161.2 |
| Q2 2026 | EBITDA margin | −84.0 |
| Q3 2026 | EBITDA margin | −133.1 |
The $2.603 million EBITDA loss swallowed the entire revenue increase
Third-quarter 2026 EBITDA was negative at -$2.603 million, a margin of -133.1%. A year earlier it was -$2.563 million and -147.5%: the loss in absolute terms barely moved, and the margin improved only because the revenue base grew.
The operating loss was $3.133 million against $3.379 million a year earlier. The main driver was lease operating expense: $2.110 million against $1.045 million. About $1.2 million of that was remediation of a produced-fluids release from a gathering line in the legacy oil assets, identified and remediated during the quarter.
The company filed a claim under its general liability policy, which covers up to $1.0 million of clean-up costs after a $0.1 million deductible. Because the claim is not yet approved, no insurance receivable was recognised at September 30. Excluding these costs, lease operating expense would have been $0.9 million, or $29.71 per barrel of oil equivalent against $29.58 a year earlier – the underlying cost base did not change.
Adjusted EBITDA, which excludes the $1.2 million of environmental remediation costs, was -$0.8 million against -$1.3 million a year earlier. It is the only measure that improved, but it is stripped of a one-off event and does not change the fact that the GAAP loss remains.
Net profit by quarter
| Period | Measure | bn USD |
|---|---|---|
| Q3 2024 | Net profit | −0.002247 |
| Q1 2025 | Net profit | −0.003111 |
| Q2 2025 | Net profit | −0.006058 |
| Q3 2025 | Net profit | −0.0033410000000000002 |
| Q4 2025 | Net profit | −0.0018640000000000002 |
| Q1 2026 | Net profit | −0.003185 |
| Q2 2026 | Net profit | −0.0022789999999999998 |
| Q3 2026 | Net profit | −0.003496 |
The net loss widened to $3.496 million, and a year earlier it was cushioned by a one-off impairment
The third-quarter 2026 net loss was $3.496 million against $3.341 million a year earlier, a net margin of -178.8% against -192.2%. Loss per share narrowed to $0.07 from $0.10 only because the share count rose to 52.5 million from 32.8 million.
The year-ago base included a $0.9 million impairment of oil and natural gas properties. Without it, the third-quarter 2025 loss would have been smaller, and the current deterioration is less dramatic than the report suggests. In the current quarter the company names no one-off items comparable in size to the net loss, apart from the environmental remediation costs within lease operating expense.
Return on equity is negative at -39.3%. The accumulated deficit rose to $220.872 million against shareholders' equity of $34.137 million: losses have piled up over years, and the current quarter continues that line.
Net debt rose from $2.071 million to $5.844 million against negative operating cash flow
Net debt at September 30, 2026 was $5.844 million against $2.071 million at the end of 2025. Total debt rose from $2.5 million to $8.5 million, while cash rose from $0.429 million to $2.915 million. The debt increase funded construction, not operations.
Third-quarter 2026 operating cash flow was negative at -$1.512 million. For the nine months it was -$4.764 million. Negative cash flow against rising revenue means working capital and costs are consuming revenue faster than it arrives.
The company puts liquidity at $14.4 million, including $2.915 million of cash and $11.5 million of undrawn capacity under its credit facility. That covers several quarters of current spending, but not completion of construction without new borrowing or equity issuance.
The $15.17 million of nine-month capex was funded by equity offerings, not by operations
In the nine months of 2026 the company spent $15.17 million on industrial gas properties and $0.485 million on oil and gas properties. Operating cash flow over the same period was negative at -$4.764 million. The gap was closed by financing: $8.086 million from an underwritten offering and $9.103 million from a committed equity facility.
Cash rose from $0.429 million to $2.915 million, but that rise was paid for with dilution: the share count rose to 52.5 million from 34.4 million at the end of 2025. The capex is going into the Big Sky Carbon Hub, whose first phase is due to produce first output in spring 2027.
The company says construction is on schedule: in-field gathering and injection lines are complete, equipment has been procured, and plant fabrication has begun. Until first production and first helium sales, operating cash flow will stay negative, and the need for new capital will persist.
Share price, three years
close, last point 2026-11-10
| Period | Measure | USD per share |
|---|---|---|
| 2025-11-10 | Closing price | 1.0800000429153442 |
| 2025-11-11 | Closing price | 1.1299999952316284 |
| 2025-11-12 | Closing price | 1.0499999523162842 |
| 2025-11-13 | Closing price | 1.0499999523162842 |
| 2025-11-14 | Closing price | 1.0499999523162842 |
| 2025-11-17 | Closing price | 1.0299999713897705 |
| 2025-11-18 | Closing price | 1.0700000524520874 |
| 2025-11-19 | Closing price | 1.0 |
| 2025-11-20 | Closing price | 0.9599999785423279 |
| 2025-11-21 | Closing price | 0.9800000190734863 |
| 2025-11-24 | Closing price | 1.0199999809265137 |
| 2025-11-25 | Closing price | 0.9900000095367432 |
| 2025-11-26 | Closing price | 1.0 |
| 2025-11-28 | Closing price | 0.9800000190734863 |
| 2025-12-01 | Closing price | 1.0199999809265137 |
| 2025-12-02 | Closing price | 0.9700000286102295 |
| 2025-12-03 | Closing price | 0.9900000095367432 |
| 2025-12-04 | Closing price | 1.0099999904632568 |
| 2025-12-05 | Closing price | 1.059999942779541 |
| 2025-12-08 | Closing price | 1.0099999904632568 |
| 2025-12-09 | Closing price | 1.0399999618530273 |
| 2025-12-10 | Closing price | 1.0199999809265137 |
| 2025-12-11 | Closing price | 0.9900000095367432 |
| 2025-12-12 | Closing price | 0.9800000190734863 |
| 2025-12-15 | Closing price | 0.949999988079071 |
| 2025-12-16 | Closing price | 0.9399999976158142 |
| 2025-12-17 | Closing price | 0.9900000095367432 |
| 2025-12-18 | Closing price | 0.9399999976158142 |
| 2025-12-19 | Closing price | 0.9200000166893005 |
| 2025-12-22 | Closing price | 0.9900000095367432 |
| 2025-12-23 | Closing price | 1.0099999904632568 |
| 2025-12-24 | Closing price | 0.9700000286102295 |
| 2025-12-26 | Closing price | 0.9399999976158142 |
| 2025-12-29 | Closing price | 0.9800000190734863 |
| 2025-12-30 | Closing price | 0.949999988079071 |
| 2025-12-31 | Closing price | 0.9200000166893005 |
| 2026-01-02 | Closing price | 0.9599999785423279 |
| 2026-01-05 | Closing price | 0.9900000095367432 |
| 2026-01-06 | Closing price | 0.9800000190734863 |
| 2026-01-07 | Closing price | 0.9700000286102295 |
| 2026-01-08 | Closing price | 1.0499999523162842 |
| 2026-01-09 | Closing price | 1.0299999713897705 |
| 2026-01-12 | Closing price | 1.0099999904632568 |
| 2026-01-13 | Closing price | 0.9900000095367432 |
| 2026-01-14 | Closing price | 1.059999942779541 |
| 2026-01-15 | Closing price | 1.0099999904632568 |
| 2026-01-16 | Closing price | 1.0399999618530273 |
| 2026-01-20 | Closing price | 1.0099999904632568 |
| 2026-01-21 | Closing price | 0.9900000095367432 |
| 2026-01-22 | Closing price | 1.0 |
| 2026-01-23 | Closing price | 1.0 |
| 2026-01-26 | Closing price | 0.9800000190734863 |
| 2026-01-27 | Closing price | 1.0 |
| 2026-01-28 | Closing price | 1.1299999952316284 |
| 2026-01-29 | Closing price | 1.149999976158142 |
| 2026-01-30 | Closing price | 1.0800000429153442 |
| 2026-02-02 | Closing price | 1.0 |
| 2026-02-03 | Closing price | 1.0399999618530273 |
| 2026-02-04 | Closing price | 1.059999942779541 |
| 2026-02-05 | Closing price | 1.0099999904632568 |
| 2026-02-06 | Closing price | 1.0700000524520874 |
| 2026-02-09 | Closing price | 1.059999942779541 |
| 2026-02-10 | Closing price | 1.0199999809265137 |
| 2026-02-11 | Closing price | 1.0099999904632568 |
| 2026-02-12 | Closing price | 0.9599999785423279 |
| 2026-02-13 | Closing price | 1.0 |
| 2026-02-17 | Closing price | 0.9700000286102295 |
| 2026-02-18 | Closing price | 1.0399999618530273 |
| 2026-02-19 | Closing price | 1.0499999523162842 |
| 2026-02-20 | Closing price | 1.0199999809265137 |
| 2026-02-23 | Closing price | 1.0099999904632568 |
| 2026-02-24 | Closing price | 0.9900000095367432 |
| 2026-02-25 | Closing price | 1.0299999713897705 |
| 2026-02-26 | Closing price | 1.0099999904632568 |
| 2026-02-27 | Closing price | 1.0700000524520874 |
| 2026-03-02 | Closing price | 1.149999976158142 |
| 2026-03-03 | Closing price | 1.4299999475479126 |
| 2026-03-04 | Closing price | 1.1100000143051147 |
| 2026-03-05 | Closing price | 1.149999976158142 |
| 2026-03-06 | Closing price | 1.149999976158142 |
| 2026-03-09 | Closing price | 1.0499999523162842 |
| 2026-03-10 | Closing price | 1.0800000429153442 |
| 2026-03-11 | Closing price | 1.0499999523162842 |
| 2026-03-12 | Closing price | 1.0499999523162842 |
| 2026-03-13 | Closing price | 1.059999942779541 |
| 2026-03-16 | Closing price | 1.0499999523162842 |
| 2026-03-17 | Closing price | 1.0099999904632568 |
| 2026-03-18 | Closing price | 1.0199999809265137 |
| 2026-03-19 | Closing price | 1.0199999809265137 |
| 2026-03-20 | Closing price | 0.9900000095367432 |
| 2026-03-23 | Closing price | 0.9599999785423279 |
| 2026-03-24 | Closing price | 1.0 |
| 2026-03-25 | Closing price | 1.0199999809265137 |
| 2026-03-26 | Closing price | 1.0099999904632568 |
| 2026-03-27 | Closing price | 1.0299999713897705 |
| 2026-03-30 | Closing price | 0.949999988079071 |
| 2026-03-31 | Closing price | 0.8799999952316284 |
| 2026-04-01 | Closing price | 0.8799999952316284 |
| 2026-04-02 | Closing price | 0.8500000238418579 |
| 2026-04-06 | Closing price | 0.8700000047683716 |
| 2026-04-07 | Closing price | 0.8799999952316284 |
| 2026-04-08 | Closing price | 0.7599999904632568 |
| 2026-04-09 | Closing price | 0.7300000190734863 |
| 2026-04-10 | Closing price | 0.6899999976158142 |
| 2026-04-13 | Closing price | 0.75 |
| 2026-04-14 | Closing price | 0.7300000190734863 |
| 2026-04-15 | Closing price | 0.75 |
| 2026-04-16 | Closing price | 0.7699999809265137 |
| 2026-04-17 | Closing price | 0.7099999785423279 |
| 2026-04-20 | Closing price | 0.7599999904632568 |
| 2026-04-21 | Closing price | 0.8199999928474426 |
| 2026-04-22 | Closing price | 0.8299999833106995 |
| 2026-04-23 | Closing price | 0.8999999761581421 |
| 2026-04-24 | Closing price | 0.9300000071525574 |
| 2026-04-27 | Closing price | 1.059999942779541 |
| 2026-04-28 | Closing price | 1.0299999713897705 |
| 2026-04-29 | Closing price | 1.100000023841858 |
| 2026-04-30 | Closing price | 1.090000033378601 |
| 2026-05-01 | Closing price | 1.1299999952316284 |
| 2026-05-04 | Closing price | 1.1299999952316284 |
| 2026-05-05 | Closing price | 1.1100000143051147 |
| 2026-05-06 | Closing price | 1.0099999904632568 |
| 2026-05-07 | Closing price | 0.9700000286102295 |
| 2026-05-08 | Closing price | 0.949999988079071 |
| 2026-05-11 | Closing price | 0.9300000071525574 |
| 2026-05-12 | Closing price | 0.9300000071525574 |
| 2026-05-13 | Closing price | 0.8999999761581421 |
| 2026-05-14 | Closing price | 0.9399999976158142 |
| 2026-05-15 | Closing price | 0.9700000286102295 |
| 2026-05-18 | Closing price | 0.949999988079071 |
| 2026-05-19 | Closing price | 0.9100000262260437 |
| 2026-05-20 | Closing price | 0.8999999761581421 |
| 2026-05-21 | Closing price | 0.8799999952316284 |
| 2026-05-22 | Closing price | 0.9700000286102295 |
| 2026-05-26 | Closing price | 0.9700000286102295 |
| 2026-05-27 | Closing price | 0.949999988079071 |
| 2026-05-28 | Closing price | 1.0199999809265137 |
| 2026-05-29 | Closing price | 1.0 |
| 2026-06-01 | Closing price | 1.0700000524520874 |
| 2026-06-02 | Closing price | 1.0800000429153442 |
| 2026-06-03 | Closing price | 1.059999942779541 |
| 2026-06-04 | Closing price | 1.090000033378601 |
| 2026-06-05 | Closing price | 0.9900000095367432 |
| 2026-06-08 | Closing price | 0.9900000095367432 |
| 2026-06-09 | Closing price | 1.0199999809265137 |
| 2026-06-10 | Closing price | 1.1100000143051147 |
| 2026-06-11 | Closing price | 1.059999942779541 |
| 2026-06-12 | Closing price | 1.0299999713897705 |
| 2026-06-15 | Closing price | 1.0199999809265137 |
| 2026-06-16 | Closing price | 1.0199999809265137 |
| 2026-06-17 | Closing price | 1.090000033378601 |
| 2026-06-18 | Closing price | 1.0199999809265137 |
| 2026-06-22 | Closing price | 1.0399999618530273 |
| 2026-06-23 | Closing price | 1.059999942779541 |
| 2026-06-24 | Closing price | 1.0 |
| 2026-06-25 | Closing price | 1.059999942779541 |
| 2026-06-26 | Closing price | 1.059999942779541 |
| 2026-06-29 | Closing price | 1.0700000524520874 |
| 2026-06-30 | Closing price | 1.100000023841858 |
| 2026-07-01 | Closing price | 1.0800000429153442 |
| 2026-07-02 | Closing price | 1.100000023841858 |
| 2026-07-06 | Closing price | 1.1200000047683716 |
| 2026-07-07 | Closing price | 1.1299999952316284 |
| 2026-07-08 | Closing price | 1.1100000143051147 |
| 2026-07-09 | Closing price | 1.1200000047683716 |
| 2026-07-10 | Closing price | 1.1299999952316284 |
| 2026-07-13 | Closing price | 1.2000000476837158 |
| 2026-07-14 | Closing price | 1.190000057220459 |
| 2026-07-15 | Closing price | 1.25 |
| 2026-07-16 | Closing price | 1.309999942779541 |
| 2026-07-17 | Closing price | 1.399999976158142 |
| 2026-07-20 | Closing price | 1.3700000047683716 |
| 2026-07-21 | Closing price | 1.3700000047683716 |
| 2026-07-22 | Closing price | 1.3600000143051147 |
| 2026-07-23 | Closing price | 1.3600000143051147 |
| 2026-07-24 | Closing price | 1.2799999713897705 |
| 2026-07-27 | Closing price | 1.2000000476837158 |
| 2026-07-28 | Closing price | 1.1100000143051147 |
| 2026-07-29 | Closing price | 1.1200000047683716 |
| 2026-07-30 | Closing price | 1.1200000047683716 |
| 2026-07-31 | Closing price | 1.1399999856948853 |
| 2026-08-03 | Closing price | 1.1299999952316284 |
| 2026-08-04 | Closing price | 1.190000057220459 |
| 2026-08-05 | Closing price | 1.2000000476837158 |
| 2026-08-06 | Closing price | 1.2000000476837158 |
| 2026-08-07 | Closing price | 1.2100000381469727 |
| 2026-08-10 | Closing price | 1.2100000381469727 |
| 2026-08-11 | Closing price | 1.4299999475479126 |
| 2026-08-12 | Closing price | 1.3899999856948853 |
| 2026-08-13 | Closing price | 1.3600000143051147 |
| 2026-08-14 | Closing price | 1.4299999475479126 |
| 2026-08-17 | Closing price | 1.4199999570846558 |
| 2026-08-18 | Closing price | 1.3899999856948853 |
| 2026-08-19 | Closing price | 1.399999976158142 |
| 2026-08-20 | Closing price | 1.399999976158142 |
| 2026-08-21 | Closing price | 1.399999976158142 |
| 2026-08-24 | Closing price | 1.4800000190734863 |
| 2026-08-25 | Closing price | 1.4800000190734863 |
| 2026-08-26 | Closing price | 1.5800000429153442 |
| 2026-08-27 | Closing price | 1.5099999904632568 |
| 2026-08-28 | Closing price | 1.4600000381469727 |
| 2026-08-31 | Closing price | 1.5199999809265137 |
| 2026-09-01 | Closing price | 1.5099999904632568 |
| 2026-09-02 | Closing price | 1.5499999523162842 |
| 2026-09-03 | Closing price | 1.559999942779541 |
| 2026-09-04 | Closing price | 1.5399999618530273 |
| 2026-09-08 | Closing price | 1.5199999809265137 |
| 2026-09-09 | Closing price | 1.600000023841858 |
| 2026-09-10 | Closing price | 1.6299999952316284 |
| 2026-09-11 | Closing price | 1.5700000524520874 |
| 2026-09-14 | Closing price | 1.649999976158142 |
| 2026-09-15 | Closing price | 1.6200000047683716 |
| 2026-09-16 | Closing price | 1.5299999713897705 |
| 2026-09-17 | Closing price | 1.5700000524520874 |
| 2026-09-18 | Closing price | 1.5700000524520874 |
| 2026-09-21 | Closing price | 1.590000033378601 |
| 2026-09-22 | Closing price | 1.5199999809265137 |
| 2026-09-23 | Closing price | 1.4700000286102295 |
| 2026-09-24 | Closing price | 1.5499999523162842 |
| 2026-09-25 | Closing price | 1.440000057220459 |
| 2026-09-28 | Closing price | 1.3799999952316284 |
| 2026-09-29 | Closing price | 1.399999976158142 |
| 2026-09-30 | Closing price | 1.409999966621399 |
| 2026-10-01 | Closing price | 1.4299999475479126 |
| 2026-10-02 | Closing price | 1.4199999570846558 |
| 2026-10-05 | Closing price | 1.4600000381469727 |
| 2026-10-06 | Closing price | 1.4500000476837158 |
| 2026-10-07 | Closing price | 1.4299999475479126 |
| 2026-10-08 | Closing price | 1.4500000476837158 |
| 2026-10-09 | Closing price | 1.4600000381469727 |
| 2026-10-12 | Closing price | 1.4500000476837158 |
| 2026-10-13 | Closing price | 1.4500000476837158 |
| 2026-10-14 | Closing price | 1.409999966621399 |
| 2026-10-15 | Closing price | 1.3899999856948853 |
| 2026-10-16 | Closing price | 1.4199999570846558 |
| 2026-10-19 | Closing price | 1.4600000381469727 |
| 2026-10-20 | Closing price | 1.4500000476837158 |
| 2026-10-21 | Closing price | 1.5 |
| 2026-10-22 | Closing price | 1.5199999809265137 |
| 2026-10-23 | Closing price | 1.5499999523162842 |
| 2026-10-26 | Closing price | 1.559999942779541 |
| 2026-10-27 | Closing price | 1.5800000429153442 |
| 2026-10-28 | Closing price | 1.5700000524520874 |
| 2026-10-29 | Closing price | 1.559999942779541 |
| 2026-10-30 | Closing price | 1.5199999809265137 |
| 2026-11-02 | Closing price | 1.4800000190734863 |
| 2026-11-03 | Closing price | 1.4600000381469727 |
| 2026-11-04 | Closing price | 1.440000057220459 |
| 2026-11-05 | Closing price | 1.3200000524520874 |
| 2026-11-06 | Closing price | 1.3300000429153442 |
| 2026-11-09 | Closing price | 1.3300000429153442 |
| 2026-11-10 | Closing price | 1.3250000476837158 |
With a $69.8 million market cap and negative EBITDA, the multiple cannot be computed
The company's market capitalisation is $69.8 million. With negative EBITDA in the third quarter and over the trailing twelve months, an EV/EBITDA multiple is meaningless: the denominator is negative. Comparing the valuation with its own three-year history on this measure is impossible.
The share price was $1.33 before the release, fell 0.4% on the release day, and fell a further 0.4% from the release date to November 10. The reaction was muted: the market saw neither a surprise nor a disappointment in the report, but no reason for gains either.
The valuation rests not on current profit but on the expectation of first output at Big Sky in spring 2027 and a helium contract at a fixed $285 per Mcf for five years on 100% take-or-pay terms. Until those expectations are confirmed by revenue, there is nothing to judge the valuation against.
Valuation on the latest reported figures
| Metric | Value |
|---|---|
| Market cap | 0.07 bn USD |
| P/B | 2.89 |
| Operating cash flow (LTM) | -0.01 bn |
| ROE | -39.3% |
Bottom line
The report's strength remains revenue: it accelerated to +12.5% and has grown for two consecutive quarters after the 2025 collapse. But the entire increase was swallowed by a $2.603 million EBITDA loss, and the net loss widened to $3.496 million, with the year-ago figure cushioned by a $0.9 million impairment. Net debt rose from $2.071 million to $5.844 million, operating cash flow is negative, and the company is living on equity issuance. Our conclusion: rather unattractive – with a $69.8 million market cap and negative EBITDA, the share has no profitable base, and the multiple cannot be computed. Our view: the share is rather unattractive at the current price.