Vale: revenue fell 4.9% while EBITDA dropped 41.6% – margin compressed from 35.7% to 21.9%
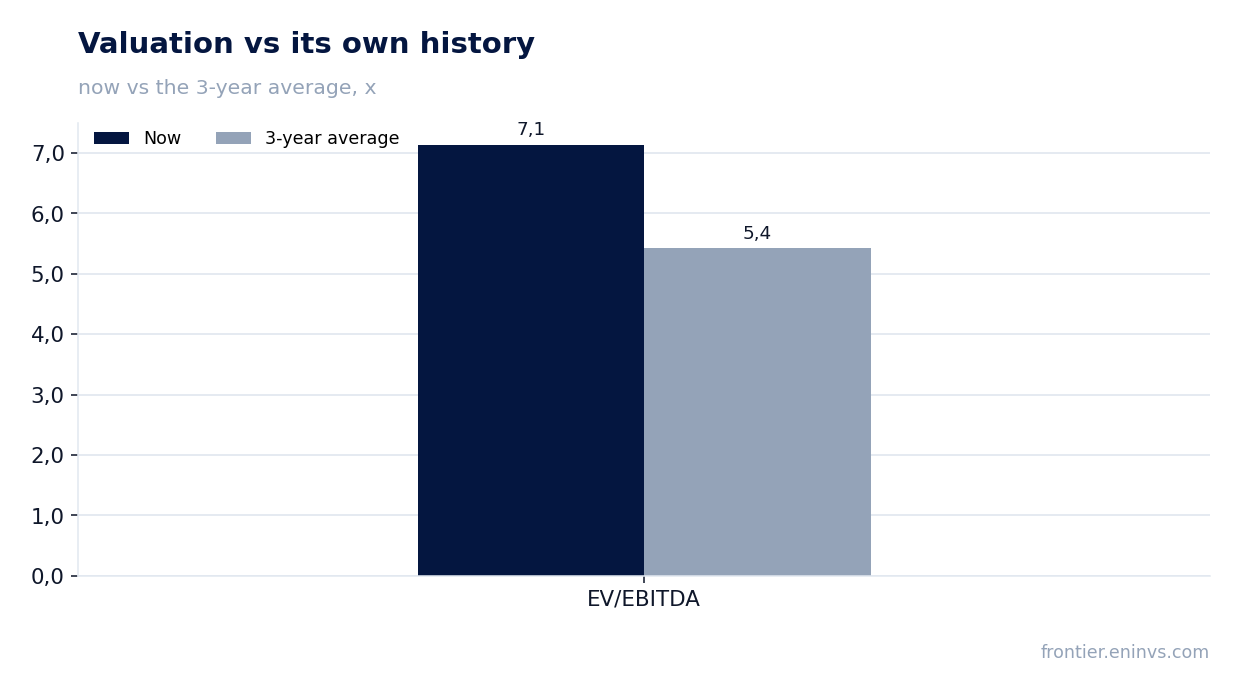
In its third-quarter 2026 report, ended 30 September, Vale posted revenue of USD 10.0 bn, EBITDA of USD 2.2 bn and net profit of USD 1.2 bn. Year on year revenue fell 4.9%, EBITDA 41.6% and profit 55.9%, while the EBITDA margin compressed from 35.7% to 21.9%. With EV/EBITDA at 7.1 against its own three-year average of 5.4 and a dividend yield of 9.4%, the share looks rather unattractive: the current price leaves no room for a margin recovery.
Key takeaways
— Q3 revenue fell 4.9% year on year after 16.9% growth in Q2 – growth gave way to deceleration
— EBITDA dropped 41.6% and the margin compressed from 35.7% to 21.9% – operating leverage worked against the company
— Net profit fell 55.9% to USD 1.2 bn, with the net margin down from 25.9% to 12.0%
— Operating cash flow of USD 2.4 bn covered capex of USD 1.4 bn, but dividends absorb more than is left
— Net debt of USD 12.5 bn at 1.49x LTM EBITDA is a moderate level, but debt rose by USD 0.2 bn over the year
— The 9.4% dividend yield looks high but rests on past-period profit, not the current quarter
— EV/EBITDA of 7.1 is 32% above its own three-year average of 5.4 – the share is more expensive than its history
Attractiveness
Key figures, USD bn
| Metric | Q3 2025 | Q3 2026 | Change |
|---|---|---|---|
| Revenue | 10.5 | 10.0 | -4.9% |
| EBITDA | 3.76 | 2.19 | -41.6% |
| Operating profit | 2.99 | 1.32 | -55.8% |
| Net profit | 2.73 | 1.20 | -55.9% |
| Operating cash flow | 2.55 | 2.39 | -6.4% |
| Capex | 1.39 | 1.37 | -1.7% |
| EBITDA margin | 35.7% | 21.9% | -13.8 pp |
| Net margin | 25.9% | 12.0% | -13.9 pp |
Q3 revenue fell 4.9% year on year after 16.9% growth in Q2 – growth gave way to deceleration
Q3 2026 revenue came in at USD 10.0 bn, 4.9% below the same quarter a year earlier. In Q2 the company grew 16.9%, so the trend reversed: after acceleration in the first half came deceleration and a decline.
The drop came against a strong base – USD 10.5 bn in Q3 2025. The current level is below both that and the Q2 2026 figure of USD 10.4 bn, meaning the company held neither the year-ago base nor sequential growth.
For the rest of the analysis it matters that the revenue decline was accompanied by an even sharper fall in profit. That points beyond volumes to costs or realised prices that compressed the margin.
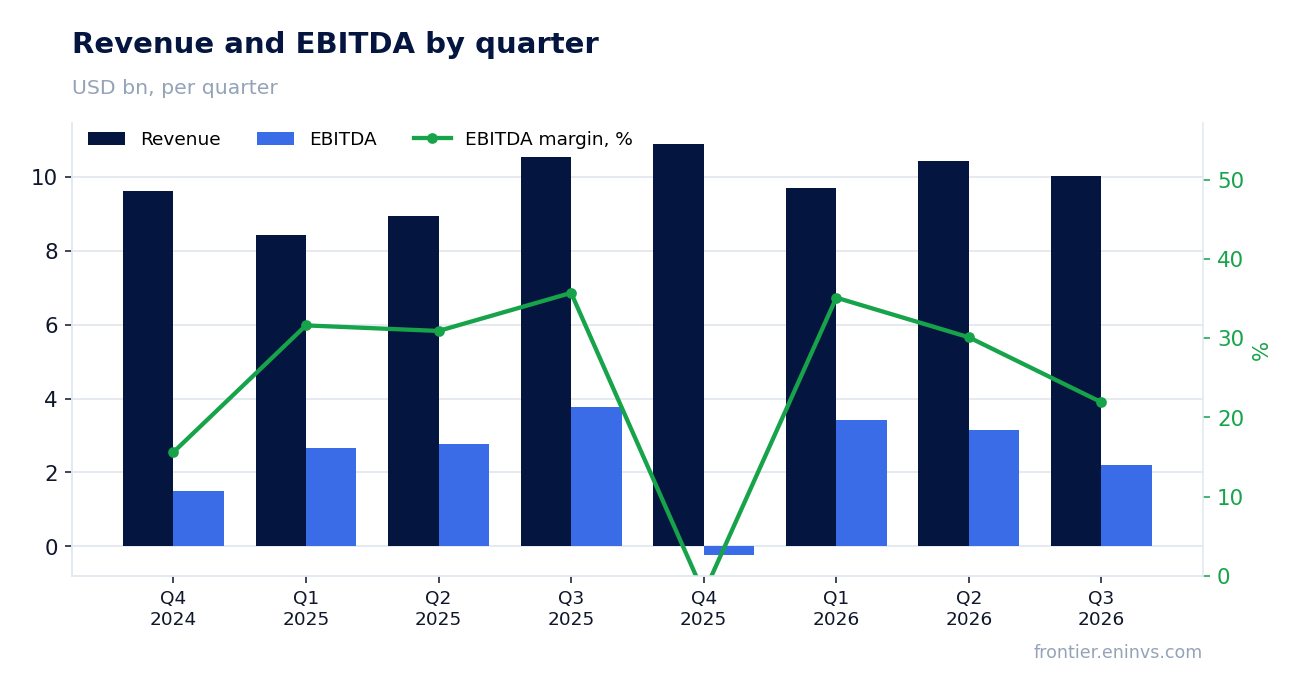
EBITDA dropped 41.6% and the margin compressed from 35.7% to 21.9% – operating leverage worked against the company
Q3 EBITDA was USD 2.2 bn, 41.6% less than a year earlier. With revenue down only 4.9%, the EBITDA decline was more than eight times deeper – the effect of operating leverage when fixed costs do not keep pace with revenue.
The EBITDA margin fell from 35.7% to 21.9%. That gap cannot be explained by volumes alone: it shows materially more cost per unit of revenue than a year ago. Operating profit fell to USD 1.3 bn from USD 3.0 bn a year earlier.
The 13.8 percentage-point margin compression is the central fact of the report. Until it reverses, any revenue recovery will have a weak effect on profit.
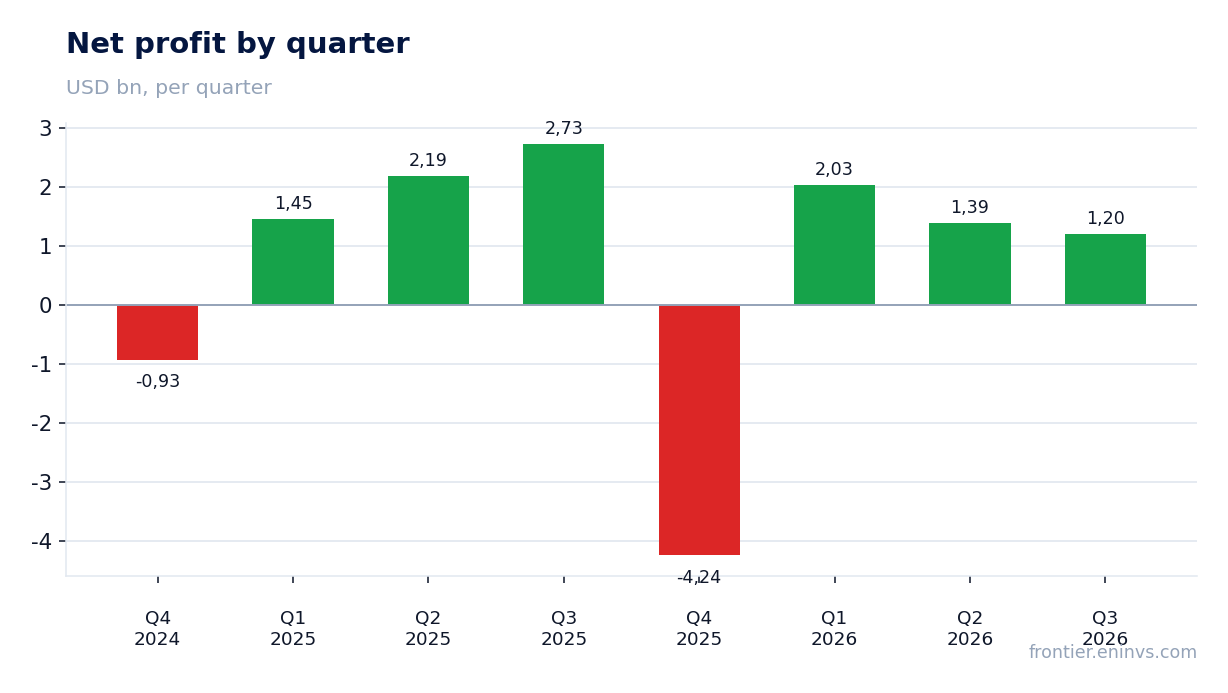
Net profit fell 55.9% to USD 1.2 bn, with the net margin down from 25.9% to 12.0%
Q3 net profit was USD 1.2 bn against USD 2.7 bn a year earlier – a 55.9% decline. The net margin fell from 25.9% to 12.0%, more than halving.
The profit decline is deeper than the EBITDA decline, implying adverse changes below the operating line – likely higher interest costs or a worse result on foreign exchange. The report does not disclose the specific cause, so we state only that profit fell faster than operating profit.
This matters for the dividend: quarterly profit of USD 1.2 bn is well below the base that supported the high trailing yield.
Operating cash flow of USD 2.4 bn covered capex of USD 1.4 bn, but dividends absorb more than is left
Q3 operating cash flow was USD 2.4 bn and capital expenditure USD 1.4 bn. Free cash flow after capex stays positive at about USD 1.0 bn, the only part of the report where the trend did not deteriorate.
At the same time, the trailing 12-month dividend yield is 9.4% on a market cap of USD 48.6 bn, implying annual payouts of roughly USD 4.6 bn – more than four times the quarterly free cash flow of USD 1.0 bn.
The company covers the gap from its balance sheet. While cash flow is positive this is not critical, but further margin compression would put the dividend under pressure.
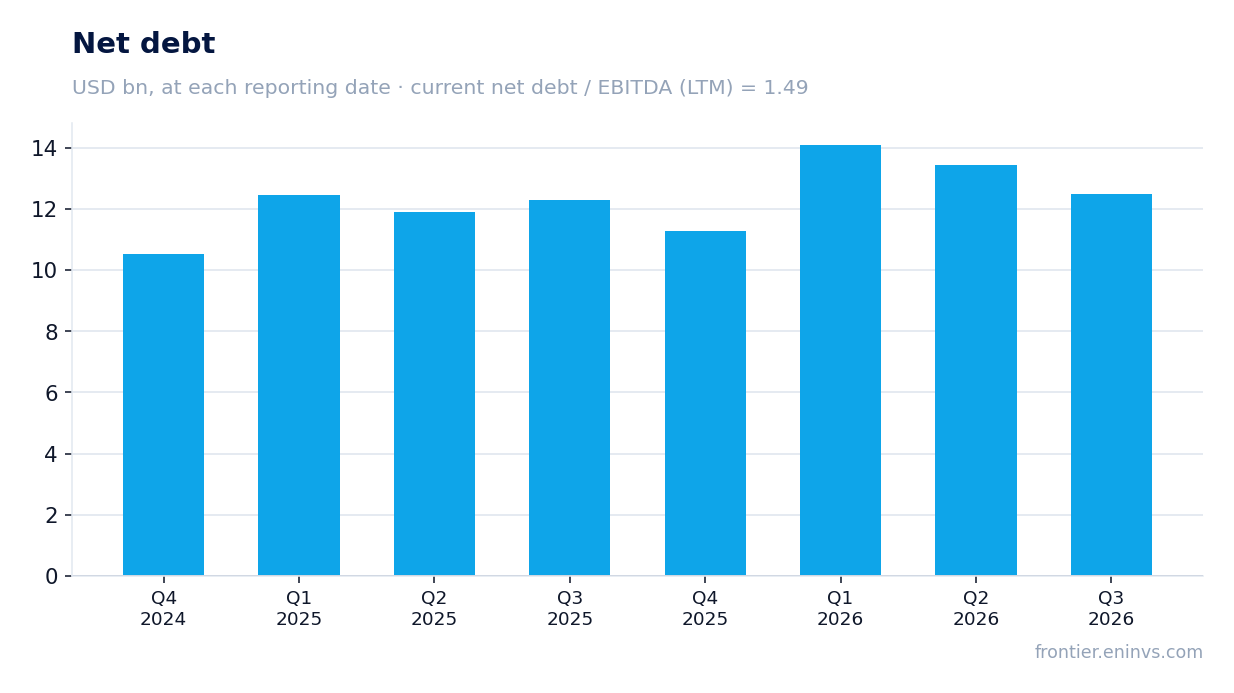
Net debt of USD 12.5 bn at 1.49x LTM EBITDA is a moderate level, but debt rose by USD 0.2 bn over the year
Net debt at 30 September 2026 was USD 12.5 bn against USD 13.4 bn at 30 June 2026 – a USD 0.9 bn reduction over the quarter. Over the year, from 30 September 2025, debt rose from USD 12.3 bn to USD 12.5 bn, or USD 0.2 bn.
The ratio of net debt to trailing 12-month EBITDA is 1.49. That is a moderate level for a commodity company and poses no immediate threat to the balance sheet. But profit is falling faster than debt, so the denominator will shrink over time.
Interest costs on this debt remain a material line and likely explain part of the gap between the EBITDA decline and the net profit decline.
The 9.4% dividend yield looks high but rests on past-period profit, not the current quarter
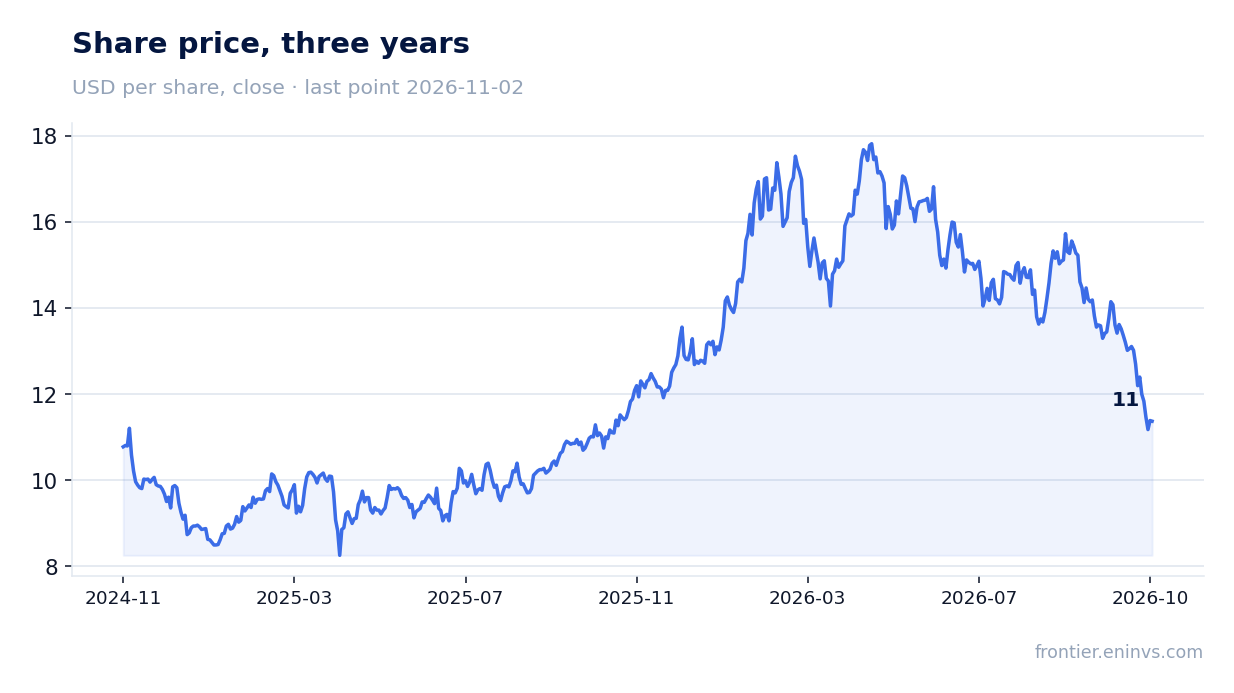
The trailing 12-month dividend yield is 9.4%. That is a high figure and draws attention, but its base is profit from earlier quarters when EBITDA was much higher: USD 3.8 bn in Q3 2025 versus USD 2.2 bn now.
Our estimate of the current-year dividend starts from trailing 12-month profit of USD 412 m and the payout ratio the company has maintained. On that base, annual payouts of USD 4.6 bn are not covered by profit, and the dividend is financed from the balance sheet.
The 9.4% yield should be compared with the key rate, but that figure is not in the facts, so we note only that at current profit the dividend is not earned. A further EBITDA decline or higher capex needs could cut the payout.
EV/EBITDA of 7.1 is 32% above its own three-year average of 5.4 – the share is more expensive than its history
The trailing 12-month EV/EBITDA multiple is 7.1 against its own three-year average of 5.4. The share trades 32% above its history, and that with falling profit – the market is already pricing a recovery not visible in the report.
The trailing P/E is 117.8, reflecting low profit in the denominator. Return on equity is 12.6%, which is decent but rests on earlier periods.
On the portal's model, the upside to fair value is minus 90%, with the value sitting on the model's clamp. That is a bound, not an estimate: even in a favourable scenario the share looks overvalued.
Valuation on the latest reported figures
| Metric | Value |
|---|---|
| Market cap | 48.6 bn USD |
| P/E (LTM) | 117.8 |
| EV/EBITDA (LTM) | 7.1 |
| P/B | 1.41 |
| Net debt / EBITDA (LTM) | 1.49 |
| Operating cash flow (LTM) | 9.46 bn |
| ROE | 12.6% |
| Dividend yield (12m) | 9.4% |
| EV/EBITDA, 3-year average | 5.4 |
Bottom line
The strong point of the report remains cash flow: USD 2.4 bn of operating cash flow covers USD 1.4 bn of capex. But everything else points down: revenue fell 4.9%, EBITDA 41.6%, the margin compressed from 35.7% to 21.9% and profit fell 55.9%. The 9.4% dividend yield rests on past profit and is not earned by the current one. With EV/EBITDA at 7.1 against its own average of 5.4, the share is more expensive than its history, and the verdict is rather unattractive.
Open the company's financial profile VALE →
See also: market overview · valuation map · stock screeners