Vermilion Energy: European gas doubled, yet EBITDA came in 62 million below what the price implied
Contents

On 11 November Vermilion Energy reported results for the third quarter of 2026. Revenue came to 439.8 million dollars, EBITDA to 219.5 million, and the net loss to 25.0 million. The average Brent price in the quarter was 91.3 dollars against 68 a year earlier, and European gas 783 dollars against 405.1. At the year-ago volumes and costs, moving only prices, our calculation puts revenue at 466.9 million and EBITDA at 281.1 million; the company delivered 27.0 and 61.6 million less. Our conclusion: fairly valued – on the portal's model the upside to fair value is minus 3%. Our view: the share is fairly valued; upside on the portal model -3%.
Our view: is there upside
Our view in numbers
| Metric | Our read |
|---|---|
| Verdict | Neutral |
| Upside on the portal model | -3% |
| How the model works | spot model: EBITDA re-priced to current commodity prices at the target EV/EBITDA, against market cap |
| Dividend yield, 12m | 2.8% |
| Net debt / EBITDA | 1.21 – low leverage |
| Strongest case for | At current prices the portal's spot model puts annual EBITDA at 1,102.3 million, 65.3% above LTM, which brings debt to 0.74 times EBITDA and EV/EBITDA to 2.2. |
| Strongest case against | The company fell 61.6 million short of the EBITDA implied by prices at year-ago volumes and costs, and the gap repeats quarter after quarter. |
| What would change the view | If actual EBITDA closes the gap to the price-implied figure, the verdict moves one step up; a retreat of European gas to the quarterly average moves it down. |
Key takeaways
— Prices rose in both key markets: Brent +34.2% year on year, European gas +93.3%, while Henry Hub fell 6.2%
— At the year-ago volumes and costs, prices implied EBITDA of 281.1 million; the company reported 219.5 million, a gap of 61.6 million
— Revenue growth accelerated to 32.3% from 21.3% the quarter before, and it is entirely a price effect
— The EBITDA margin rose to 49.9% from 44.1%, yet still sits below what the price implied
— A net loss of 25.0 million against a 97.8 million profit in the second quarter – the result turned below the operating line
— Net debt of 821.0 million is 1.21 times trailing twelve-month EBITDA, and 0.74 times at current prices
— A dividend yield of 2.83% that the share price does not back with growth
Key figures, USD bn
| Metric | Q3 2025 | Q3 2026 | Change |
|---|---|---|---|
| Revenue | 0.33 | 0.44 | +32.3% |
| EBITDA | 0.15 | 0.22 | +49.7% |
| Operating profit | 0.02 | 0.11 | +413.5% |
| Net profit | 0.00 | -0.03 | -1466.4% |
| Operating cash flow | 0.28 | 0.20 | -29.2% |
| Capex | 0.10 | — | — |
| EBITDA margin | 44.1% | 49.9% | +5.8 pp |
| Net margin | 0.6% | -5.7% | -6.3 pp |
Prices rose in both key markets: Brent +34.2% year on year, European gas +93.3%, while Henry Hub fell 6.2%
Brent averaged 91.3 dollars a barrel in the third quarter against 68 a year earlier, up 34.2%. Against the previous quarter the price fell 5.6% from 96.8. On 11 November spot stood at 92.3 dollars, 1.1% above the reported-period average.
European gas nearly doubled: 783 dollars against 405.1 a year earlier, up 93.3%, and up 39.9% from 559.5 in the previous quarter. Spot is now 995.6 dollars, 27.2% above the quarterly average. This is the main price driver of the report: European gas accounts for 30% of revenue in the portal's model.
US Henry Hub, which carries 20% of revenue, moved the other way: 2.893 dollars against 3.083 a year earlier, down 6.2%, and down 1.1% from the previous quarter. Spot is 3.31 dollars, 14.4% above the average. Across the three markets the backdrop is favourable for the company, but uneven.
Commodity prices: period average and now
| Benchmark | Year ago | Q3 2026 | YoY | Spot 2026-11-11 |
|---|---|---|---|---|
| Brent, USD | 68,0 | 91,3 | +34,2% | 92,3 |
| Dutch Gas, USD | 405,1 | 783,0 | +93,3% | 995,6 |
| Henry Hub, USD | 3,08 | 2,89 | -6,2% | 3,31 |
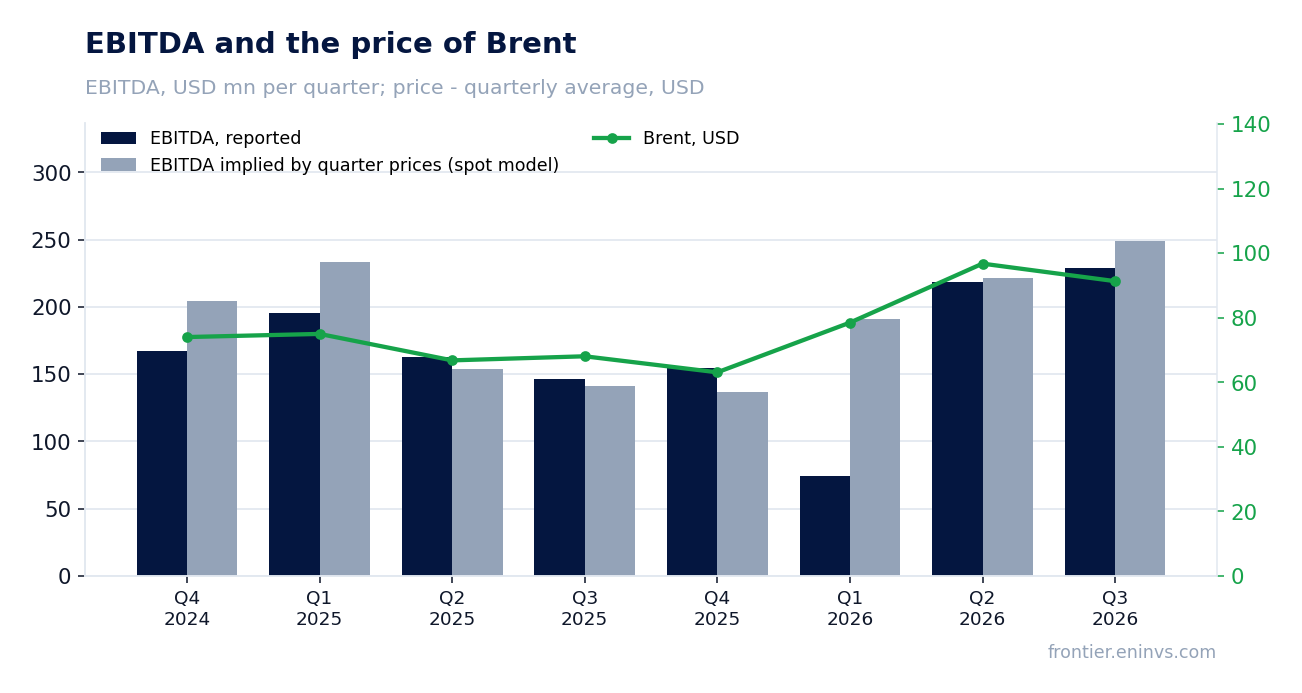
At the year-ago volumes and costs, prices implied EBITDA of 281.1 million; the company reported 219.5 million, a gap of 61.6 million
Holding third-quarter 2025 volumes and non-commodity costs and moving only prices, revenue should have been 466.9 million – a price effect of plus 134.4 million, or 40.4%. Actual revenue was 439.8 million, 27.0 million, or 5.8%, less. The EBITDA gap is wider: 281.1 million against 219.5 million, minus 61.6 million, or 21.9%.
The picture is the same against the previous quarter. At second-quarter volumes and costs, prices gave revenue of 449.1 million and EBITDA of 257.8 million; the company reported 439.8 million and 219.5 million, 9.3 million and 38.3 million less. The gap does not reduce to a single factor, but it is persistent: the company under-earns relative to price both year on year and quarter on quarter.
The portal's spot model, re-priced from the average of the previous four quarters, expected EBITDA of 249.4 million and revenue of 469.8 million. The actual figures are 12.0% and 6.4% below. In the four preceding periods the deviation was +4.1%, +13.2%, minus 61.2% and minus 1.3%, so the model's base is itself unstable and this shortfall is not the first.
What the prices implied and what the company earned
| Base (Q3 2025) | Implied at period prices | Reported | Reported vs implied | |
|---|---|---|---|---|
| Revenue, USD mn | 332,4 | 466,9 | 439,8 | -5,8% |
| EBITDA, USD mn | 146,6 | 281,1 | 219,5 | -21,9% |
| EBITDA, portal spot model, USD mn | — | 249,4 | 219,5 | -12,0% |
Revenue and EBITDA by quarter
| Period | Measure | bn USD |
|---|---|---|
| Q4 2024 | Revenue | 0.446003 |
| Q1 2025 | Revenue | 0.347065 |
| Q2 2025 | Revenue | 0.338003 |
| Q3 2025 | Revenue | 0.332444 |
| Q4 2025 | Revenue | 0.330952 |
| Q1 2026 | Revenue | 0.378122 |
| Q2 2026 | Revenue | 0.41013 |
| Q3 2026 | Revenue | 0.439842 |
| Q4 2024 | EBITDA | 0.166909 |
| Q1 2025 | EBITDA | 0.19553399999999999 |
| Q2 2025 | EBITDA | 0.162969 |
| Q3 2025 | EBITDA | 0.146632 |
| Q4 2025 | EBITDA | 0.154659 |
| Q1 2026 | EBITDA | 0.07408799999999999 |
| Q2 2026 | EBITDA | 0.218746 |
| Q3 2026 | EBITDA | 0.229028 |
EBITDA margin
| Period | Measure | % |
|---|---|---|
| Q4 2024 | EBITDA margin | 37.4 |
| Q1 2025 | EBITDA margin | 56.3 |
| Q2 2025 | EBITDA margin | 48.2 |
| Q3 2025 | EBITDA margin | 44.1 |
| Q4 2025 | EBITDA margin | 46.7 |
| Q1 2026 | EBITDA margin | 19.6 |
| Q2 2026 | EBITDA margin | 53.3 |
| Q3 2026 | EBITDA margin | 52.1 |
Revenue growth accelerated to 32.3% from 21.3% the quarter before, and it is entirely a price effect
Third-quarter revenue was 439.8 million against 332.4 million a year earlier, up 32.3%. Growth was 21.3% in the second quarter, 8.9% in the first and minus 25.8% in the fourth quarter of 2025. The acceleration comes from a low year-ago base and from prices, not volumes: our calculation puts the price effect at plus 134.4 million, more than the entire revenue increase of 107.4 million.
That means volumes and sales mix added nothing to growth, and part of the price effect was absorbed. For an investor the point is that 32.3% revenue growth is not evidence of an expanding business but a reflection of the market. The next quarter will be compared with the already high base of the fourth quarter of 2025, when revenue was 331.0 million.
The EBITDA margin rose to 49.9% from 44.1%, yet still sits below what the price implied
Third-quarter EBITDA was 219.5 million against 146.6 million a year earlier, up 49.7%. The margin was 49.9% against 44.1%. Margin growth on such a price backdrop is expected, but at year-ago volumes and costs our calculation puts price-implied EBITDA at 281.1 million, a higher margin than reported. The 61.6 million gap is the cost of what the company failed to capture relative to the market.
Operating profit was 113.4 million against 22.1 million a year earlier. The difference between EBITDA and operating profit is 106.0 million, and it grew: a year earlier it was 124.5 million on lower EBITDA, so depreciation and other operating lines now take a smaller share. That supports the margin but does not offset the revenue shortfall.
A net loss of 25.0 million against a 97.8 million profit in the second quarter – the result turned below the operating line
With operating profit of 113.4 million and EBITDA of 219.5 million, the company posted a net loss of 25.0 million. A year earlier, on operating profit of 22.1 million, it earned 1.8 million. The reversal happened below the operating line: interest expense, taxes and other items outweighed the operating result. The net margin was minus 5.7% against plus 0.6% a year earlier.
In the second quarter of 2026 profit was 97.8 million, in the first a loss of 106.0 million, and in the fourth quarter of 2025 a loss of 313.2 million. Quarterly profit is highly volatile, and the third quarter confirms it: strong operating momentum does not reach the bottom line. That matters for the dividend and for ROE of minus 6.52%, but not for the ability to generate EBITDA.
Net debt of 821.0 million is 1.21 times trailing twelve-month EBITDA, and 0.74 times at current prices
Net debt at 30 September 2026 was 821.0 million. Against trailing twelve-month EBITDA of 676.5 million that is 1.21. Leverage is moderate and falls at current prices: the portal's spot model puts annual EBITDA at today's prices at 1,102.3 million, 65.3% above LTM, which makes the ratio 0.74. Operating cash flow in the quarter was 197.4 million and capex 105.7 million, so free cash flow was positive.
Importantly, LTM figures were earned at past prices. EBITDA of 676.5 million and revenue of 1,600.0 million over the last twelve months include weak quarters: the first quarter of 2026 delivered EBITDA of 74.1 million and the fourth quarter of 2025 154.7 million. If current prices hold, the debt base improves without any action by the company.
Share price, three years
close, last point 2026-11-10
| Period | Measure | USD per share |
|---|---|---|
| 2025-11-10 | Closing price | 8.680000305175781 |
| 2025-11-11 | Closing price | 9.079999923706055 |
| 2025-11-12 | Closing price | 8.829999923706055 |
| 2025-11-13 | Closing price | 8.710000038146973 |
| 2025-11-14 | Closing price | 8.970000267028809 |
| 2025-11-17 | Closing price | 8.779999732971191 |
| 2025-11-18 | Closing price | 9.170000076293945 |
| 2025-11-19 | Closing price | 9.210000038146973 |
| 2025-11-20 | Closing price | 9.0 |
| 2025-11-21 | Closing price | 8.930000305175781 |
| 2025-11-24 | Closing price | 8.869999885559082 |
| 2025-11-25 | Closing price | 8.619999885559082 |
| 2025-11-26 | Closing price | 8.65999984741211 |
| 2025-11-28 | Closing price | 9.270000457763672 |
| 2025-12-01 | Closing price | 9.0 |
| 2025-12-02 | Closing price | 8.899999618530273 |
| 2025-12-03 | Closing price | 9.029999732971191 |
| 2025-12-04 | Closing price | 9.069999694824219 |
| 2025-12-05 | Closing price | 9.039999961853027 |
| 2025-12-08 | Closing price | 9.170000076293945 |
| 2025-12-09 | Closing price | 8.989999771118164 |
| 2025-12-10 | Closing price | 9.039999961853027 |
| 2025-12-11 | Closing price | 8.800000190734863 |
| 2025-12-12 | Closing price | 8.600000381469727 |
| 2025-12-15 | Closing price | 8.430000305175781 |
| 2025-12-16 | Closing price | 8.039999961853027 |
| 2025-12-17 | Closing price | 8.25 |
| 2025-12-18 | Closing price | 7.96999979019165 |
| 2025-12-19 | Closing price | 8.100000381469727 |
| 2025-12-22 | Closing price | 8.220000267028809 |
| 2025-12-23 | Closing price | 8.25 |
| 2025-12-24 | Closing price | 8.25 |
| 2025-12-26 | Closing price | 8.180000305175781 |
| 2025-12-29 | Closing price | 8.25 |
| 2025-12-30 | Closing price | 8.359999656677246 |
| 2025-12-31 | Closing price | 8.34000015258789 |
| 2026-01-02 | Closing price | 8.539999961853027 |
| 2026-01-05 | Closing price | 8.149999618530273 |
| 2026-01-06 | Closing price | 8.010000228881836 |
| 2026-01-07 | Closing price | 7.829999923706055 |
| 2026-01-08 | Closing price | 8.130000114440918 |
| 2026-01-09 | Closing price | 8.25 |
| 2026-01-12 | Closing price | 8.369999885559082 |
| 2026-01-13 | Closing price | 8.569999694824219 |
| 2026-01-14 | Closing price | 8.819999694824219 |
| 2026-01-15 | Closing price | 8.529999732971191 |
| 2026-01-16 | Closing price | 8.710000038146973 |
| 2026-01-20 | Closing price | 8.829999923706055 |
| 2026-01-21 | Closing price | 9.420000076293945 |
| 2026-01-22 | Closing price | 9.039999961853027 |
| 2026-01-23 | Closing price | 9.279999732971191 |
| 2026-01-26 | Closing price | 9.4399995803833 |
| 2026-01-27 | Closing price | 9.6899995803833 |
| 2026-01-28 | Closing price | 9.6899995803833 |
| 2026-01-29 | Closing price | 9.869999885559082 |
| 2026-01-30 | Closing price | 9.680000305175781 |
| 2026-02-02 | Closing price | 9.420000076293945 |
| 2026-02-03 | Closing price | 10.010000228881836 |
| 2026-02-04 | Closing price | 10.1899995803833 |
| 2026-02-05 | Closing price | 9.720000267028809 |
| 2026-02-06 | Closing price | 10.210000038146973 |
| 2026-02-09 | Closing price | 10.399999618530273 |
| 2026-02-10 | Closing price | 10.329999923706055 |
| 2026-02-11 | Closing price | 10.520000457763672 |
| 2026-02-12 | Closing price | 9.989999771118164 |
| 2026-02-13 | Closing price | 10.029999732971191 |
| 2026-02-17 | Closing price | 9.949999809265137 |
| 2026-02-18 | Closing price | 10.319999694824219 |
| 2026-02-19 | Closing price | 10.539999961853027 |
| 2026-02-20 | Closing price | 10.600000381469727 |
| 2026-02-23 | Closing price | 10.609999656677246 |
| 2026-02-24 | Closing price | 10.529999732971191 |
| 2026-02-25 | Closing price | 10.470000267028809 |
| 2026-02-26 | Closing price | 10.619999885559082 |
| 2026-02-27 | Closing price | 10.770000457763672 |
| 2026-03-02 | Closing price | 11.359999656677246 |
| 2026-03-03 | Closing price | 11.430000305175781 |
| 2026-03-04 | Closing price | 11.550000190734863 |
| 2026-03-05 | Closing price | 11.350000381469727 |
| 2026-03-06 | Closing price | 11.319999694824219 |
| 2026-03-09 | Closing price | 11.40999984741211 |
| 2026-03-10 | Closing price | 11.5 |
| 2026-03-11 | Closing price | 11.630000114440918 |
| 2026-03-12 | Closing price | 11.880000114440918 |
| 2026-03-13 | Closing price | 11.789999961853027 |
| 2026-03-16 | Closing price | 11.960000038146973 |
| 2026-03-17 | Closing price | 12.270000457763672 |
| 2026-03-18 | Closing price | 12.609999656677246 |
| 2026-03-19 | Closing price | 14.420000076293945 |
| 2026-03-20 | Closing price | 13.890000343322754 |
| 2026-03-23 | Closing price | 13.039999961853027 |
| 2026-03-24 | Closing price | 13.359999656677246 |
| 2026-03-25 | Closing price | 13.220000267028809 |
| 2026-03-26 | Closing price | 13.289999961853027 |
| 2026-03-27 | Closing price | 13.90999984741211 |
| 2026-03-30 | Closing price | 13.609999656677246 |
| 2026-03-31 | Closing price | 13.779999732971191 |
| 2026-04-01 | Closing price | 12.890000343322754 |
| 2026-04-02 | Closing price | 13.380000114440918 |
| 2026-04-06 | Closing price | 13.75 |
| 2026-04-07 | Closing price | 14.020000457763672 |
| 2026-04-08 | Closing price | 13.010000228881836 |
| 2026-04-09 | Closing price | 12.4399995803833 |
| 2026-04-10 | Closing price | 12.399999618530273 |
| 2026-04-13 | Closing price | 12.930000305175781 |
| 2026-04-14 | Closing price | 12.529999732971191 |
| 2026-04-15 | Closing price | 12.279999732971191 |
| 2026-04-16 | Closing price | 12.460000038146973 |
| 2026-04-17 | Closing price | 11.479999542236328 |
| 2026-04-20 | Closing price | 11.6899995803833 |
| 2026-04-21 | Closing price | 12.029999732971191 |
| 2026-04-22 | Closing price | 12.260000228881836 |
| 2026-04-23 | Closing price | 12.460000038146973 |
| 2026-04-24 | Closing price | 12.350000381469727 |
| 2026-04-27 | Closing price | 12.609999656677246 |
| 2026-04-28 | Closing price | 13.050000190734863 |
| 2026-04-29 | Closing price | 13.460000038146973 |
| 2026-04-30 | Closing price | 13.470000267028809 |
| 2026-05-01 | Closing price | 13.199999809265137 |
| 2026-05-04 | Closing price | 13.5 |
| 2026-05-05 | Closing price | 13.630000114440918 |
| 2026-05-06 | Closing price | 11.869999885559082 |
| 2026-05-07 | Closing price | 11.859999656677246 |
| 2026-05-08 | Closing price | 11.789999961853027 |
| 2026-05-11 | Closing price | 12.239999771118164 |
| 2026-05-12 | Closing price | 12.470000267028809 |
| 2026-05-13 | Closing price | 12.529999732971191 |
| 2026-05-14 | Closing price | 12.579999923706055 |
| 2026-05-15 | Closing price | 12.800000190734863 |
| 2026-05-18 | Closing price | 12.979999542236328 |
| 2026-05-19 | Closing price | 13.199999809265137 |
| 2026-05-20 | Closing price | 12.600000381469727 |
| 2026-05-21 | Closing price | 12.300000190734863 |
| 2026-05-22 | Closing price | 12.300000190734863 |
| 2026-05-26 | Closing price | 11.84000015258789 |
| 2026-05-27 | Closing price | 11.350000381469727 |
| 2026-05-28 | Closing price | 11.380000114440918 |
| 2026-05-29 | Closing price | 11.130000114440918 |
| 2026-06-01 | Closing price | 11.649999618530273 |
| 2026-06-02 | Closing price | 11.729999542236328 |
| 2026-06-03 | Closing price | 11.9399995803833 |
| 2026-06-04 | Closing price | 11.979999542236328 |
| 2026-06-05 | Closing price | 11.34000015258789 |
| 2026-06-08 | Closing price | 11.619999885559082 |
| 2026-06-09 | Closing price | 11.119999885559082 |
| 2026-06-10 | Closing price | 11.380000114440918 |
| 2026-06-11 | Closing price | 11.210000038146973 |
| 2026-06-12 | Closing price | 11.149999618530273 |
| 2026-06-15 | Closing price | 10.5600004196167 |
| 2026-06-16 | Closing price | 10.359999656677246 |
| 2026-06-17 | Closing price | 10.180000305175781 |
| 2026-06-18 | Closing price | 9.829999923706055 |
| 2026-06-22 | Closing price | 9.869999885559082 |
| 2026-06-23 | Closing price | 9.84000015258789 |
| 2026-06-24 | Closing price | 9.420000076293945 |
| 2026-06-25 | Closing price | 9.420000076293945 |
| 2026-06-26 | Closing price | 9.300000190734863 |
| 2026-06-29 | Closing price | 9.220000267028809 |
| 2026-06-30 | Closing price | 9.369999885559082 |
| 2026-07-01 | Closing price | 9.079999923706055 |
| 2026-07-02 | Closing price | 8.989999771118164 |
| 2026-07-06 | Closing price | 8.739999771118164 |
| 2026-07-07 | Closing price | 9.050000190734863 |
| 2026-07-08 | Closing price | 9.520000457763672 |
| 2026-07-09 | Closing price | 9.470000267028809 |
| 2026-07-10 | Closing price | 9.399999618530273 |
| 2026-07-13 | Closing price | 9.760000228881836 |
| 2026-07-14 | Closing price | 9.819999694824219 |
| 2026-07-15 | Closing price | 9.789999961853027 |
| 2026-07-16 | Closing price | 9.670000076293945 |
| 2026-07-17 | Closing price | 9.829999923706055 |
| 2026-07-20 | Closing price | 9.739999771118164 |
| 2026-07-21 | Closing price | 10.199999809265137 |
| 2026-07-22 | Closing price | 11.029999732971191 |
| 2026-07-23 | Closing price | 11.239999771118164 |
| 2026-07-24 | Closing price | 11.260000228881836 |
| 2026-07-27 | Closing price | 10.579999923706055 |
| 2026-07-28 | Closing price | 10.359999656677246 |
| 2026-07-29 | Closing price | 10.8100004196167 |
| 2026-07-30 | Closing price | 11.5 |
| 2026-07-31 | Closing price | 11.920000076293945 |
| 2026-08-03 | Closing price | 11.550000190734863 |
| 2026-08-04 | Closing price | 11.039999961853027 |
| 2026-08-05 | Closing price | 10.5600004196167 |
| 2026-08-06 | Closing price | 10.970000267028809 |
| 2026-08-07 | Closing price | 10.859999656677246 |
| 2026-08-10 | Closing price | 11.460000038146973 |
| 2026-08-11 | Closing price | 11.350000381469727 |
| 2026-08-12 | Closing price | 11.300000190734863 |
| 2026-08-13 | Closing price | 11.229999542236328 |
| 2026-08-14 | Closing price | 11.34000015258789 |
| 2026-08-17 | Closing price | 11.880000114440918 |
| 2026-08-18 | Closing price | 12.229999542236328 |
| 2026-08-19 | Closing price | 12.5600004196167 |
| 2026-08-20 | Closing price | 12.84000015258789 |
| 2026-08-21 | Closing price | 12.729999542236328 |
| 2026-08-24 | Closing price | 12.539999961853027 |
| 2026-08-25 | Closing price | 12.199999809265137 |
| 2026-08-26 | Closing price | 12.260000228881836 |
| 2026-08-27 | Closing price | 12.710000038146973 |
| 2026-08-28 | Closing price | 12.460000038146973 |
| 2026-08-31 | Closing price | 12.829999923706055 |
| 2026-09-01 | Closing price | 13.180000305175781 |
| 2026-09-02 | Closing price | 13.170000076293945 |
| 2026-09-03 | Closing price | 13.020000457763672 |
| 2026-09-04 | Closing price | 12.84000015258789 |
| 2026-09-08 | Closing price | 13.039999961853027 |
| 2026-09-09 | Closing price | 13.369999885559082 |
| 2026-09-10 | Closing price | 13.390000343322754 |
| 2026-09-11 | Closing price | 13.229999542236328 |
| 2026-09-14 | Closing price | 13.289999961853027 |
| 2026-09-15 | Closing price | 13.460000038146973 |
| 2026-09-16 | Closing price | 12.619999885559082 |
| 2026-09-17 | Closing price | 12.649999618530273 |
| 2026-09-18 | Closing price | 12.520000457763672 |
| 2026-09-21 | Closing price | 11.90999984741211 |
| 2026-09-22 | Closing price | 11.619999885559082 |
| 2026-09-23 | Closing price | 11.680000305175781 |
| 2026-09-24 | Closing price | 11.869999885559082 |
| 2026-09-25 | Closing price | 11.600000381469727 |
| 2026-09-28 | Closing price | 11.520000457763672 |
| 2026-09-29 | Closing price | 11.300000190734863 |
| 2026-09-30 | Closing price | 11.390000343322754 |
| 2026-10-01 | Closing price | 11.600000381469727 |
| 2026-10-02 | Closing price | 11.680000305175781 |
| 2026-10-05 | Closing price | 11.729999542236328 |
| 2026-10-06 | Closing price | 11.600000381469727 |
| 2026-10-07 | Closing price | 11.529999732971191 |
| 2026-10-08 | Closing price | 11.859999656677246 |
| 2026-10-09 | Closing price | 11.869999885559082 |
| 2026-10-12 | Closing price | 11.920000076293945 |
| 2026-10-13 | Closing price | 12.25 |
| 2026-10-14 | Closing price | 12.449999809265137 |
| 2026-10-15 | Closing price | 12.649999618530273 |
| 2026-10-16 | Closing price | 13.199999809265137 |
| 2026-10-19 | Closing price | 13.600000381469727 |
| 2026-10-20 | Closing price | 13.40999984741211 |
| 2026-10-21 | Closing price | 13.550000190734863 |
| 2026-10-22 | Closing price | 13.449999809265137 |
| 2026-10-23 | Closing price | 13.920000076293945 |
| 2026-10-26 | Closing price | 14.100000381469727 |
| 2026-10-27 | Closing price | 13.609999656677246 |
| 2026-10-28 | Closing price | 13.640000343322754 |
| 2026-10-29 | Closing price | 13.510000228881836 |
| 2026-10-30 | Closing price | 13.6899995803833 |
| 2026-11-02 | Closing price | 12.470000267028809 |
| 2026-11-03 | Closing price | 12.380000114440918 |
| 2026-11-04 | Closing price | 10.75 |
| 2026-11-05 | Closing price | 10.5 |
| 2026-11-06 | Closing price | 10.449999809265137 |
| 2026-11-09 | Closing price | 10.229999542236328 |
| 2026-11-10 | Closing price | 10.3149995803833 |
A dividend yield of 2.83% that the share price does not back with growth
The trailing twelve-month dividend yield is 2.83%. On a market capitalisation of 1,577.7 million that is roughly 44.6 million a year in payouts. The company does pay a dividend, but quarterly net profit is negative and ROE is minus 6.52%, so coverage rests on cash flow rather than profit.
Operating cash flow of 197.4 million in the quarter against capex of 105.7 million leaves about 91.7 million of free cash flow, enough for the payout. But the flow is volatile: 165.6 million in the first quarter of 2026, 124.4 million in the second, and 95.4 million in the fourth quarter of 2025 against capex of 323.6 million. A 2.83% yield is not the main argument for the share: it is modest and does not compensate for the lack of capital growth.
Net profit by quarter
| Period | Measure | bn USD |
|---|---|---|
| Q4 2024 | Net profit | −0.013373 |
| Q1 2025 | Net profit | 0.010701 |
| Q2 2025 | Net profit | −0.167073 |
| Q3 2025 | Net profit | 0.00183 |
| Q4 2025 | Net profit | −0.313204 |
| Q1 2026 | Net profit | −0.106007 |
| Q2 2026 | Net profit | 0.097777 |
| Q3 2026 | Net profit | −0.025006 |
Valuation: EV/EBITDA of 3.55 falls to 2.2 at current prices, and the portal's model sees minus 3%
EV/EBITDA on trailing twelve months is 3.55. At today's prices the portal's spot model brings the multiple down to 2.2: the market values the company on past, weaker earnings. The portal's model re-prices EBITDA to current prices at the target multiple and puts the upside to fair value at minus 3%. This is our own estimate, not a consensus.
Reserves are ample: reserve life at the current production rate is 17.2 years. That is a long-lived asset, but it does not create value growth unless prices exceed today's. Minus 3% is effectively fair value: the market has already priced current prices into the capitalisation, and there is no margin of safety in the multiple.
Valuation on the latest reported figures
| Metric | Value |
|---|---|
| Market cap | 1.58 bn USD |
| EV/EBITDA (LTM) | 3.5 |
| P/B | 1.06 |
| Net debt / EBITDA (LTM) | 1.21 |
| Operating cash flow (LTM) | 0.58 bn |
| ROE | -6.5% |
| Dividend yield (12m) | 2.8% |
Bottom line
The strong side of the report is the price backdrop: Brent +34.2%, European gas +93.3%, and EBITDA up 49.7% to 219.5 million at a 49.9% margin. The weak side is that even on that backdrop the company fell 61.6 million short of what the price implied, and the net result turned into a 25.0 million loss. Debt is moderate: 1.21 times trailing twelve-month EBITDA and 0.74 times at current prices, with positive free cash flow. The question for a holder now is not debt or the 2.83% dividend but why price does not reach EBITDA. Our conclusion: fairly valued – on the portal's model the upside is minus 3%. Our view: the share is fairly valued; upside on the portal model -3%.