Vista Energy: revenue up 83.4% but profit down – growth paid for with margin
Vista Energy reported third-quarter 2026 results. Revenue rose 83.4% year on year to USD 1,295.0 million, EBITDA grew 90.9% to USD 884.3 million, while net profit fell 6.9% to USD 293.5 million. The EBITDA margin improved to 68.3%, but the net margin dropped from 44.6% to 22.7%. Leverage stands at 1.11x LTM EBITDA, and the EV/EBITDA multiple of 4.2 is below its own three-year average of 5.3 – the stock looks cheaper than its own history, and the verdict is 'rather attractive'.
Key takeaways
— Revenue grew 83.4% year on year, but the pace decelerated from 102.3% in the second quarter
— EBITDA added 90.9%, and its margin rose to 68.3% from 65.6% a year earlier
— Net profit fell 6.9% despite revenue growth – the net margin dropped from 44.6% to 22.7%
— Leverage at 1.11x LTM EBITDA is a moderate level with net debt of USD 2.9 billion
— EV/EBITDA of 4.2 is 20% below its own three-year average of 5.3 – the stock is cheaper than its history
— On the portal's model, the upside to fair value is estimated at +67%
Attractiveness
Key figures, USD bn
| Metric | Q3 2025 | Q3 2026 | Change |
|---|---|---|---|
| Revenue | 0.71 | 1.29 | +83.4% |
| EBITDA | 0.46 | 0.88 | +90.9% |
| Operating profit | 0.25 | 0.59 | +134.3% |
| Net profit | 0.32 | 0.29 | -6.9% |
| Operating cash flow | 0.30 | 0.77 | +154.3% |
| Capex | 0.34 | — | — |
| EBITDA margin | 65.6% | 68.3% | +2.7 pp |
| Net margin | 44.6% | 22.7% | -21.9 pp |
Revenue grew 83.4% year on year, but the pace decelerated from 102.3% in the second quarter
In the third quarter of 2026, revenue reached USD 1,295.0 million, 83.4% above the third quarter of 2025. Growth remains very high, but it decelerated from the second quarter, when revenue added 102.3% year on year. The deceleration is a natural consequence of a higher base: a year earlier quarterly revenue was USD 706.1 million, and now it is almost double.
Sequential growth also continues: revenue was USD 1,234.9 million in the second quarter of 2026 and USD 1,295.0 million in the third. That is a moderate addition rather than a surge, suggesting the main contribution to annual growth comes from the low base of last year rather than an acceleration in the last three months.
For an investor, the pace matters less than its sustainability. Deceleration from 102.3% to 83.4% is still very high growth, but it raises the question of how long the company can sustain such dynamics against a comparable base next year.
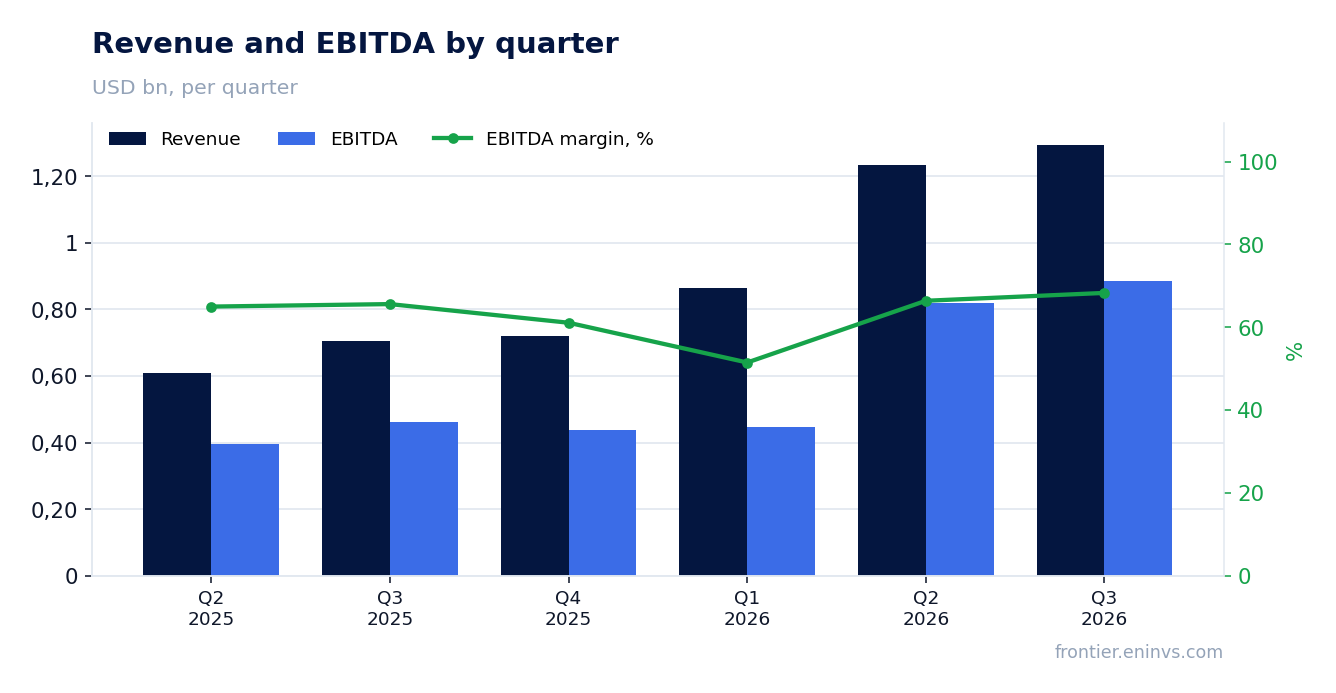
EBITDA added 90.9%, and its margin rose to 68.3% from 65.6% a year earlier
EBITDA in the third quarter of 2026 was USD 884.3 million, up 90.9% year on year. That is faster than revenue growth, so the EBITDA margin rose to 68.3% from 65.6% in the third quarter of 2025. Operating profit reached USD 591.1 million.
Margin expansion means costs grew slower than revenue. The company does not disclose in these figures which cost line delivered the savings, so we limit ourselves to the fact: with revenue of USD 1,295.0 million, EBITDA of USD 884.3 million leaves about a third of revenue for operating and other costs, versus about 35% a year earlier.
A margin above 68% is very high for the oil and gas sector, and it makes EBITDA sensitive to product prices. A small change in oil prices translates into a disproportionately large change in absolute EBITDA, and that is the main factor that will determine next quarter's result.
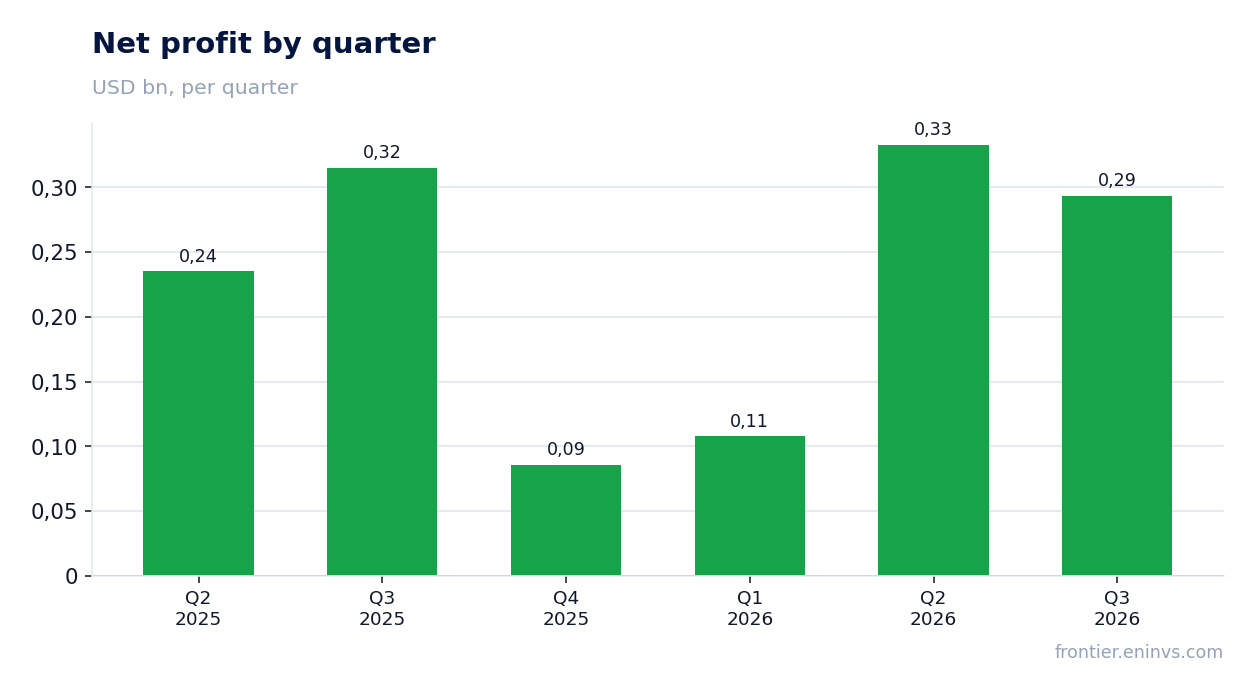
Net profit fell 6.9% despite revenue growth – the net margin dropped from 44.6% to 22.7%
Net profit in the third quarter of 2026 was USD 293.5 million, 6.9% below a year earlier. With revenue up 83.4% and EBITDA up 90.9%, this gap means costs arose below operating profit that were absent in the comparable period. The net margin fell to 22.7% from 44.6%.
Operating profit rose to USD 591.1 million, so the entire gap formed between operating and net profit. These figures do not break down which line – interest expense, taxes, FX differences or other – produced the effect, so naming a specific cause would be a guess.
For a holder this is the key point of the report: the business performs better at the operating level than a year ago, but a smaller share of profit reaches the shareholder. If the gap is one-off, next quarter's profit will recover; if it reflects recurring interest expense on higher debt, the picture is different.
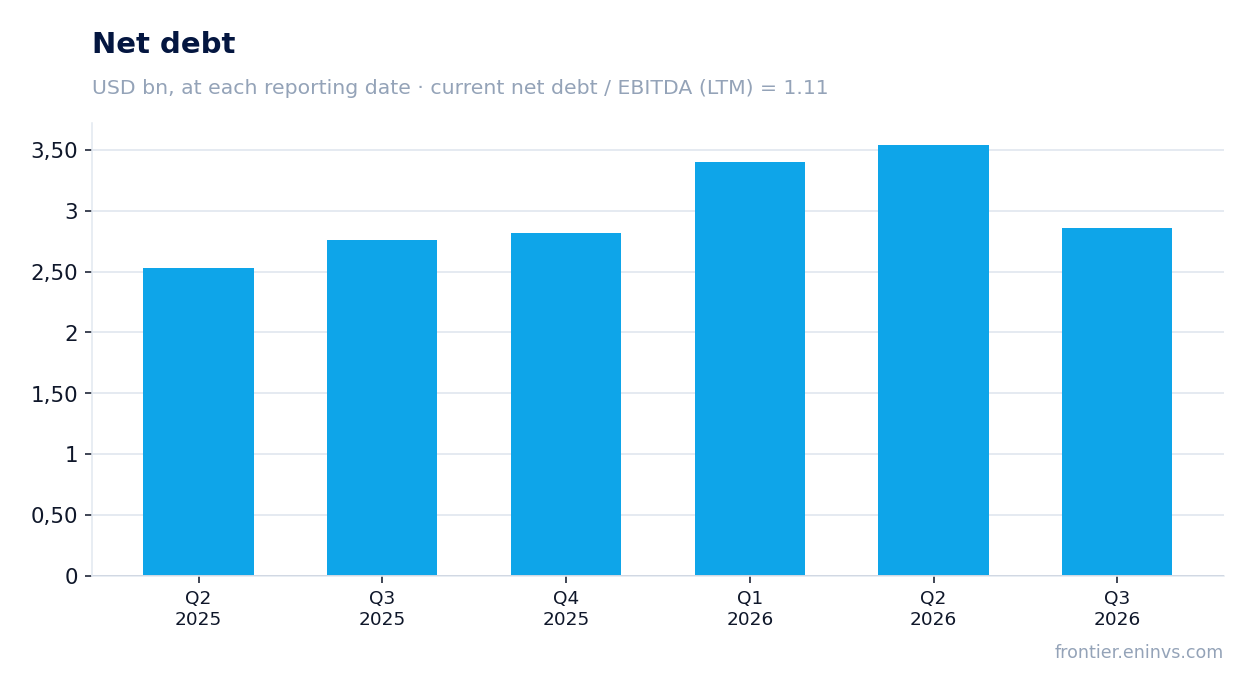
Leverage at 1.11x LTM EBITDA is a moderate level with net debt of USD 2.9 billion
Net debt as of September 30, 2026 was USD 2.9 billion. Against EBITDA for the trailing twelve months of USD 2,580.1 million, that gives a ratio of 1.11. Such a leverage level leaves the company room to manoeuvre and does not pressure profit through interest expense.
Debt dynamics: from June 30, 2026, net debt declined from USD 3.5 billion to USD 2.9 billion, a decrease of USD 0.7 billion over the quarter. Over the year, from September 30, 2025, it rose from USD 2.8 billion to USD 2.9 billion – an increase of USD 0.1 billion. The quarterly decline is notably larger than the annual increase, indicating strong operating cash flow in the third quarter.
Operating cash flow in the third quarter of 2026 was USD 772.8 million. That is more than enough to service debt, and it is what allowed net debt to decline over the quarter. At 1.11x LTM EBITDA, the company retains the ability to fund development without a significant increase in borrowings.
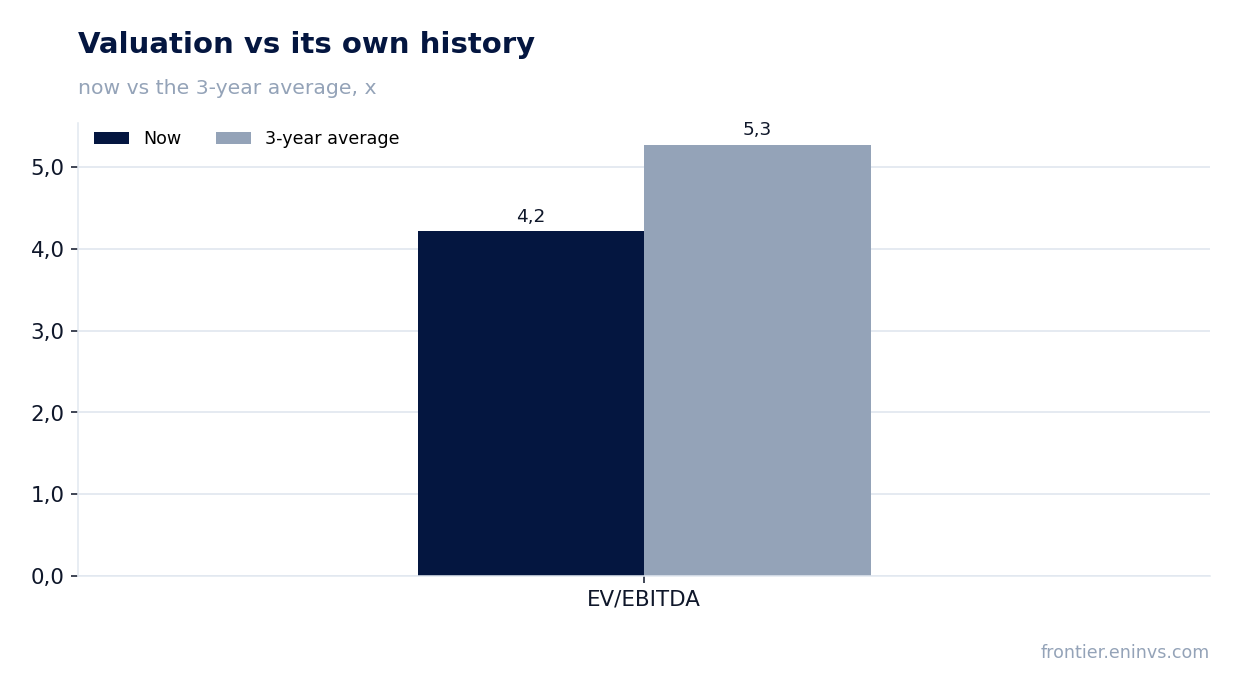
EV/EBITDA of 4.2 is 20% below its own three-year average of 5.3 – the stock is cheaper than its history
The EV/EBITDA multiple for the trailing twelve months is 4.2. Its own three-year average is 5.3. The current value is 20% below the historical level, meaning on this measure the stock trades cheaper than it usually has over the past three years.
The P/E for the trailing twelve months is 9.8 on LTM profit of USD 819.9 million. Return on equity is 33.1%. The combination of a low P/E and high ROE suggests the market values the company's profit cautiously despite its current return.
Market capitalisation is USD 8,050.9 million. With LTM EBITDA of USD 2,580.1 million and net debt of USD 2.9 billion, the evolution of the multiple will depend on whether the high margin persists. If EBITDA stays at the trailing-twelve-month level, the current valuation looks depressed relative to its own history; if the margin compresses, the multiple will prove higher than calculated.
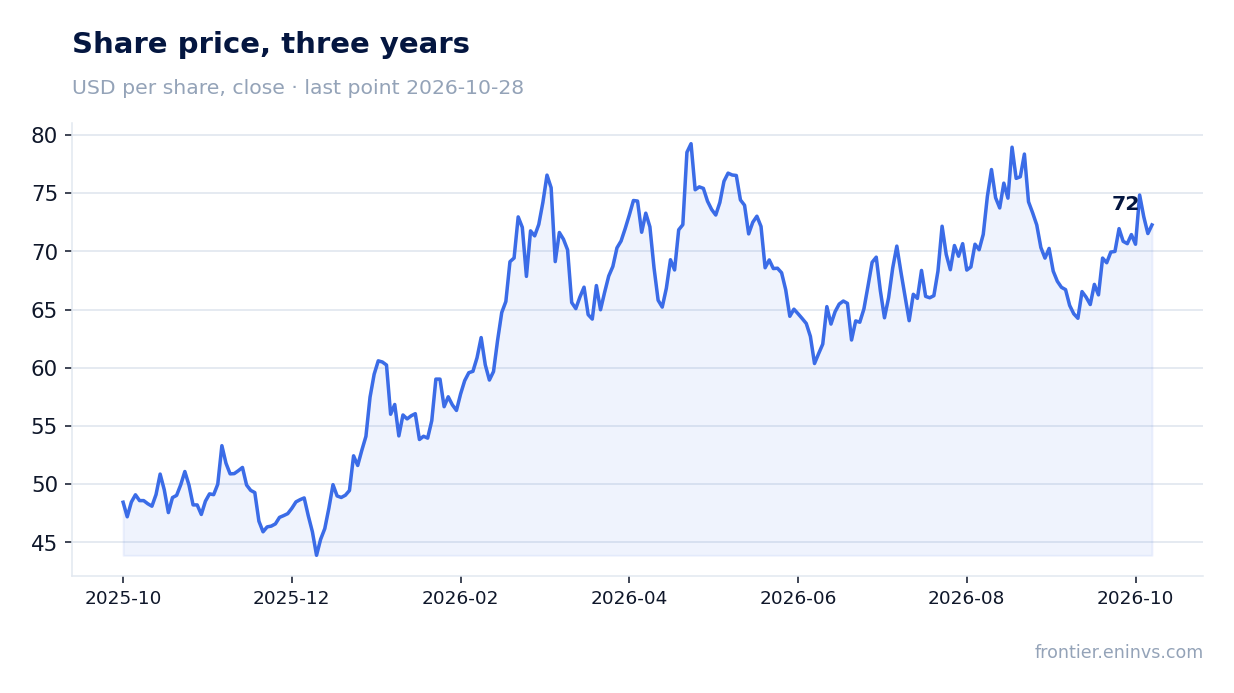
On the portal's model, the upside to fair value is estimated at +67%
On the portal's model, which re-prices EBITDA at current commodity prices and the target EV/EBITDA, the upside of the share to fair value is estimated at +67%. This is the portal's own estimate, not a market consensus and not a target price.
The model rests on two assumptions: current commodity prices and the target multiple. If oil prices decline, re-priced EBITDA will be lower and the upside will shrink. If the market continues to value the company below its historical average, the gap may persist longer than the model assumes.
Nevertheless, the combination of a multiple below its own history, moderate debt and a high operating margin makes such a valuation reasonable. For an investor this is a benchmark, not a guarantee: realisation of the upside depends on whether the company sustains its current EBITDA level.
Valuation on the latest reported figures
| Metric | Value |
|---|---|
| Market cap | 8.05 bn USD |
| P/E (LTM) | 9.8 |
| EV/EBITDA (LTM) | 4.2 |
| P/B | 3.21 |
| Net debt / EBITDA (LTM) | 1.11 |
| Operating cash flow (LTM) | 2.28 bn |
| ROE | 33.1% |
| EV/EBITDA, 3-year average | 5.3 |
Bottom line
The report's strength is operational: revenue grew 83.4%, EBITDA 90.9%, the margin rose to 68.3%, and net debt declined over the quarter from USD 3.5 billion to USD 2.9 billion. The weakness is net profit: it fell 6.9%, and the net margin contracted from 44.6% to 22.7%, which needs explanation in the next report. The EV/EBITDA multiple of 4.2 is 20% below its own three-year average of 5.3, and leverage at 1.11x LTM EBITDA remains moderate. The question for a holder now is whether the fall in net profit is one-off and whether the high EBITDA margin will persist at current prices. The verdict is 'rather attractive': a valuation below its own history and moderate debt outweigh the uncertainty over net profit.
Open the company's financial profile VIST →
See also: market overview · valuation map · stock screeners