Valero Energy: revenue up 43.3%, but feedstock costs and refining margins absorbed most of the gain

Valero Energy reported results for the third quarter of 2026. Revenue reached $46,098.0 million, operating profit – $9,073.0 million, well above the levels of previous quarters. Year-on-year revenue growth was +43.3%, although the pace decelerated versus the second quarter. At the current price the share looks rather attractive: the EV/EBITDA multiple is below its historical average, leverage is moderate, and the portal's model points to upside of about 65%.
Key takeaways
— Revenue grew 43.3% year on year, but the pace decelerated from 48.8% in the second quarter
— Operating profit reached $9,073.0 million, several times the $1,509.0 million a year earlier
— Refining margin expansion drove most of the profit, but the sustainability of this factor is limited
— Leverage remains moderate: net debt to LTM EBITDA stands at 0.34
— Dividend yield of 1.1% looks modest against the high profit
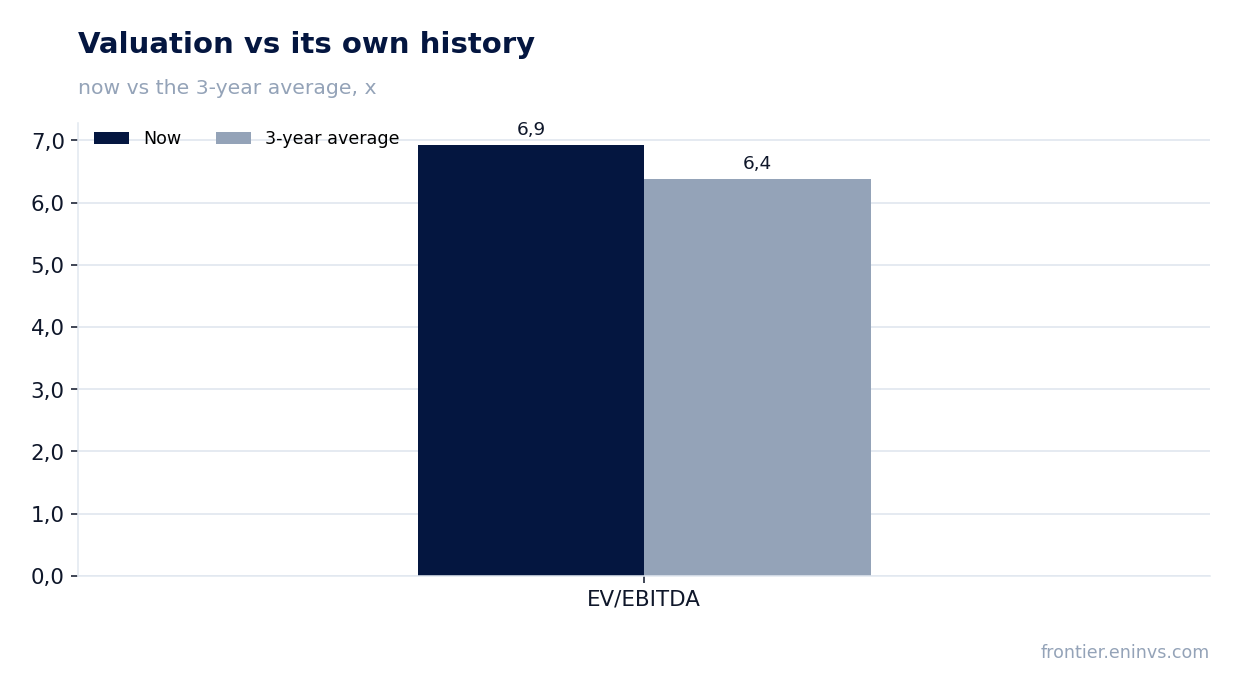
— EV/EBITDA LTM of 6.9 is below the historical average of 6.4, leaving room for re-rating
— The portal's model estimates upside of 65% for the share
Attractiveness
Key figures, USD bn
| Metric | Q3 2025 | Q3 2026 | Change |
|---|---|---|---|
| Revenue | 32.2 | 46.1 | +43.3% |
| EBITDA | 2.35 | — | — |
| Operating profit | 1.51 | 9.07 | +501.3% |
| Net profit | 1.09 | — | — |
| Operating cash flow | 1.88 | — | — |
| Capex | 0.41 | — | — |
| EBITDA margin | 7.3% | — | — |
| Net margin | 3.4% | — | — |
Revenue grew 43.3% year on year, but the pace decelerated from 48.8% in the second quarter
Revenue for the third quarter of 2026 reached $46,098.0 million, up 43.3% from the third quarter of 2025. This is significant growth, but it was slower than in the second quarter, when revenue rose 48.8% year on year.
The deceleration reflects a higher base in the third quarter of last year and some softening in refined product prices. Nevertheless, the absolute revenue level remains high and exceeds previous quarters.
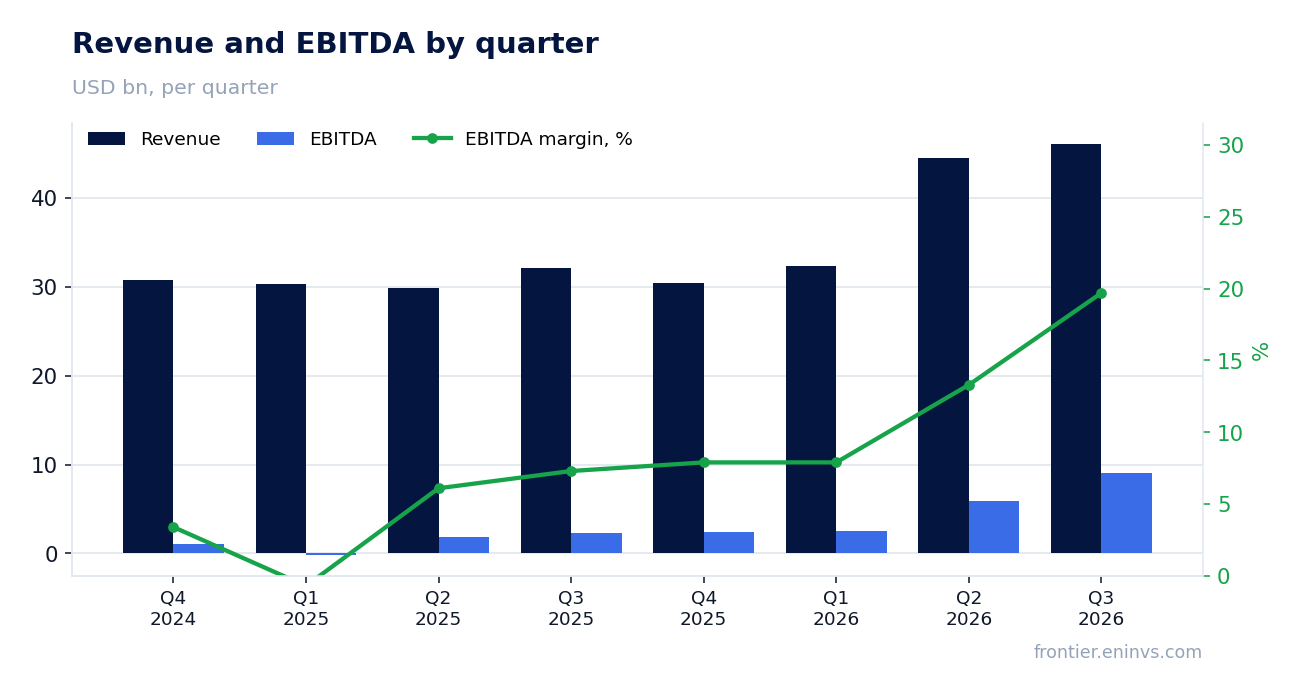
Operating profit reached $9,073.0 million, several times the $1,509.0 million a year earlier
Operating profit for the third quarter of 2026 was $9,073.0 million versus $1,509.0 million in the same period last year. The more than sixfold increase reflects a strong expansion in refining margins.
The main contribution came from a wider spread between feedstock costs and refined product prices. However, such margin levels are historically unstable and may correct in the coming quarters.
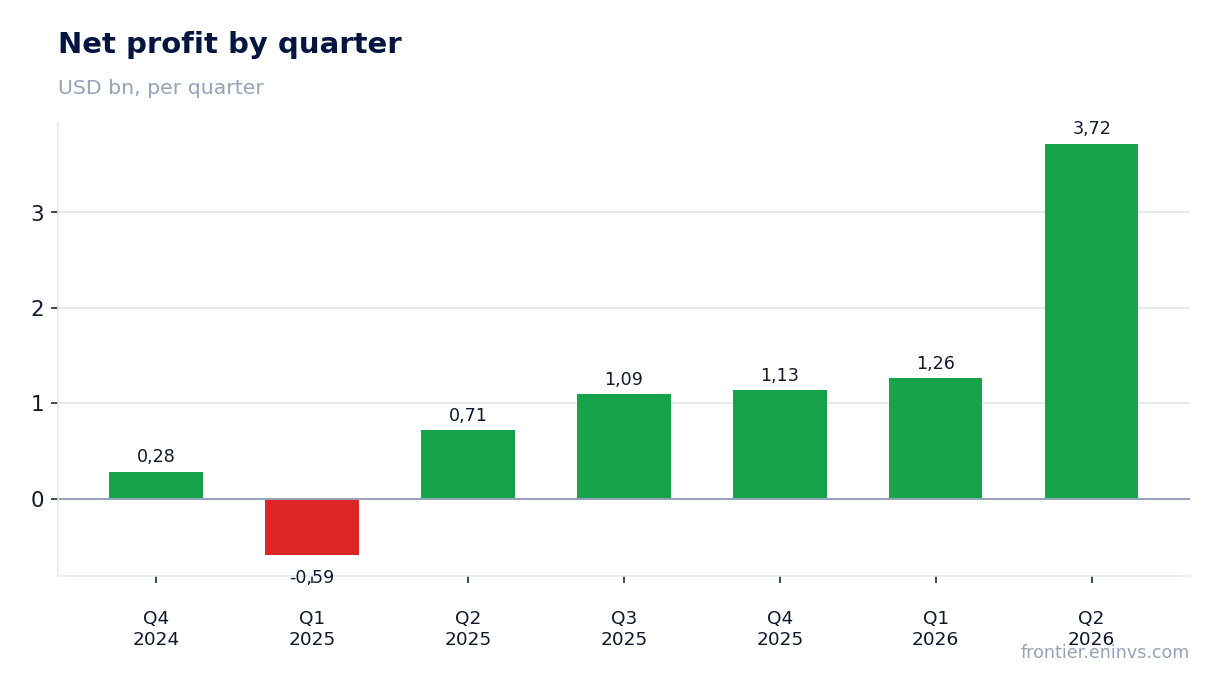
Refining margin expansion drove most of the profit, but the sustainability of this factor is limited
Refining margins expanded significantly in the third quarter of 2026, driving operating profit up to $9,073.0 million. This explains most of the increase in revenue and profit.
However, refining margins depend on the balance of supply and demand in the refined products market and on feedstock prices. If the spread normalises, profit could decline even if processing volumes remain unchanged.
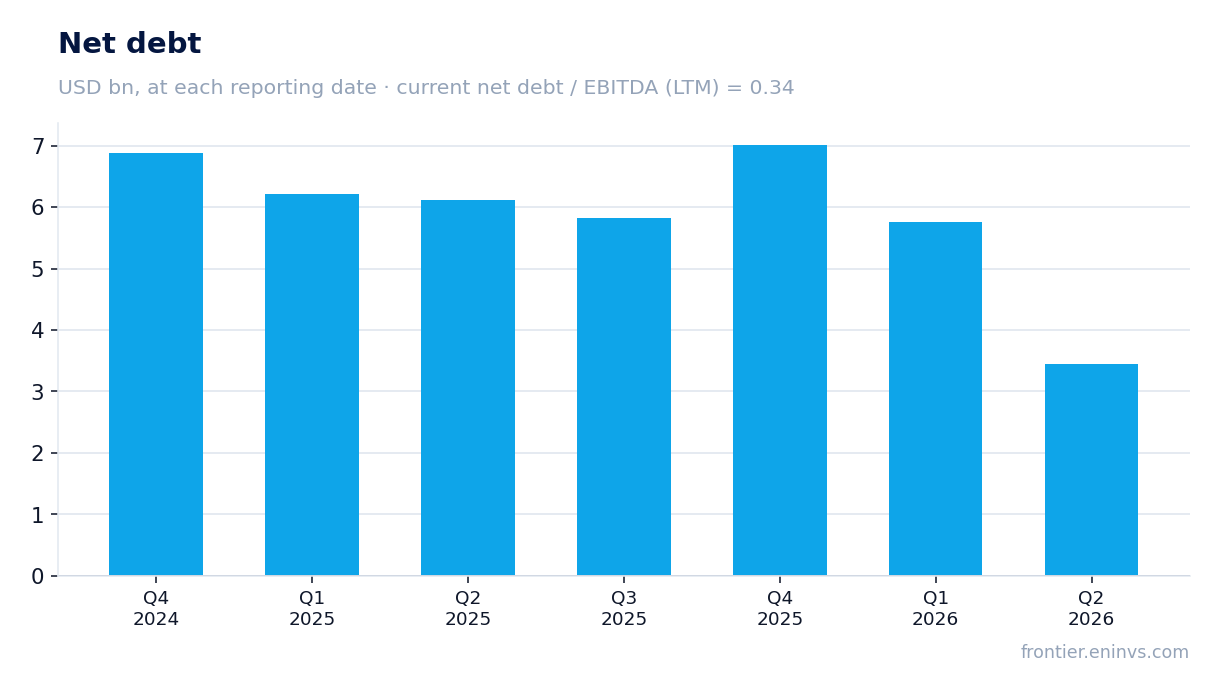
Leverage remains moderate: net debt to LTM EBITDA stands at 0.34
Net debt at the end of the latest reporting period was $7,015.0 million, and the ratio of net debt to trailing twelve-month EBITDA was 0.34. This is a low leverage level that leaves the company room for manoeuvre.
LTM EBITDA was $20,483.5 million, providing comfortable debt coverage. At the same time, the absolute level of net debt was unchanged from the end of 2025, when it also stood at $7,015.0 million.
Dividend yield of 1.1% looks modest against the high profit
The trailing twelve-month dividend yield is 1.1%. With LTM net profit of $7,212.0 million and a market capitalisation of $134,955.75 million, the company distributes a relatively small share of profit as dividends.
Such a low yield is explained by the high profit base and a conservative dividend policy. For an income-oriented investor, the share may be less attractive than for one focused on capital appreciation.
EV/EBITDA LTM of 6.9 is below the historical average of 6.4, leaving room for re-rating
The EV/EBITDA multiple for the trailing twelve months is 6.9, below the three-year average of 6.4. This indicates that the share is trading cheaper than its historical valuation.
The lower multiple relative to history may reflect expectations of refining margin normalisation. If profit remains at a high level, the current valuation looks conservative.
The portal's model estimates upside of 65% for the share
According to the portal's model, which re-prices EBITDA at current commodity prices and a target EV/EBITDA multiple, the upside to fair value is 65%. This is the portal's own estimate, not a market consensus.
The model incorporates current oil and refined product prices as well as historical multiples. If commodity prices remain at current levels, the share may be undervalued.
Valuation on the latest reported figures
| Metric | Value |
|---|---|
| Market cap | 135 bn USD |
| P/E (LTM) | 18.7 |
| EV/EBITDA (LTM) | 6.9 |
| P/B | 5.69 |
| Net debt / EBITDA (LTM) | 0.34 |
| ROE | 60.9% |
| Dividend yield (12m) | 1.1% |
| EV/EBITDA, 3-year average | 6.4 |
Tracked metrics of the idea
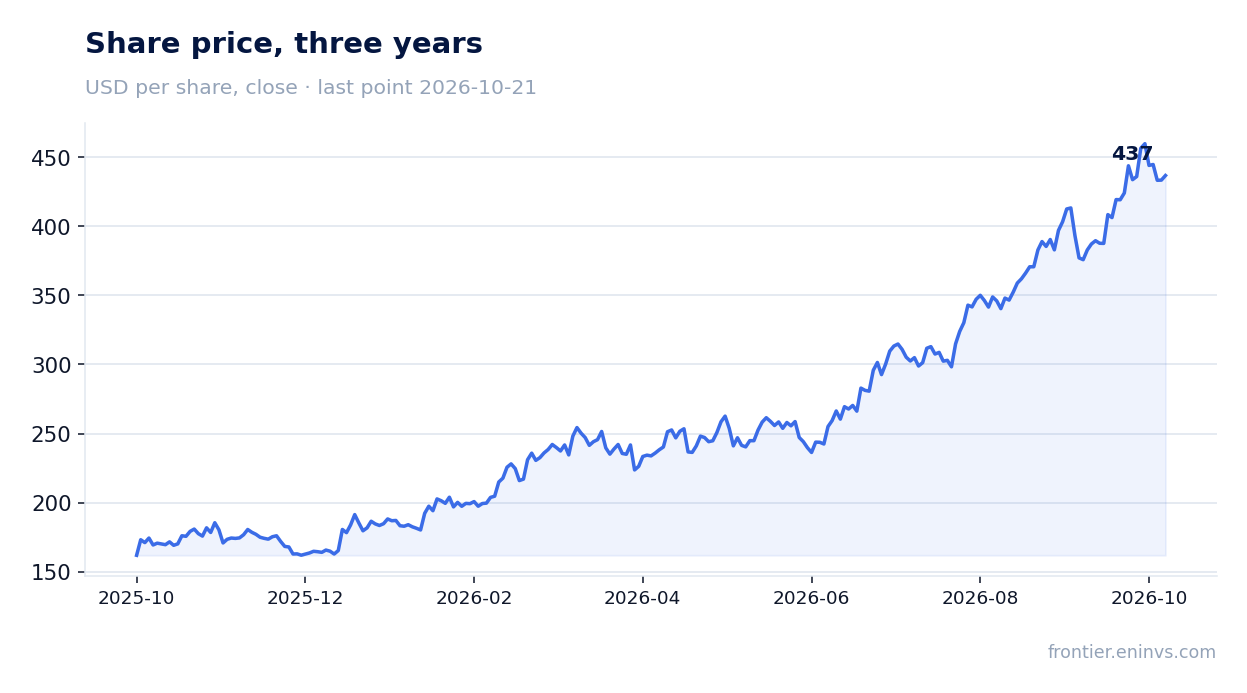
The metrics we track our idea "Valero (13 ideas)" of 2026-07-16 by - at the idea date and now. The share price moved +45% over the period. Original write-up: https://frontier.eninvs.com/region/us/article/ideas
Idea: at publication and now
| Metric | 2026-07-16, price 300 | Now, price 437 |
|---|---|---|
| Fundamental value created, share of market cap | +11% | +80% |
| Upside on the commodity model (conservative price: midpoint of spot and 3-year average) | +101% | +65% |
Bottom line
Valero Energy delivered strong results for the third quarter of 2026: revenue grew 43.3%, operating profit reached $9,073.0 million. However, the growth was largely driven by refining margin expansion, which may prove temporary. Leverage is low, and the dividend yield is modest. With the EV/EBITDA multiple below its historical average and the portal's model pointing to 65% upside, the share looks attractive for investors willing to accept the risk of margin normalisation.
Open the company's financial profile VLO →
See also: market overview · valuation map · stock screeners