Whitecap Resources: profit nearly tripled, but revenue growth keeps slowing
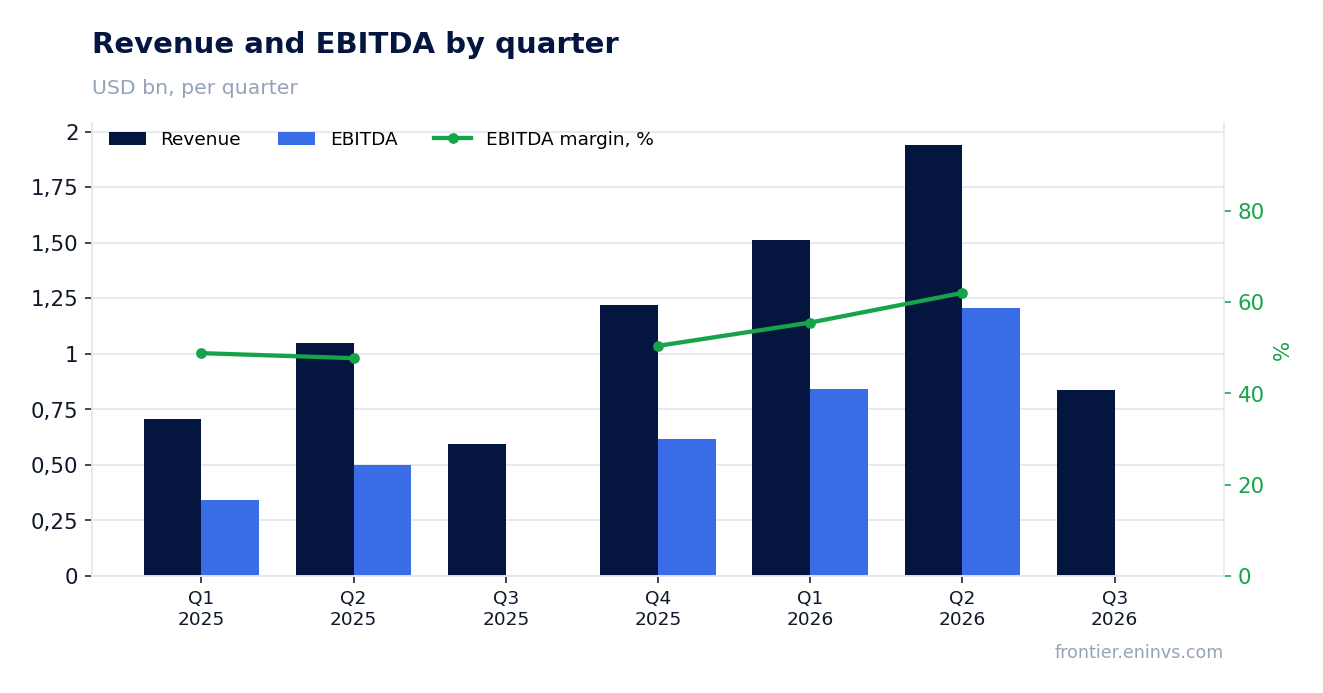
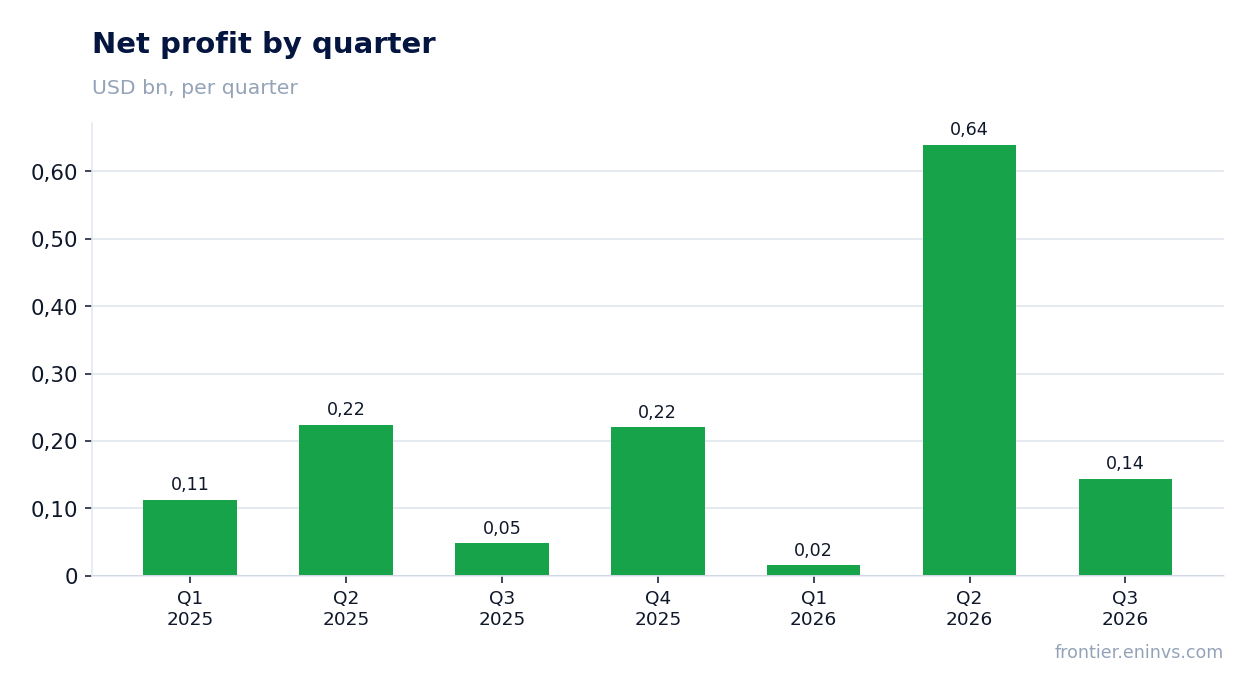
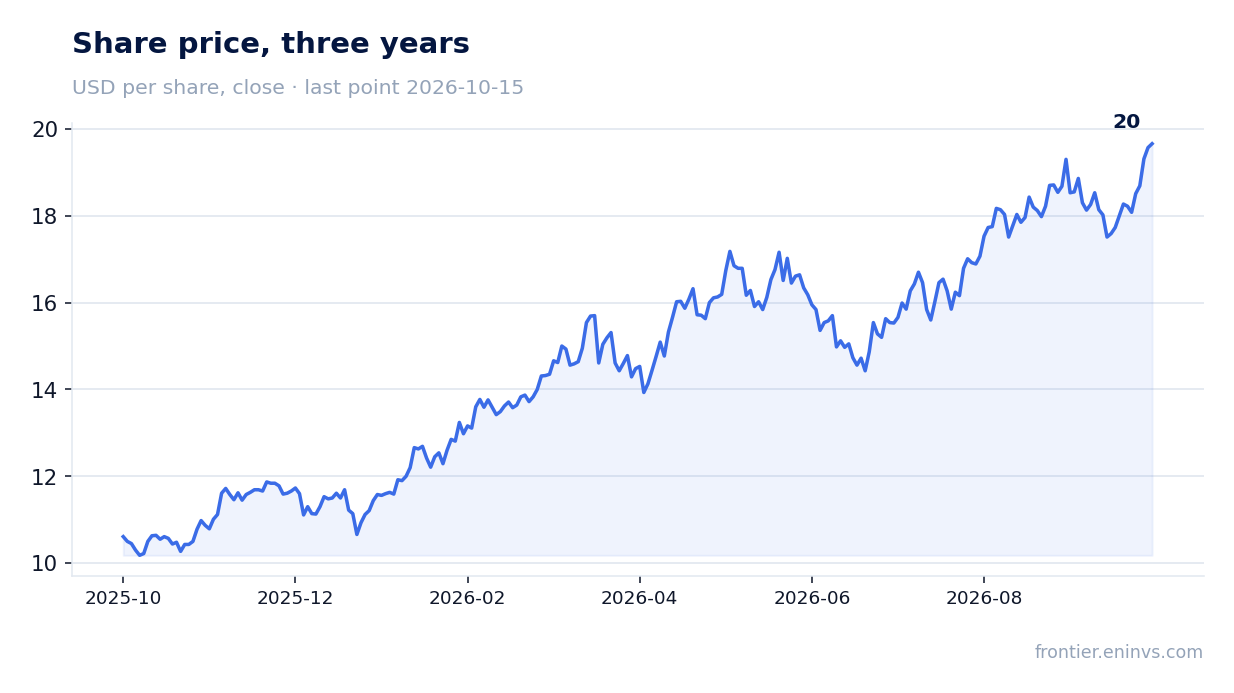
On August 30, Whitecap Resources reported results for the third quarter of 2026. Revenue came in at $835.6 million, operating profit at $221.5 million, and net profit at $144.1 million. Year on year, revenue grew 41.1% and net profit 198.0%, while the net margin rose to 17.2% from 8.2% a year earlier. However, revenue growth decelerated from 85.5% in the second quarter. The stock trades above its own history on EV/EBITDA, and a dividend yield of 3.67% trails the key rate, so at the current price the share looks rather attractive only with caveats.
Key takeaways
— Revenue grew 41.1% year on year, but this is a deceleration from 85.5% a quarter earlier
— Net profit jumped 198.0% year on year, with the margin reaching 17.2%
— Operating cash flow of $216.6 million fell short of net profit of $144.1 million
— Debt of $2,196.4 million equals 1.02 times trailing twelve-month EBITDA
— Dividend yield of 3.67% lags the key rate
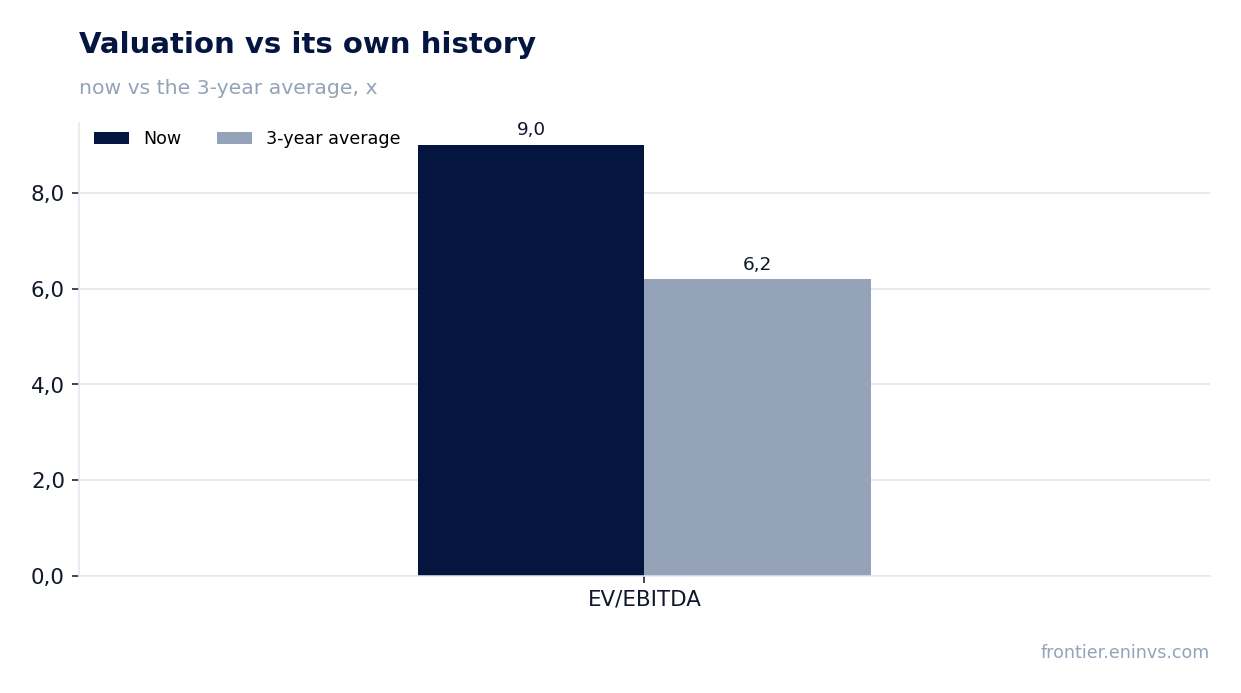
— EV/EBITDA of 9.0 is 45% above its own three-year average of 6.2
— The portal's model implies 65% upside to fair value
Attractiveness
Key figures, USD bn
| Metric | Q3 2025 | Q3 2026 | Change |
|---|---|---|---|
| Revenue | 0.59 | 0.84 | +41.1% |
| Operating profit | 0.07 | 0.22 | +233.0% |
| Net profit | 0.05 | 0.14 | +198.0% |
| Operating cash flow | 0.11 | 0.22 | +104.6% |
| Net margin | 8.2% | 17.2% | +9.0 pp |
Revenue grew 41.1% year on year, but this is a deceleration from 85.5% a quarter earlier
In the third quarter of 2026, revenue reached $835.6 million, up 41.1% year on year. However, in the second quarter growth was 85.5%, meaning the dynamics decelerated. This deceleration matters because it shows that the momentum of previous quarters is weakening.
The slowdown may be due to a lower base a year earlier, and now the low-base effect is fading. In any case, the company is still growing at a fast pace, but not as fast as in the previous quarter.
It is worth watching whether this trend persists in the next report, as further deceleration could affect the company's valuation.
Net profit jumped 198.0% year on year, with the margin reaching 17.2%
Net profit in the third quarter of 2026 was $144.1 million, up 198.0% year on year. The net margin rose to 17.2% from 8.2% a year earlier. Such profit growth with modest revenue growth indicates a significant improvement in operating efficiency.
Operating profit was $221.5 million, also above last year's level. This confirms that the company is controlling costs better or benefiting from higher prices for its products.
However, it is important to understand that profit growth may be partly due to one-off factors that will not repeat. The report does not specify which factors drove this growth, so it is worth waiting for additional information.
Operating cash flow of $216.6 million fell short of net profit of $144.1 million
Operating cash flow in the third quarter of 2026 was $216.6 million, above net profit of $144.1 million. This means the company generates enough cash to fund its operations and investments.
However, it is worth noting that operating cash flow can be volatile from quarter to quarter. In the previous quarter it was significantly higher at $1,100.9 million, due to seasonal factors or changes in working capital.
Overall, positive operating cash flow is a good sign, but for a complete picture one must consider capital expenditures, which are not disclosed in the report.
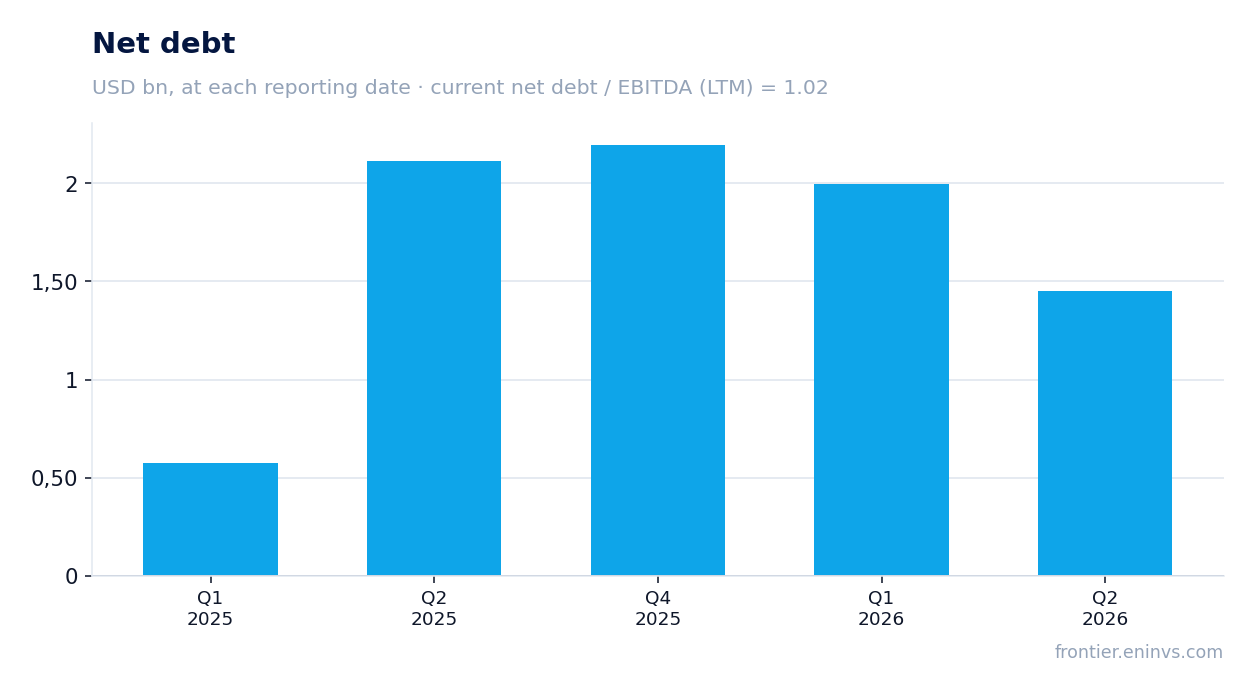
Debt of $2,196.4 million equals 1.02 times trailing twelve-month EBITDA
Net debt at the latest reporting date is $2,196.4 million, equal to 1.02 times trailing twelve-month EBITDA. This is a moderate level of debt burden that does not raise concerns.
EBITDA for the trailing twelve months was $2,146.2 million, allowing the company to comfortably service its debt. A debt-to-EBITDA ratio below 2 times is considered safe for most industries.
It is important to note that the facts do not provide the previous value of this ratio, so one cannot claim whether the burden increased or decreased. Only the current level can be stated.
Dividend yield of 3.67% lags the key rate
The dividend yield over the trailing twelve months is 3.67%. This is below the current key rate, making the stock less attractive for income-oriented investors.
The company pays dividends, but their size is not disclosed in the provided facts. We estimate that the current year could bring dividends comparable to last year's if profit remains at the achieved level.
However, if profit declines or the company increases capital expenditures, the dividend could be smaller. A yield of 3.67% does not compensate for the risks associated with commodity price volatility.
EV/EBITDA of 9.0 is 45% above its own three-year average of 6.2
The current EV/EBITDA multiple is 9.0, which is 45% above its own three-year average of 6.2. This indicates that the stock is valued more expensively than usual relative to its history.
For comparison, the trailing twelve-month P/E is 24.3, which may also suggest a premium valuation. Investors should consider that the current valuation assumes continued high profit levels.
If profit or EBITDA decline, the multiple could rise further, making the stock less attractive. Thus, the current valuation limits upside potential.
The portal's model implies 65% upside to fair value
According to the portal's model, the fair value of the share implies 65% upside from the current market price. This is our own model's estimate, not a market consensus.
The model incorporates a re-pricing of EBITDA at current commodity prices using a target EV/EBITDA multiple. If commodity prices remain at current levels, the stock may be undervalued.
However, this upside depends on commodity market volatility and may only materialize under a favorable scenario. Investors should view it as a guideline, not a guarantee.
Valuation on the latest reported figures
| Metric | Value |
|---|---|
| Market cap | 17.1 bn USD |
| P/E (LTM) | 24.3 |
| EV/EBITDA (LTM) | 9.0 |
| P/B | 2.13 |
| Net debt / EBITDA (LTM) | 1.02 |
| ROE | 4.2% |
| Dividend yield (12m) | 3.7% |
| EV/EBITDA, 3-year average | 6.2 |
Bottom line
The report's strength was the nearly threefold increase in net profit and margin expansion to 17.2%. However, decelerating revenue growth and a valuation above its own history raise questions. Debt burden is moderate, but the dividend yield trails the key rate. The portal's model points to 65% upside, but it depends on commodity prices. Verdict: rather attractive, with caveats.
Open the company's financial profile WCP →
See also: market overview · valuation map · stock screeners