West Fraser Timber: revenue up 17%, but profit remains elusive
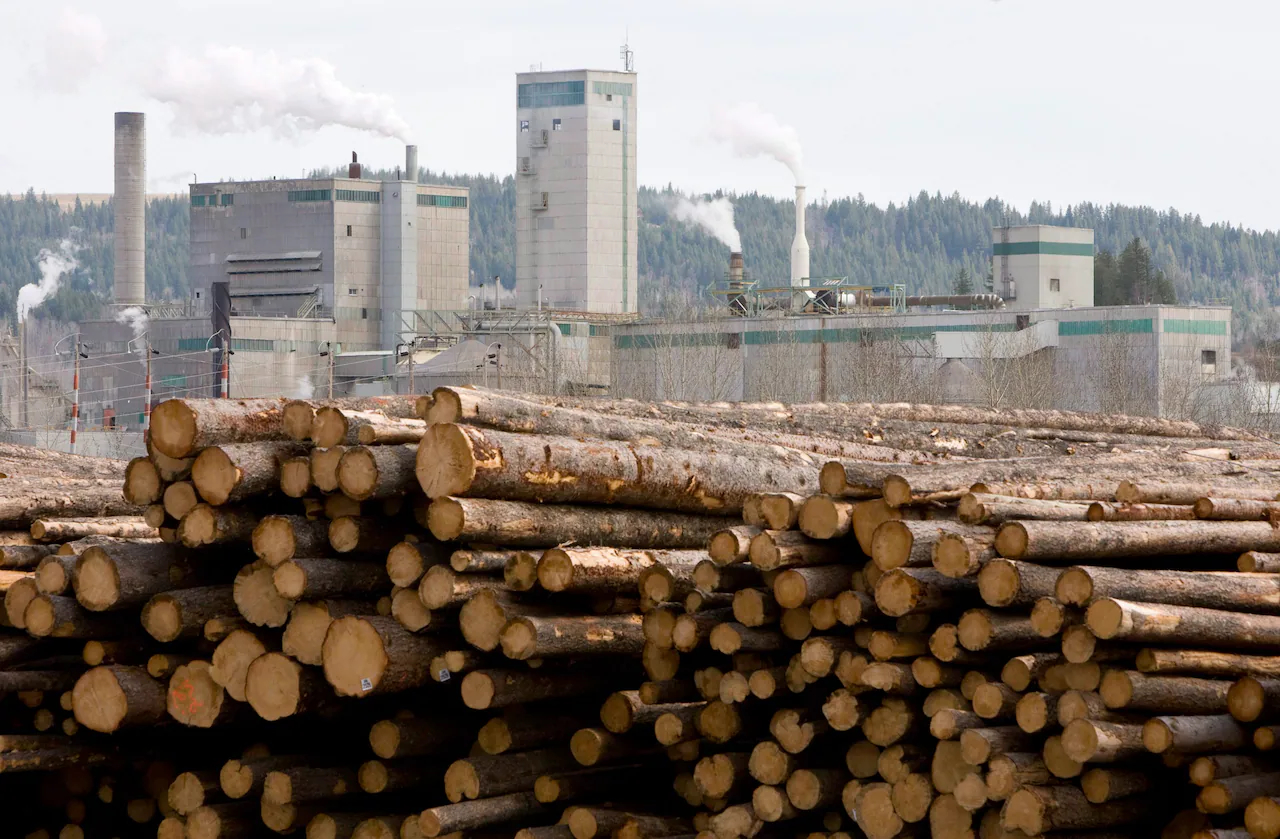
On October 2, 2026, West Fraser Timber released its fourth-quarter 2026 results. Revenue came in at $1,363.0 million, up 17.0% year-on-year. Operating cash flow was positive at $72.0 million, while net debt stood at $329.0 million at period end. However, profitability remains under pressure: trailing-twelve-month ROE is negative at -4.4%. At the current price, the shares look neutral: revenue growth is encouraging, but the lack of sustainable profit and elevated leverage prevent an attractive rating.
Key takeaways
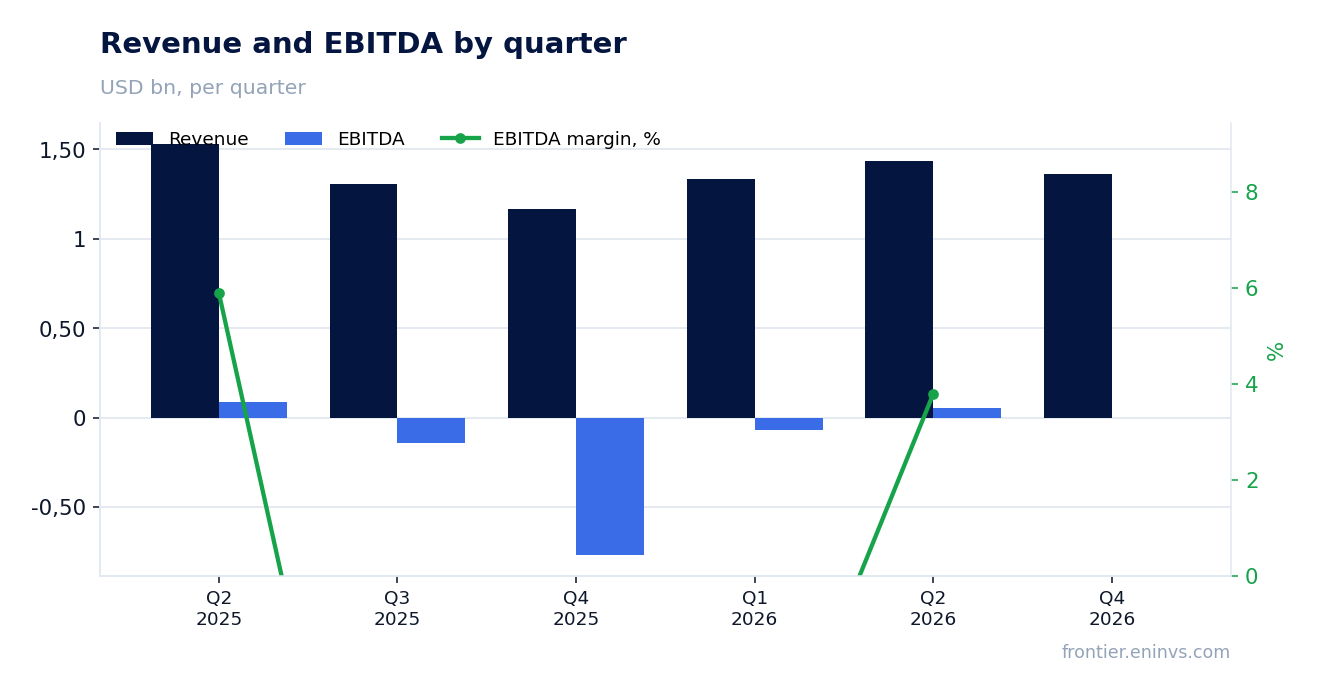
— Q4 2026 revenue rose 17.0% to $1,363.0 million, but this did not translate into profit growth
— Operating cash flow remains positive at $72.0 million for the quarter, but it is insufficient to cover capex and dividends
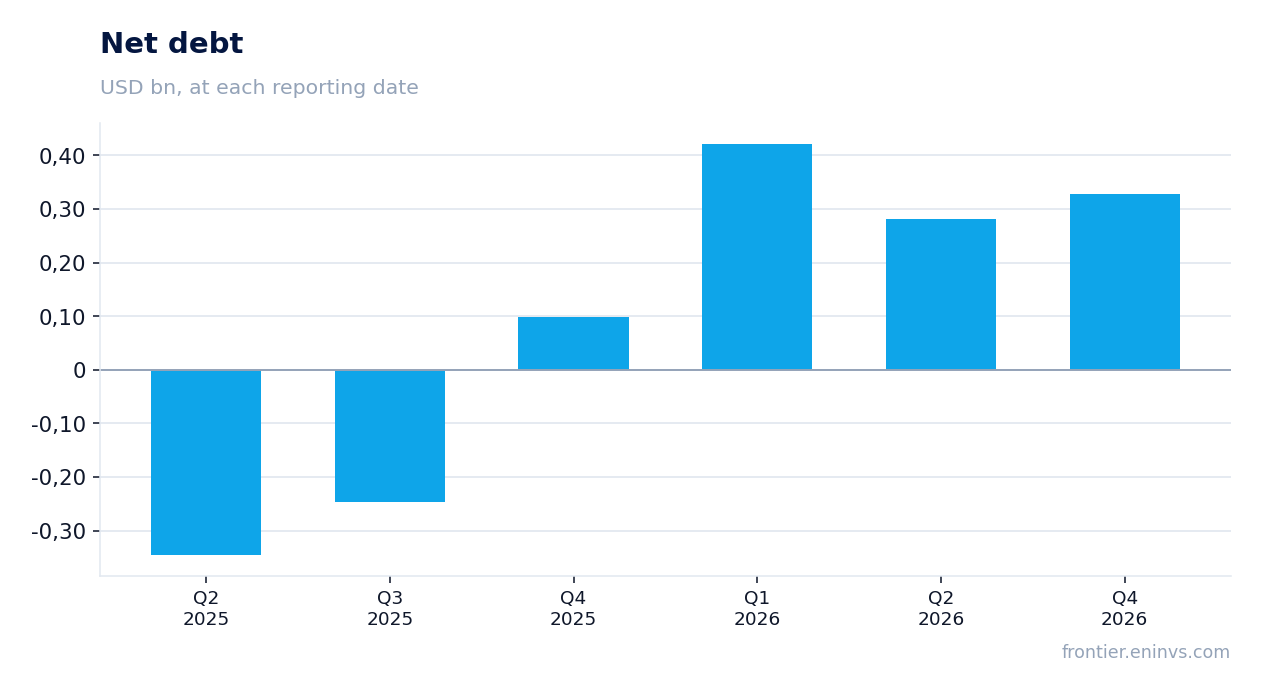
— Net debt increased to $329.0 million from -$346.0 million a year earlier, limiting financial flexibility
— Return on equity is negative (-4.4%), indicating unprofitability over the trailing twelve months
— Dividend yield is 1.4%, below the key rate and insufficient to compensate for risks
— Valuation is difficult due to lack of profit, but market capitalization of $5,339.3 million suggests investor optimism
Attractiveness
Key figures, USD bn
| Metric | Q4 2025 | Q4 2026 | Change |
|---|---|---|---|
| Revenue | 1.17 | 1.36 | +17.0% |
| EBITDA | -0.77 | — | — |
| Operating profit | -0.91 | — | — |
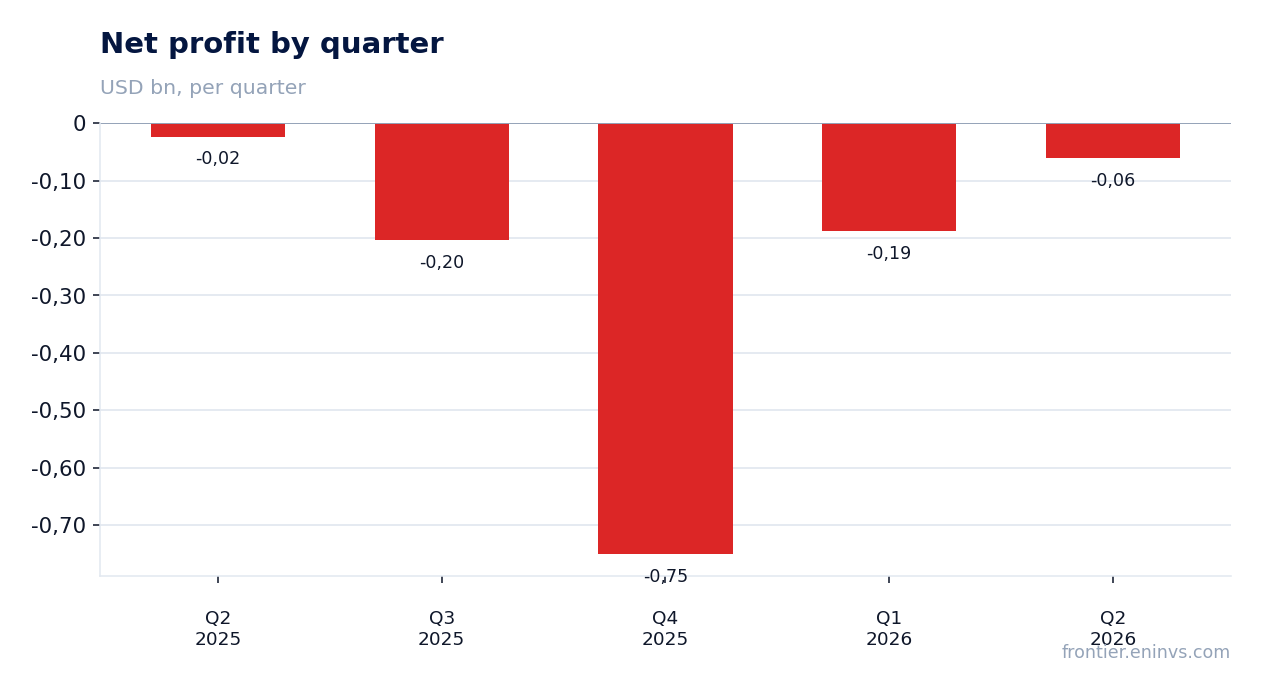
| Net profit | -0.75 | — | — |
| Operating cash flow | -0.17 | 0.07 | to profit |
| Capex | 0.14 | — | — |
| EBITDA margin | -66.1% | — | — |
| Net margin | -64.5% | — | — |
Q4 2026 revenue rose 17.0% to $1,363.0 million, but this did not translate into profit growth
Q4 2026 revenue came in at $1,363.0 million, up 17.0% year-on-year. The revenue growth is set against a backdrop of recovering demand for forestry products.
However, despite the revenue increase, the company failed to show positive profit dynamics. Over the trailing twelve months, ROE remains negative at -4.4%, indicating continued losses.
Operating efficiency remains low: in previous quarters of 2026, operating profit was negative, and although Q4 data is not available, no sustained improvement is evident.
Operating cash flow remains positive at $72.0 million for the quarter, but it is insufficient to cover capex and dividends
Operating cash flow in Q4 2026 was $72.0 million, lower than the previous quarter's $192.0 million but above the negative $172.0 million a year earlier.
Capital expenditures for the quarter are not disclosed, but in previous quarters of 2026 they ranged from $65.0 to $94.0 million. At this investment level, operating cash flow barely covers capex.
Dividend payments also require funds: with a 1.4% yield and market capitalization of $5,339.3 million, annual dividends amount to about $75 million, comparable to quarterly operating cash flow.
Net debt increased to $329.0 million from -$346.0 million a year earlier, limiting financial flexibility
Net debt as of October 2, 2026, stood at $329.0 million, whereas on September 30, 2025, it was negative at -$346.0 million, meaning the company shifted from a net cash position to debt.
Over the past 12 months, net debt increased by $0.6 billion (from -$0.2 billion on September 30, 2025, to $0.3 billion on October 2, 2026). This is a significant change that reduces the company's resilience to adverse conditions.
The debt increase occurred against a backdrop of negative operating results in previous quarters, forcing the company to raise borrowed funds to finance ongoing operations and investments.
Return on equity is negative (-4.4%), indicating unprofitability over the trailing twelve months
Return on equity (ROE) over the trailing twelve months was -4.4%. This means the company is generating losses rather than profit, which negatively affects shareholder value.
Negative ROE persists despite revenue growth in Q4. This indicates that revenue growth is not accompanied by improved operating efficiency and cost control.
For investors, negative ROE is a signal that the company is destroying rather than creating value, which limits the upside potential of the shares.
Dividend yield is 1.4%, below the key rate and insufficient to compensate for risks
Dividend yield over the trailing twelve months is 1.4%. This is a low level that does not even cover current inflation and is significantly below the key rate.
The company pays dividends, but their size is unstable and depends on profit, which has been negative in recent periods. If losses persist, there is a risk of dividend cuts or suspension.
For income-oriented investors, West Fraser Timber's dividend yield is not attractive, especially given the risks associated with the cyclical nature of the forestry industry.
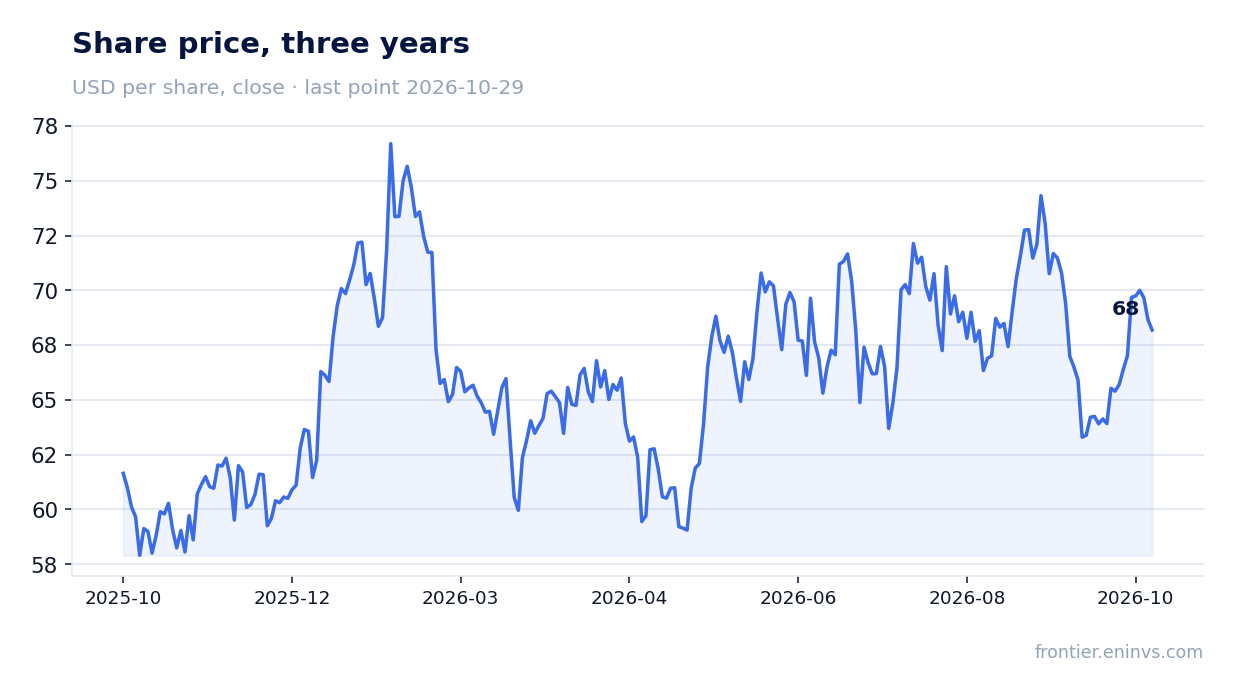
Valuation is difficult due to lack of profit, but market capitalization of $5,339.3 million suggests investor optimism
The company's market capitalization is $5,339.3 million. With negative profit, traditional multiples such as P/E are not applicable.
Investors are likely valuing the company based on expectations of industry recovery and future profits. However, current financial results do not justify an optimistic valuation.
Comparison with historical multiples is impossible due to the lack of profit, but it can be noted that market capitalization exceeds net debt, indicating some margin of safety but not guaranteeing growth.
Valuation on the latest reported figures
| Metric | Value |
|---|---|
| Market cap | 5.34 bn USD |
| P/B | 0.91 |
| ROE | -4.4% |
| Dividend yield (12m) | 1.4% |
Bottom line
Bottom line: West Fraser Timber's Q4 2026 revenue rose 17.0% to $1,363.0 million, which is a strong point of the report. However, the company remains loss-making (ROE -4.4%), and net debt increased to $329.0 million, limiting financial flexibility. A dividend yield of 1.4% does not compensate for the risks. At the current price, the shares look neutral: revenue growth is encouraging, but the lack of profit and debt burden prevent an attractive rating. A change in verdict would require sustainable profit and debt reduction.
Open the company's financial profile WFG →
See also: market overview · valuation map · stock screeners