Weyerhaeuser: revenue accelerated to +8.4%, but profit fell by a quarter – price, not volume, did the work
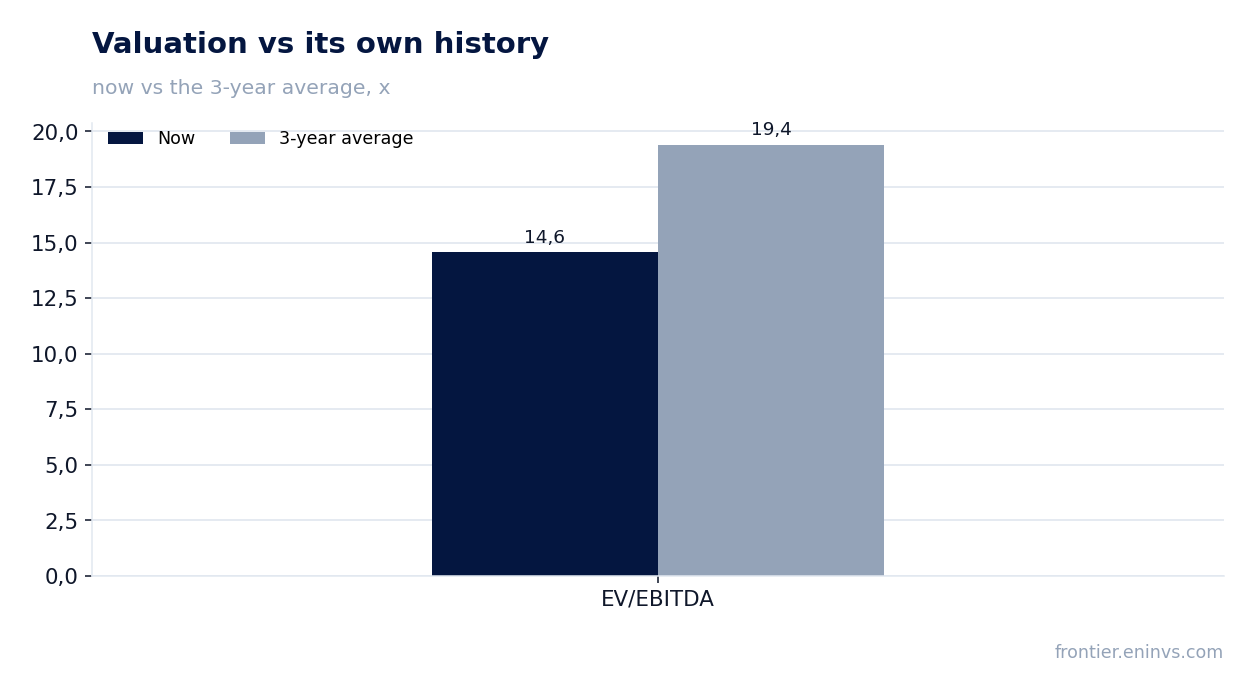
On 29 October Weyerhaeuser reported third-quarter 2026 results: revenue of USD 1,862.0 million, adjusted EBITDA of USD 248.0 million and net profit of USD 61.0 million. Revenue growth accelerated to 8.4% year on year from a 0.9% decline a quarter earlier, but EBITDA fell 2.0% and net profit 23.8%, with the margin narrowing from 14.7% to 13.3%. The stock trades below its own three-year EV/EBITDA history (14.6 versus 19.4), pays a dividend yielding 4.3% and looks rather attractive, though weak profit and leverage of 3.92x EBITDA leave room for doubt.
Key takeaways
— Revenue grew 8.4% year on year, and wood products plus lumber prices delivered nearly all of the gain
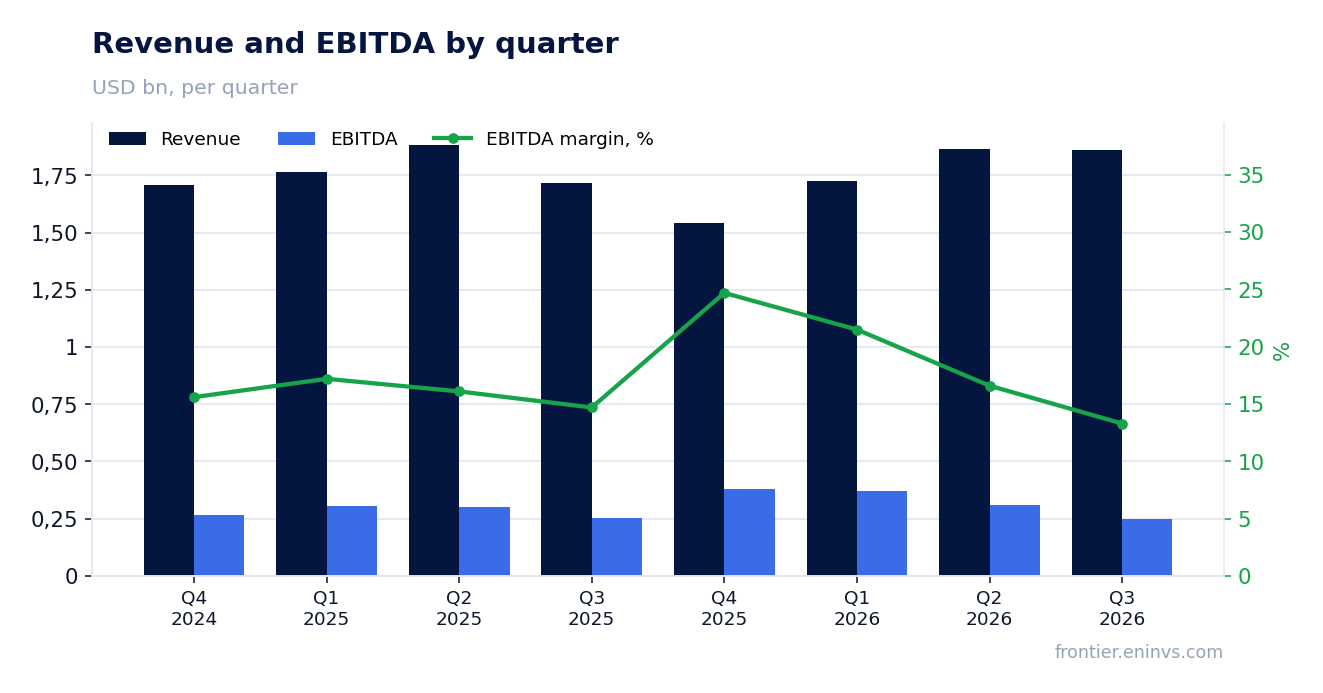
— EBITDA fell 2.0% because the margin narrowed from 14.7% to 13.3%
— Net profit dropped 23.8% to USD 61.0 million, and there are no one-offs left in it
— Leverage of 3.92x EBITDA is serviced by quarterly interest expense of USD 63.0 million
— The USD 0.21 per-share dividend yields 4.3% and rests on profit before special items
— The stock is cheaper than its own history on EV/EBITDA: 14.6 versus 19.4 over three years
Attractiveness
Key figures, USD bn
| Metric | Q3 2025 | Q3 2026 | Change |
|---|---|---|---|
| Revenue | 1.72 | 1.86 | +8.4% |
| EBITDA | 0.25 | 0.25 | -2.0% |
| Operating profit | 0.12 | 0.10 | -18.7% |
| Net profit | 0.08 | 0.06 | -23.8% |
| Operating cash flow | 0.21 | 0.19 | -8.1% |
| Capex | 0.59 | — | — |
| EBITDA margin | 14.7% | 13.3% | -1.4 pp |
| Net margin | 4.7% | 3.3% | -1.4 pp |
Revenue grew 8.4% year on year, and wood products plus lumber prices delivered nearly all of the gain
Third-quarter 2026 revenue was USD 1,862.0 million against USD 1,717.0 million a year earlier, up 8.4%. A quarter earlier it had fallen 0.9%, so the trend accelerated. Wood products delivered the main contribution: sales rose to USD 1,385.0 million from USD 1,228.0 million a year earlier.
Within wood products, structural lumber revenue climbed to USD 629.0 million from USD 509.0 million, and the realised price rose to USD 510 per thousand board feet from USD 405 a year earlier. Sales volume was almost flat at 1,233 versus 1,259. The gain came from price, not quantity.
Timberlands moved the other way: third-party sales fell to USD 378.0 million from USD 386.0 million. Strategic Land Solutions brought in USD 99.0 million against USD 103.0 million, with real estate sales down to USD 51.0 million from USD 62.0 million and the price per acre down to USD 3,945 from USD 5,128. The top-line growth rests on a single segment.
EBITDA fell 2.0% because the margin narrowed from 14.7% to 13.3%
Adjusted EBITDA for third-quarter 2026 was USD 248.0 million against USD 253.0 million a year earlier, down 2.0%. The margin fell from 14.7% to 13.3%. Revenue grew, so the entire effect came from cost of sales, which rose to USD 1,605.0 million from USD 1,513.0 million, and gross margin narrowed to USD 257.0 million from USD 204.0 million only nominally.
The segments diverge. Timberlands EBITDA fell to USD 133.0 million from USD 148.0 million, and Strategic Land Solutions to USD 86.0 million from USD 91.0 million. Wood products, by contrast, rose to USD 91.0 million from USD 8.0 million a year earlier, but that base included one-off charges, so the comparison is distorted.
Operating profit fell to USD 100.0 million from USD 123.0 million. It no longer contains timberland sales, which brought USD 129.0 million in the first half of 2026. Without them the profit base is thinner, and that shows in the bottom line.
Net profit dropped 23.8% to USD 61.0 million, and there are no one-offs left in it
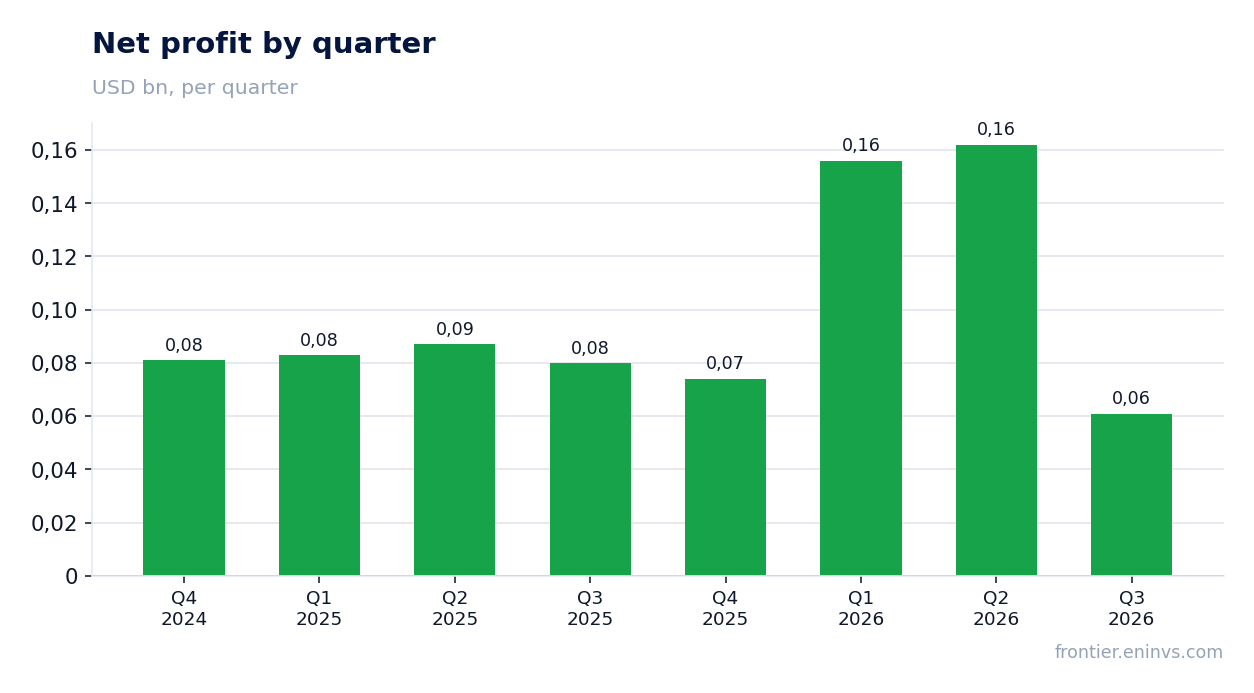
Third-quarter 2026 net profit was USD 61.0 million against USD 80.0 million a year earlier, down 23.8%. The net margin fell from 4.7% to 3.3%. Earnings per share were USD 0.08 against USD 0.11.
There were no special items in the reported quarter at all, whereas a year earlier a lumber mill sale, an insurance recovery and timberland sales added to profit. Profit before special items was USD 61.0 million against USD 40.0 million a year earlier, so the underlying result grew, and the fall in the bottom line is explained precisely by the disappearance of one-off income.
For the nine months of 2026, profit before special items was USD 229.0 million against USD 210.0 million a year earlier. Special items added USD 150.0 million over the period, almost all of it timberland sales in the first and second quarters. That support will not repeat.
Leverage of 3.92x EBITDA is serviced by quarterly interest expense of USD 63.0 million
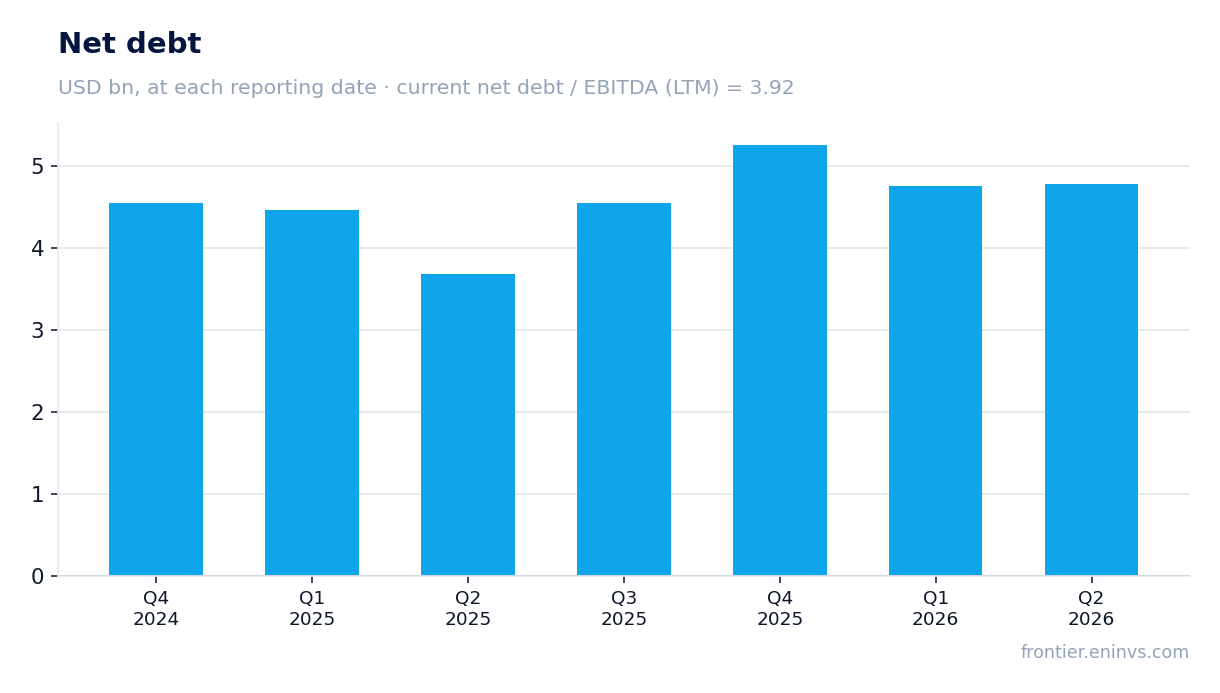
Net debt at the latest annual balance-sheet date was USD 5,255.0 million, or 3.92x adjusted EBITDA over the trailing twelve months. Interest expense was USD 63.0 million in third-quarter 2026 and USD 195.0 million over nine months. Against quarterly EBITDA of USD 248.0 million, interest absorbs about a quarter of the operating result.
The debt is being refinanced: in the third quarter the company raised USD 50.0 million of commercial paper and repaid USD 122.0 million of long-term debt. Current maturities on the balance sheet fell to zero, and the long-term portion rose to USD 5,354.0 million from USD 5,050.0 million at the end of 2025.
Operating cash flow was USD 193.0 million for the quarter and USD 644.0 million over nine months. Capital expenditure was USD 130.0 million for the quarter, of which USD 54.0 million went to the Monticello plant. Free cash flow after construction and interest remains modest, and the USD 151.0 million quarterly dividend is not fully covered by it.
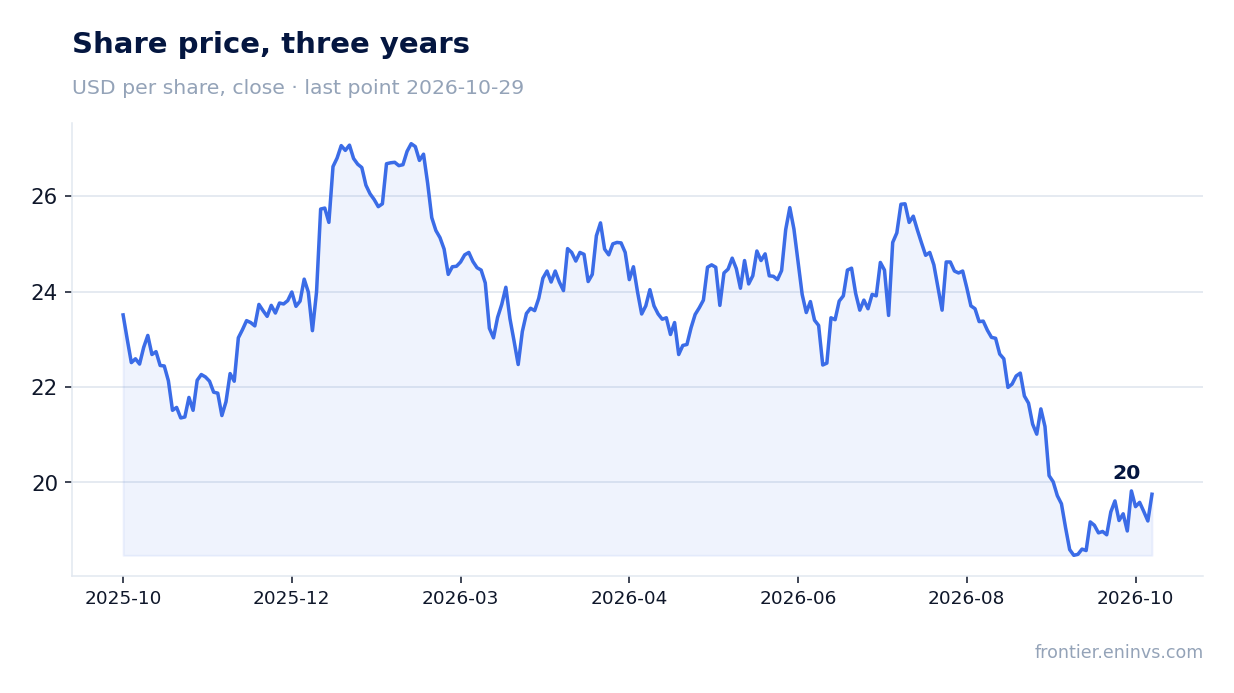
The USD 0.21 per-share dividend yields 4.3% and rests on profit before special items
A dividend of USD 0.21 per share was paid for third-quarter 2026, the same as in each of the year's three quarters. USD 454.0 million was paid over nine months. The yield at the current price is 4.3%.
Our estimate: with profit before special items of USD 229.0 million over nine months and payouts of USD 454.0 million, the annual dividend exceeds profit before special items. Coverage rests on cash flow and on timberland sales, which brought USD 306.0 million over nine months. If such sales stop and EBITDA stays at USD 248.0 million a quarter, the payout would have to be cut or funded with debt.
A 4.3% yield is well above what short-term government debt offers, but for a stock with leverage of 3.92x EBITDA and falling profit it is not a generous premium. A further squeeze in wood-products margins or a pause in land sales could reduce the payout.
The stock is cheaper than its own history on EV/EBITDA: 14.6 versus 19.4 over three years
EV/EBITDA over the trailing twelve months is 14.6 against a three-year average of 19.4. The stock trades 25% below its own history on this multiple. P/E over the trailing twelve months is 31.5, reflecting weak profit: USD 453.0 million over twelve months against a market capitalisation of USD 14,282.4 million.
The discount is explicable: profit is falling, one-off income has gone, and leverage of 3.92x EBITDA limits room for manoeuvre. But the price already reflects the weakness. Return on equity is 6.9%, modest for a forest business, and its recovery is what would trigger a re-rating.
What to watch in the next report is the realised lumber price and the volume of land sales. The USD 510 per thousand board feet price is the main revenue driver, and a reversal would hit the margin faster than the timberlands segment could help.
Valuation on the latest reported figures
| Metric | Value |
|---|---|
| Market cap | 14.3 bn USD |
| P/E (LTM) | 31.5 |
| EV/EBITDA (LTM) | 14.6 |
| P/B | 1.52 |
| Net debt / EBITDA (LTM) | 3.92 |
| Operating cash flow (LTM) | 0.53 bn |
| ROE | 6.9% |
| Dividend yield (12m) | 4.3% |
| EV/EBITDA, 3-year average | 19.4 |
Bottom line
The quarter's strength was revenue: growth accelerated to 8.4% from a 0.9% decline a quarter earlier, and lumber prices rather than volume delivered it. The weakness is in profit: EBITDA down 2.0%, net profit down 23.8%, and a year earlier one-off income supported it, which is now gone. A 4.3% dividend yield and a multiple of 14.6 versus 19.4 over three years make the stock rather attractive, but leverage of 3.92x EBITDA and dividend coverage by profit before special items are the key question for a holder. The verdict is rather attractive.
Open the company's financial profile WY →
See also: market overview · valuation map · stock screeners