YPF: revenue up 41.2%, but profit peaked in Q2 – margin has stepped back from its high

YPF reported third-quarter 2026 results in late September: revenue of USD 6,557 mn, EBITDA of USD 2,131 mn and net profit of USD 1,181 mn. Year on year revenue rose 41.2% and EBITDA 48.8%, while the net margin reached 18.0% against minus 4.4% a year earlier. In our view the share looks attractive at the current price: EV/EBITDA LTM of 3.5 and P/E LTM of 8.8 against net debt of 1.0x EBITDA LTM, with the portal's model pointing to +78% upside to fair value.
Key takeaways
— Revenue rose 41.2% year on year, and the pace was roughly the same as 41.7% in the second quarter
— EBITDA grew 48.8% year on year but fell versus the second quarter – 2,131 mn against 2,699 mn
— Net margin of 18.0% against minus 4.4% a year earlier – operating result, not one-offs, carried the profit
— Operating cash flow of USD 2,863 mn covers profit and keeps net debt at USD 8.3 bn
— Net debt fell from USD 8.8 bn on 30 June to USD 8.3 bn on 30 September, and from USD 9.8 bn a year earlier
— Leverage of 1.0x EBITDA LTM and EV/EBITDA of 3.5 leave room in the valuation at the current price
— The portal's model points to +78% upside to fair value on EBITDA re-priced to current commodity prices
Attractiveness
Key figures, USD bn
| Metric | Q3 2025 | Q3 2026 | Change |
|---|---|---|---|
| Revenue | 4.64 | 6.56 | +41.2% |
| EBITDA | 1.43 | 2.13 | +48.8% |
| Operating profit | 0.56 | 1.92 | +244.9% |
| Net profit | -0.21 | 1.18 | to profit |
| Operating cash flow | 1.23 | 2.86 | +133.7% |
| Capex | -1.15 | — | — |
| EBITDA margin | 30.8% | 32.5% | +1.7 pp |
| Net margin | -4.4% | 18.0% | +22.4 pp |
Revenue rose 41.2% year on year, and the pace was roughly the same as 41.7% in the second quarter
In the third quarter of 2026 revenue reached USD 6,557 mn, up 41.2% year on year. In the second quarter growth was 41.7% – the pace was roughly the same, meaning the company held its high comparison base without slowing.
Quarterly revenue has stayed above USD 6.5 bn for two consecutive quarters: USD 6,574 mn in April–June and USD 6,557 mn in July–September. That is well above 2025 levels, when quarterly revenue ranged between USD 4.5 bn and USD 4.6 bn.
The growth comes off a low base from last year, when quarterly revenue was around USD 4.6 bn. Holding a pace above 40% for two quarters in a row suggests the operating momentum was not a one-off spike.
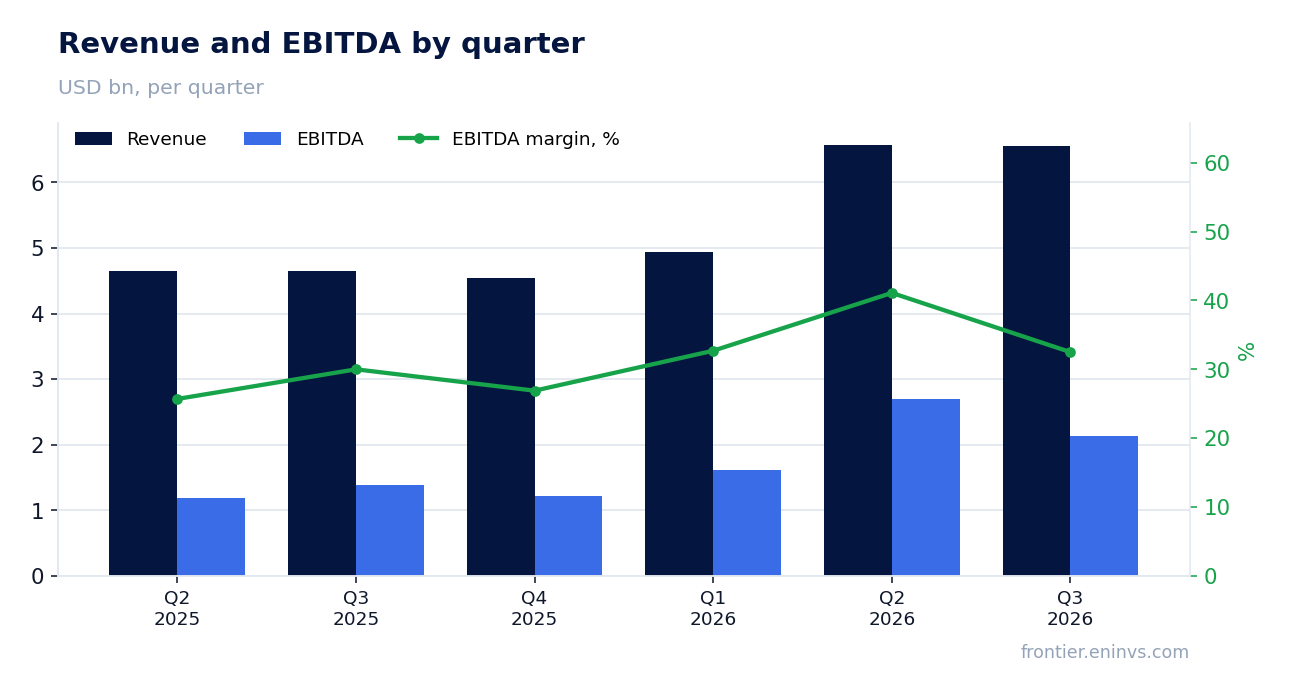
EBITDA grew 48.8% year on year but fell versus the second quarter – 2,131 mn against 2,699 mn
EBITDA for the third quarter was USD 2,131 mn, 48.8% above the year-earlier figure. EBITDA growth outpaced revenue growth, which is the main argument for the quality of the report: margin improved rather than the base simply expanding.
Versus the second quarter, however, EBITDA fell from USD 2,699 mn to USD 2,131 mn. Revenue was almost flat, so the difference came from costs or the sales mix rather than volume.
Operating profit, by contrast, rose from USD 1,821 mn in the second quarter to USD 1,921 mn in the third. The gap versus EBITDA means either an item in second-quarter EBITDA did not repeat, or depreciation was lower in the third quarter.
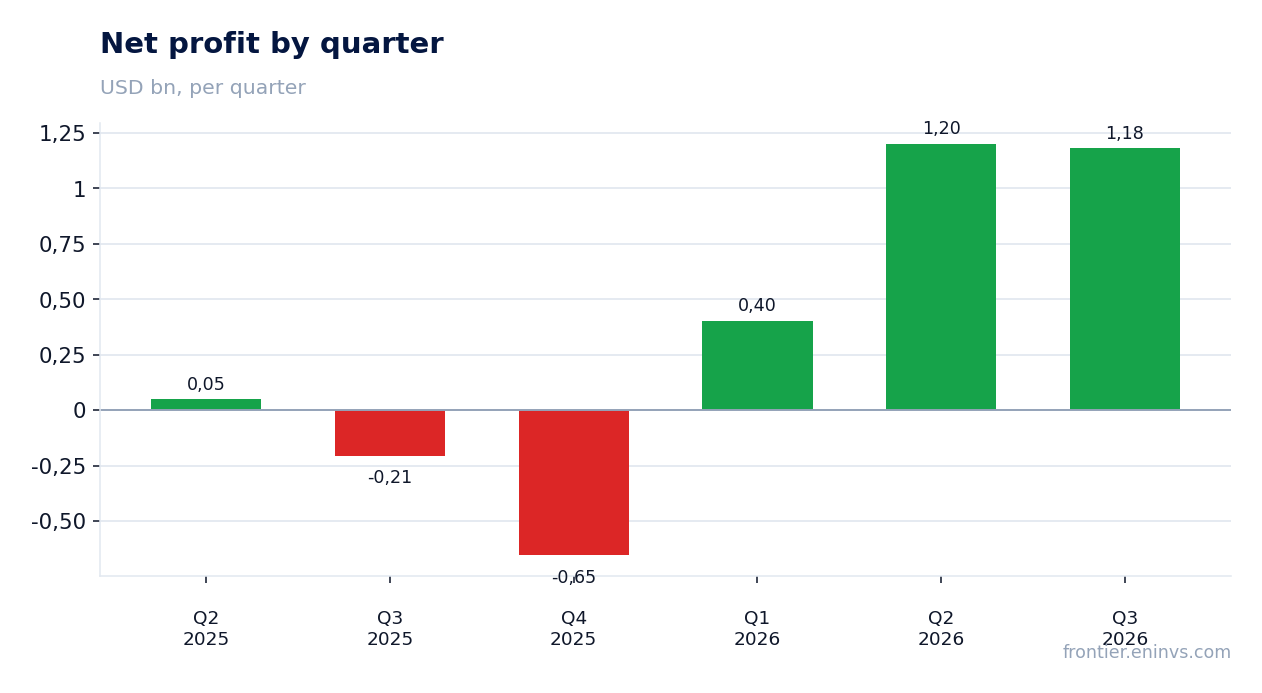
Net margin of 18.0% against minus 4.4% a year earlier – operating result, not one-offs, carried the profit
Net profit for the third quarter was USD 1,181 mn at an 18.0% margin. A year earlier there was a loss with a margin of minus 4.4%, so the swing into profitability is sharp: more than 22 percentage points of margin.
Profit is close to operating profit: USD 1,181 mn against USD 1,921 mn. That means interest and taxes absorbed about USD 740 mn, but there were no large write-offs or one-off losses distorting the picture.
In the second quarter net profit was USD 1,201 mn – slightly above the third quarter, on higher EBITDA. Keeping profit above USD 1.1 bn for two quarters in a row points to a durable result rather than a one-off effect.
Operating cash flow of USD 2,863 mn covers profit and keeps net debt at USD 8.3 bn
Operating cash flow for the third quarter was USD 2,863 mn – more than double net profit. That gap means profit is backed by cash rather than by working-capital build-up.
Over the last twelve months operating cash flow was USD 8,838 mn against EBITDA LTM of USD 8,224.5 mn. Cash flow above EBITDA is a good sign for a capital-intensive business: the company collects cash faster than it accrues depreciation.
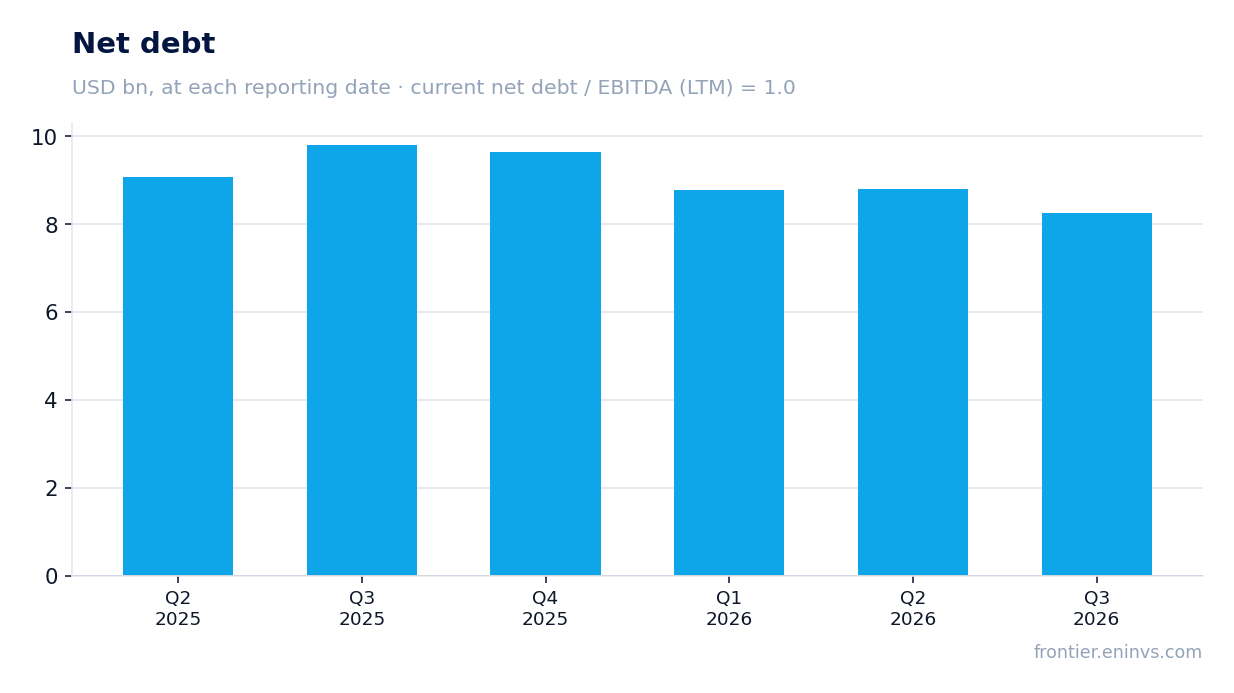
Net debt at 30 September was USD 8,263 mn. It fell from USD 8.8 bn on 30 June and from USD 9.8 bn on 30 September 2025. Deleveraging on rising EBITDA means the cash flow goes to repayment, not just maintenance.
Net debt fell from USD 8.8 bn on 30 June to USD 8.3 bn on 30 September, and from USD 9.8 bn a year earlier
Net debt at 30 September 2026 was USD 8,263 mn. It fell from USD 8.8 bn on 30 June, a decline of USD 0.5 bn over the quarter, and from USD 9.8 bn on 30 September 2025, a decline of USD 1.5 bn over the year.
Net debt to EBITDA LTM stands at 1.0x. At that level interest expense does not weigh on profit, and debt is serviced from operating cash flow without strain.
Cutting debt by USD 1.5 bn over the year while EBITDA nearly doubled means the company is directing free cash to the balance sheet. That builds room for investment or shareholder returns in coming periods.
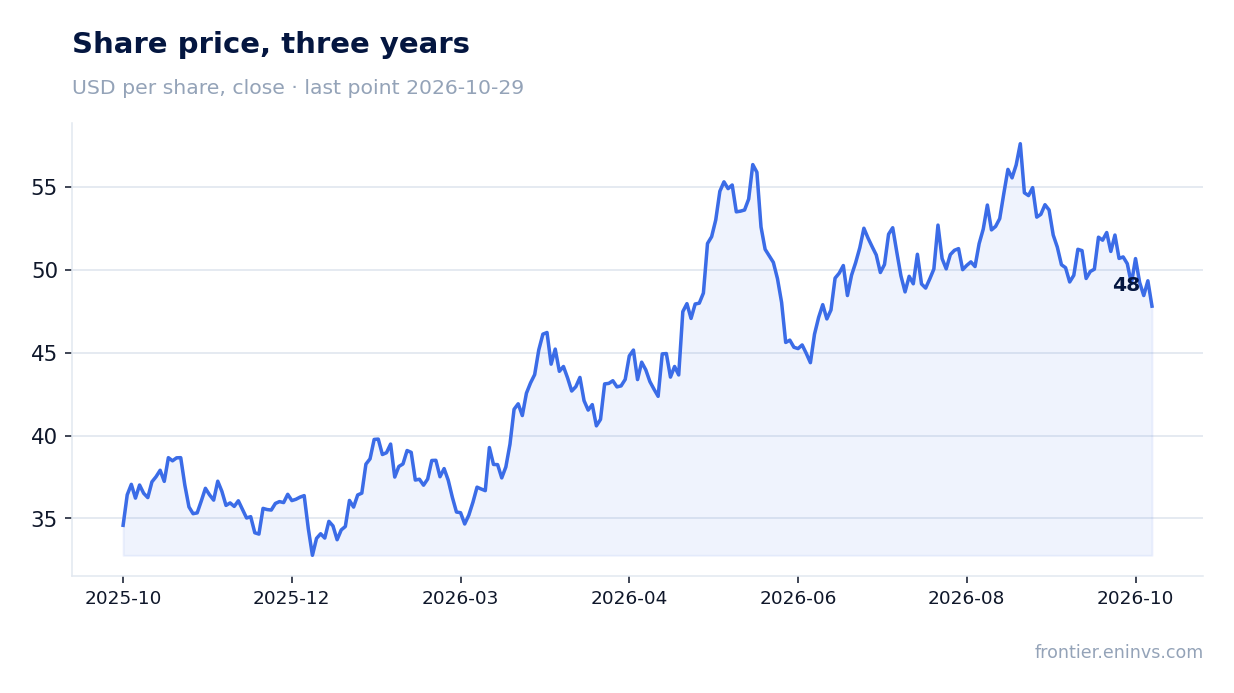
Leverage of 1.0x EBITDA LTM and EV/EBITDA of 3.5 leave room in the valuation at the current price
With a market cap of USD 18,739 mn and net debt of USD 8,263 mn, EV/EBITDA LTM is 3.5 and P/E LTM is 8.8. These are low multiples for a company with growing revenue and a 32.5% EBITDA margin.
Return on equity is 36.0%. With ROE at that level and a P/E below 9, the valuation looks conservative relative to what the company earns.
The portal's model re-prices EBITDA to current commodity prices and, at the target EV/EBITDA, points to +78% upside to fair value. That is our own estimate, not a market consensus.
The portal's model points to +78% upside to fair value on EBITDA re-priced to current commodity prices
Our model recalculates EBITDA at current commodity prices and applies the target EV/EBITDA to the current market cap. At today's prices fair value comes out 78% above the market.
The gap arises because the market values the company on actual EBITDA LTM of USD 8,224.5 mn, while the model uses EBITDA re-priced to current prices. If commodity prices hold, a re-rating of the multiple is likely.
The flip side: the model's upside is sensitive to commodity prices. Lower prices would reduce re-priced EBITDA and narrow the gap, so +78% is an estimate at current conditions, not a guarantee.
Valuation on the latest reported figures
| Metric | Value |
|---|---|
| Market cap | 18.7 bn USD |
| P/E (LTM) | 8.8 |
| EV/EBITDA (LTM) | 3.5 |
| P/B | 1.73 |
| Net debt / EBITDA (LTM) | 1.00 |
| Operating cash flow (LTM) | 8.84 bn |
| ROE | 36.0% |
Bottom line
What was strong in the report was everything tied to cash: revenue rose 41.2%, EBITDA 48.8%, operating cash flow reached USD 2,863 mn and net debt fell to USD 8.3 bn. The weak spot is the quarterly EBITDA trajectory: it fell USD 568 mn versus the second quarter on almost flat revenue, and that is the main question for the durability of the 32.5% margin. With EV/EBITDA of 3.5, P/E of 8.8 and leverage of 1.0x EBITDA LTM the valuation leaves room, and the portal's model points to +78% upside to fair value. The share looks attractive at the current price, but the verdict rests on two things: the margin returning to second-quarter levels and commodity prices holding.
Open the company's financial profile YPF →
See also: market overview · valuation map · stock screeners