Zijin Mining: a 35.1% margin holds, but revenue has slowed for a third straight quarter
On 23 October Zijin Mining reported third-quarter 2026 results: revenue of USD 13,246.8 mn, EBITDA of USD 4,648.3 mn and net profit of USD 2,723.7 mn. The EBITDA margin was 35.1% and the net margin 20.6%, while net debt at the end of September stood at USD 7.7 bn, or 0.58x trailing-twelve-month EBITDA. The stock trades at 9.3x EV/EBITDA against its own three-year average of 11.1, and at the current price it looks rather attractive, although slowing revenue and the portal model's negative reading keep the rating from going higher.
Key takeaways
— Third-quarter revenue of USD 13,246.8 mn is below the two prior quarters, and year-on-year growth slowed from 30.8% in the first quarter to 14.0% in the second
— EBITDA of USD 4,648.3 mn gives a 35.1% margin – above 34% for a second straight quarter and the best level in five quarters
— Net profit of USD 2,723.7 mn at a 20.6% net margin holds close to the second quarter even as revenue fell over the same period
— Net debt rose from USD 6.9 bn on 30 June to USD 7.7 bn on 30 September but fell from USD 15.5 bn a year earlier – the ratio to LTM EBITDA is 0.58
— Trailing-twelve-month dividend yield is 3.3%, with payouts funded from profit rather than debt
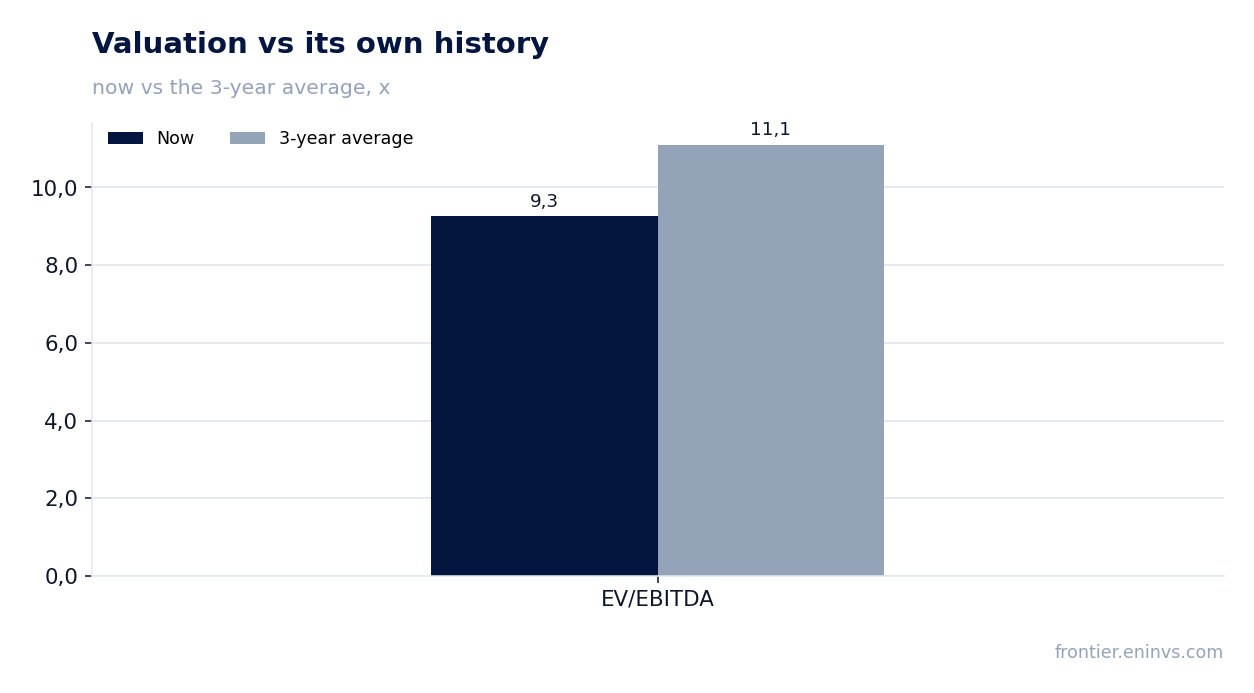
— The stock trades at 9.3x EV/EBITDA against its own three-year average of 11.1 – 17% below its history, with P/E LTM at 15.4 and ROE at 11.7%
— On the portal's model the share is priced 10% above fair value if EBITDA is re-priced at current commodity prices
Attractiveness
Key figures, USD bn
| Metric | — | Q3 2026 | Change |
|---|---|---|---|
| Revenue | — | 13.2 | — |
| EBITDA | — | 4.65 | — |
| Operating profit | — | 4.32 | — |
| Net profit | — | 2.72 | — |
| EBITDA margin | — | 35.1% | — |
| Net margin | — | 20.6% | — |
Third-quarter revenue of USD 13,246.8 mn is below the two prior quarters, and year-on-year growth slowed from 30.8% in the first quarter to 14.0% in the second
Third-quarter revenue came in at USD 13,246.8 mn – below USD 14,207.3 mn in the first quarter and USD 14,040.6 mn in the second. The sequential decline is modest, around 5.7%, but it is the second consecutive quarter of decline after the peak at the start of the year.
Year-on-year momentum weakened noticeably: revenue grew 30.8% in the first quarter and 14.0% in the second. That is a deceleration, not an acceleration, and it matters more than the quarterly level: the company is still growing, but the growth rate has more than halved in three months.
The facts do not disclose the cause of the slowdown. What is visible is that absolute revenue is falling quarter to quarter while the annual increase remains double-digit. For further growth, what matters is not the level itself but whether revenue returns above USD 14 bn in the next report.
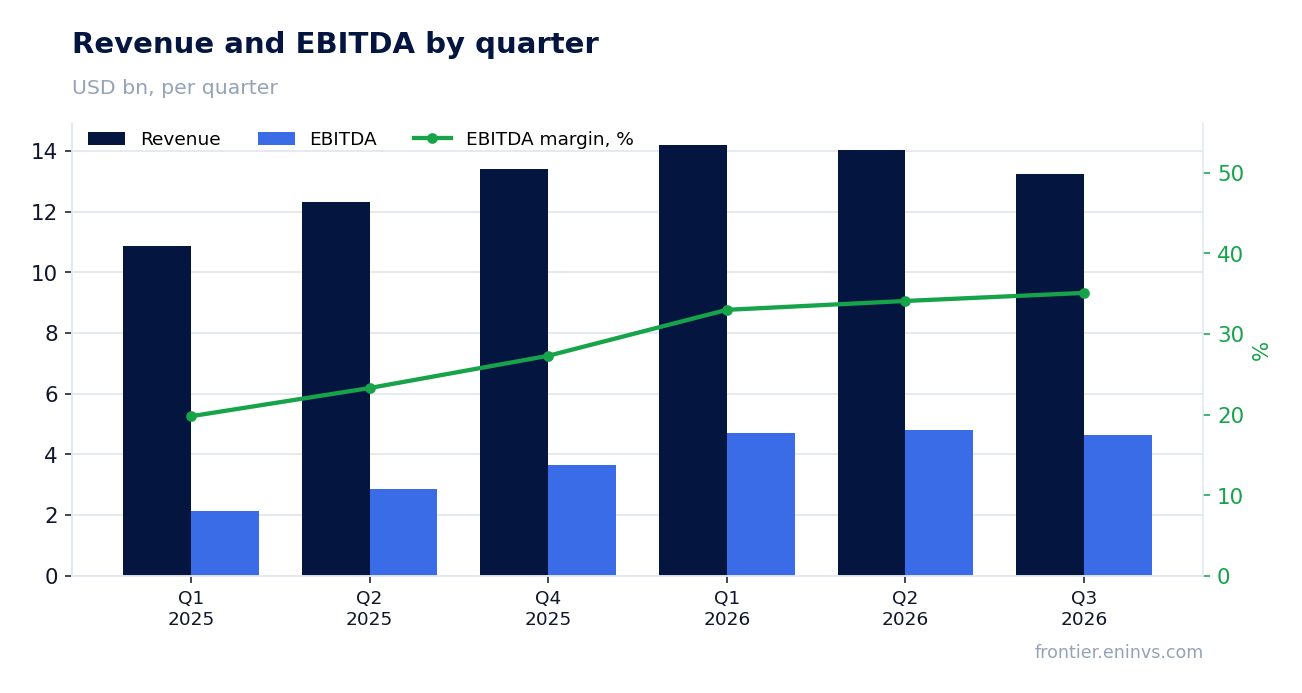
EBITDA of USD 4,648.3 mn gives a 35.1% margin – above 34% for a second straight quarter and the best level in five quarters
Third-quarter EBITDA was USD 4,648.3 mn on revenue of USD 13,246.8 mn – a 35.1% margin. That is slightly below USD 4,793.2 mn in the second quarter but above USD 4,692.1 mn in the first, and relative to revenue the margin sits at a five-quarter high.
Operating profit was USD 4,324.4 mn, so the gap between EBITDA and operating profit is about USD 324 mn. That is a small difference and suggests depreciation does not absorb a large share of EBITDA.
The margin did not rise on one-off items: EBITDA fell with revenue, but more slowly. With revenue down 5.7% quarter on quarter, EBITDA fell only 3.0%, and that is what held the margin above 35%. The facts do not disclose which cost line contracted.
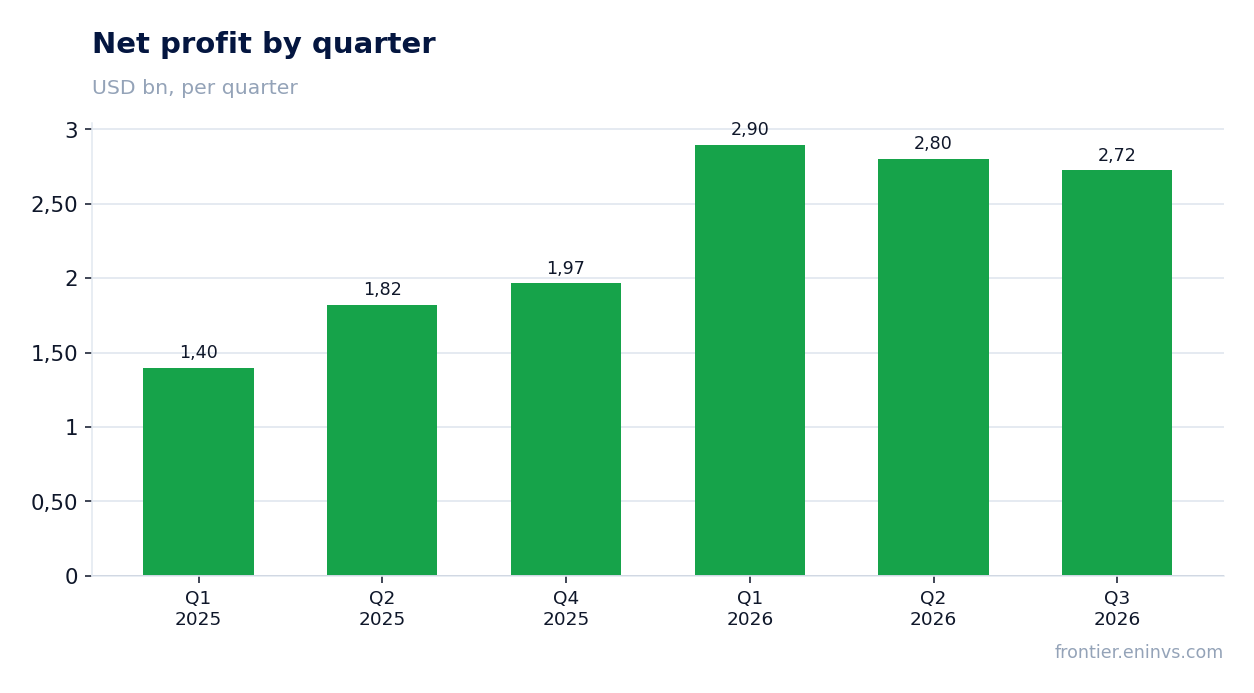
Net profit of USD 2,723.7 mn at a 20.6% net margin holds close to the second quarter even as revenue fell over the same period
Third-quarter net profit was USD 2,723.7 mn, a 20.6% net margin. Quarter on quarter profit fell from USD 2,801.4 mn, or 2.8%, while revenue dropped 5.7%.
Profit is holding up better than revenue: the margin did not sag despite the weaker top line. That is consistent with the EBITDA picture – the company keeps costs in check even as sales decline.
Over the trailing twelve months net profit was USD 7,222.8 mn. That is the base for the dividend and for the 15.4x P/E LTM; the quarterly USD 2,723.7 mn is part of that result, not a separate benchmark.
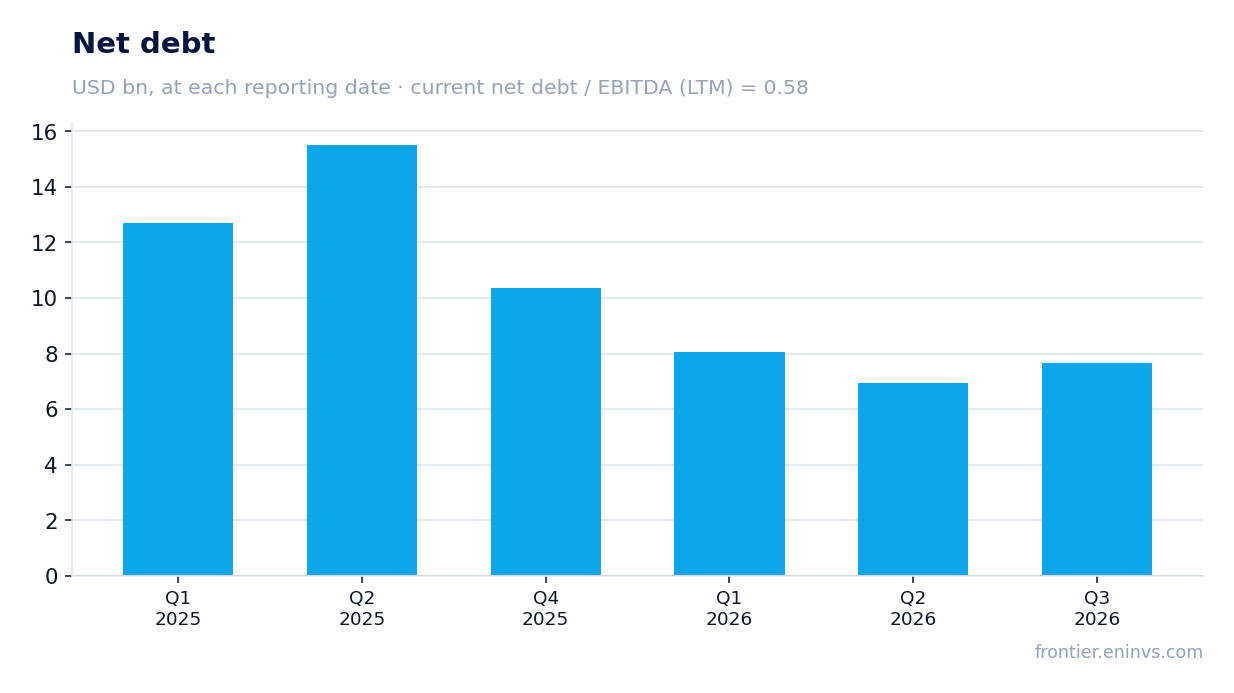
Net debt rose from USD 6.9 bn on 30 June to USD 7.7 bn on 30 September but fell from USD 15.5 bn a year earlier – the ratio to LTM EBITDA is 0.58
Net debt at 30 September was USD 7.7 bn against USD 6.9 bn on 30 June – an increase of USD 0.7 bn over the quarter. Over the year debt fell substantially: from USD 15.5 bn on 30 June 2025 to USD 7.7 bn on 30 September 2026, a drop of USD 7.9 bn.
The ratio of net debt to trailing-twelve-month EBITDA is 0.58. That is a moderate level: debt is less than annual EBITDA by more than a factor of 1.5. The facts do not disclose the direction of the ratio, so this is a level, not a statement that leverage rose or fell.
The quarterly increase of USD 0.7 bn does not look alarming against the annual reduction of USD 7.9 bn. The company can service debt from current EBITDA, and the headroom in the ratio remains large.
Trailing-twelve-month dividend yield is 3.3%, with payouts funded from profit rather than debt
The trailing-twelve-month dividend yield is 3.3% on the current price. Payouts rest on profit: net profit over the last twelve months was USD 7,222.8 mn, and the dividend base is built from it rather than from borrowed funds.
Our estimate of the current-year dividend starts from LTM profit of USD 7,222.8 mn and the current 3.3% yield. It hinges on the payout ratio the company maintains and on whether profit holds at the trailing-twelve-month level as revenue slows.
A 3.3% yield is modest next to high-payout names, but it is stable: debt at 0.58x EBITDA puts no pressure on payouts. What could reduce the dividend is a further fall in revenue and profit if the slowdown continues.
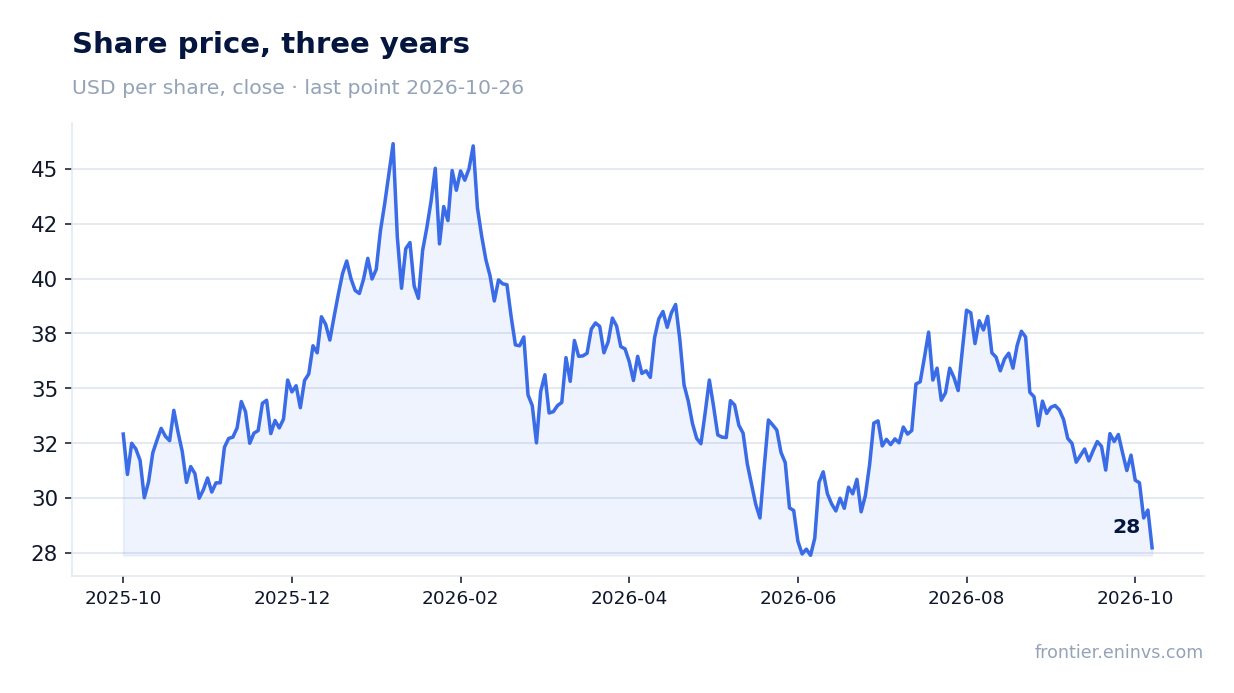
The stock trades at 9.3x EV/EBITDA against its own three-year average of 11.1 – 17% below its history, with P/E LTM at 15.4 and ROE at 11.7%
On trailing-twelve-month EV/EBITDA the stock trades at 9.3 against its own three-year average of 11.1 – 17% below its history. That is the only comparison the facts support; we do not benchmark it against sector peers.
P/E LTM is 15.4 with ROE at 11.7%. The return on equity is moderate, which explains why the market does not pay a premium to the stock's own history.
On the portal's model the share is priced 10% above fair value if EBITDA is re-priced at current commodity prices. That is our own model, not a market consensus, and it points to limited upside from the current price.
On the portal's model the share is priced 10% above fair value if EBITDA is re-priced at current commodity prices
The portal's model re-prices EBITDA at current commodity prices and values the stock at a target EV/EBITDA. On that basis the share comes out 10% above fair value.
This is not a market consensus or a target price: the model shows that at current commodity prices the upside is limited. The market capitalisation of USD 111,053 mn already reflects a significant part of current profit.
The gap with the multiple-based view is explainable: EV/EBITDA is below its own history, but the model at current commodity prices sees little headroom. For a holder this means further gains depend on commodity prices and on whether revenue returns to growth.
Valuation on the latest reported figures
| Metric | Value |
|---|---|
| Market cap | 111 bn USD |
| P/E (LTM) | 15.4 |
| EV/EBITDA (LTM) | 9.3 |
| P/B | 4.19 |
| Net debt / EBITDA (LTM) | 0.58 |
| ROE | 11.7% |
| Dividend yield (12m) | 3.3% |
| EV/EBITDA, 3-year average | 11.1 |
Bottom line
The report's strength remains the margin: EBITDA of USD 4,648.3 mn at a 35.1% margin and net profit of USD 2,723.7 mn at a 20.6% margin are holding up better than revenue. The weak spot is the top line: USD 13,246.8 mn is below the two prior quarters, and year-on-year growth slowed from 30.8% to 14.0%. Debt at 0.58x EBITDA and a 3.3% dividend yield support the stock, but the portal model sees it 10% above fair value. The key question for a holder is whether revenue returns to growth while the margin still holds.
Open the company's financial profile ZIJIN →
See also: market overview · valuation map · stock screeners